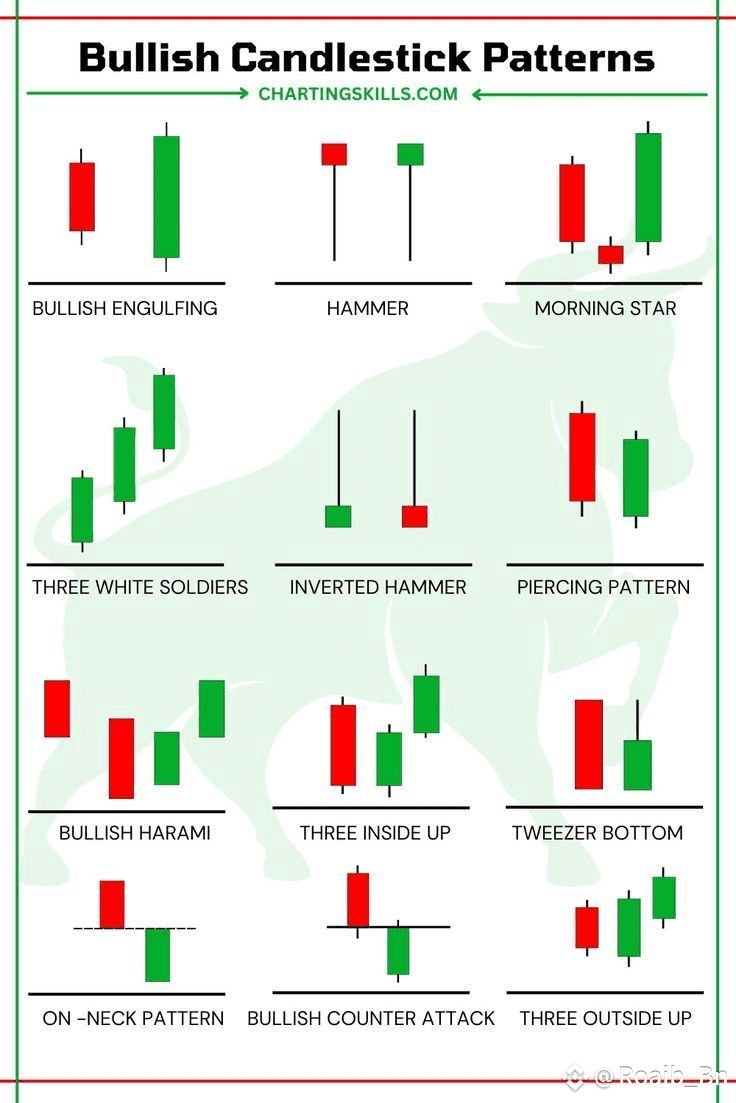
🔰 1. Bullish Engulfing
A small red candle is fully “engulfed” by a larger green one — signals strong buyer takeover after a downtrend.
🔨 2. Hammer
A small-bodied candle with a long lower wick — often seen at the bottom of a downtrend, signaling bullish reversal.
🌅 3. Morning Star
A three-candle pattern (red, small-bodied, then green) that shows market exhaustion and bullish recovery.
🪖 4. Three White Soldiers
Three strong green candles in a row — a clear uptrend confirmation after a bearish phase.
---
🔃 5. Inverted Hammer
Looks like a hammer flipped upside down — indicates reversal strength when found at the bottom.
✂️ 6. Piercing Pattern
A green candle opens below the previous red candle but closes beyond its midpoint — shows buyers pushing back.
👶 7. Bullish Harami
A small green candle completely inside a previous red candle — suggests indecision turning into bullish bias.
---
🔁 8. Three Inside Up
Bearish candle, followed by a small green candle, then another green candle breaking highs — strong reversal signal.
🟩 9. Tweezer Bottom
Two candles with matching lows (usually red + green) — shows buyers defending a price level.
📉➡️📈 10. On-Neck Pattern
A red candle followed by a green one that closes near the red candle’s low — often leads to upward reversal.
---
⚔️ 11. Bullish Counter Attack
The market opens low after a red candle but closes at the previous candle’s close — strong buyer reaction.
🔼 12. Three Outside Up
Bearish candle, then a larger green engulfing it, followed by another green candle — confirms bullish momentum.
---
🧠 Pro Tip:
These patterns are best used with volume confirmation, trend analysis, and key support zones.
---
📷 Visual reference below 👇
💬 If this helped you decode the charts, Follow, Like & Comment to stay ahead with more smart trading insights. 🚀
#美国非农数据 #TrumpTariffs #MarketPullback #WhiteHouseDigitalAssetReport #SECProjectCrypto
