I once thought I was the fearless captain of the cryptocurrency sea until that '312 black swan' made me sink. A position of 5 million was wiped out in half an hour, and the cold touch of the phone screen is still unforgettable.
But despair is often the catalyst for wisdom, leading to a sudden realization: the essence of contracts is probabilistic gambling. Using the remaining 800,000 capital, combined with the 'dynamic hedging model', in February of this year, I achieved an asset leap to 2.18 million in 60 days, with a growth rate of 272,900%!
Now, I will share this 'MVRV indicator' for free - in the crypto world, learning to dance with risk is the true way to survive.
From historical performance, MVRV is an incredibly accurate indicator that can tell you the market's bottom and top from a macro perspective.
Summary: From historical performance, MVRV is an incredibly accurate indicator that can tell you the market's bottom and top from a macro perspective. A series of indicators surrounding MVRV are of significant reference for long-term investors.
Compared to traditional financial markets, the crypto asset field has some unique indicators, stemming from the characteristics of blockchain technology. This is specifically reflected in the utilization of on-chain data, where MVRV is a particularly distinctive indicator.
The following will provide a detailed explanation of the MVRV indicator starting from the RV indicator, followed by a comparison of BTC-MVRV, LTC-MVRV, and BCH-MVRV's different performances in bull-bear cycles, and finally analyze the three variants of the MVRV indicator: MVRV Z-Score, RVT, and VWAP ratio.
I. What are RV and MVRV?
MVRV is a relative indicator representing the ratio of circulating market cap (Market Cap, MV) to realized market cap (Realized Cap, RV), first proposed by Murad Mahmudov & David Puell, expressed as:
MVRV = MV / RV
Among them, Realized Cap is calculated based on the UTXO model, summing the 'last corresponding value' of all coins on-chain. Compared to circulating market cap (current circulation * market price), RV has the following advantages:
(1) Reduced the impact of the portions that have exited circulation (or lost parts)
(2) Considered the market value of each coin when moving on-chain
(3) Can indirectly reflect the cost of chips for long-term holders
In the actual data processing process, in order to avoid dust attacks on UTXO (similar to account balance), the calculation of the RV indicator is somewhat more complicated, specifically implementing the following points:
(1) For coins moved when UTXO balance increases, the value of the incoming coins is calculated at the price when moved.
(2) For coins moved when UTXO balance decreases, the transfer will 'activate' all coins in that UTXO, and the value of all coins in that UTXO will be calculated based on the market price at the time they were moved.
For example, as of today, a certain Bitcoin wallet balance has experienced five transactions in May 2016, April 2017, March 2018, February 2019, and January 2020, with corresponding amounts of +10BTC, +6BTC, -3BTC, -5BTC, +1BTC. The RV calculation for all BTC in that wallet is as follows:
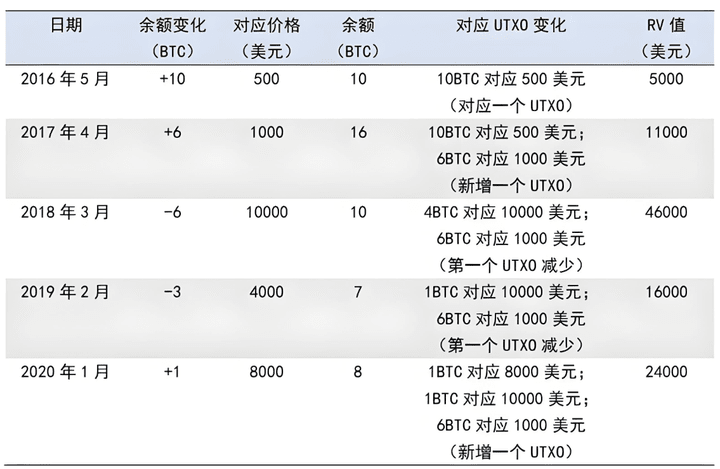
This means that based on the different attributes of the amounts transferred in or out, the realized market cap of the address balance is $24,000. If we do not distinguish between transfers in or out, the corresponding realized market cap would be $64,000 (8*8000 dollars). In comparison, the $24,000 realized market cap after distinguishing between transfers in and out better reflects the holding cost of that address.
Because RV can approximate the long-term cost of all Bitcoin holders in the market (there may be significant deviations in extreme cases), it is usually lower than MV in the context of increasing demand for Bitcoin in the market. The 'market cap' that RV and MV differ from may come from short-term market suppliers (selling pressure brings downward risk), or long-term market stabilizers (or the last ones to endure). Thus, the MVRV ratio indirectly reflects the degree of imbalance between supply and demand for Bitcoin in the secondary market, and can further reflect the extent to which market prices are undervalued or overvalued.
II. MVRV and Bull-Bear Cycles
(1) Bitcoin Bull-Bear Cycles and BTC-MVRV
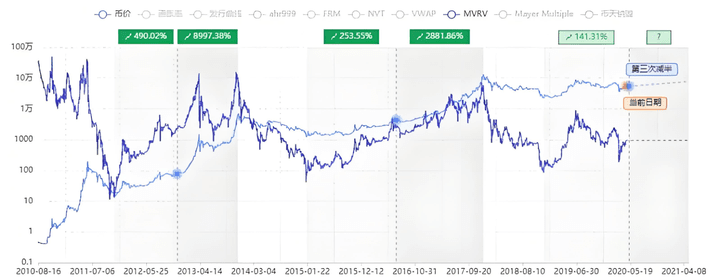
Looking at Bitcoin's price trend over the past decade, it shows an overall upward trend. From a macro perspective, it can be divided into three bull-bear cycles:
The first cycle, from July 2010 to June 2011, saw the Bitcoin price rise from around $0.05 to $191.81, and then quickly fall to $2.29 in November 2011.
The second cycle saw Bitcoin's price rise from around $2.3 in December 2011 to $1,149.14 in November 2013, and then fall sharply to $203.86 in August 2015.
The third cycle, from August 2015 to December 2018, saw prices continuously rise from around $200 to about $19,500, followed by continuous bottom testing (or possibly a second bottom).
Over the past decade, the MVRV ratio has generally maintained between 1-3, with its peak and trough closely aligning with the peaks and troughs of bull and bear markets. Below is a comparison of BTC-MVRV's different performances during the three bull-bear cycles.
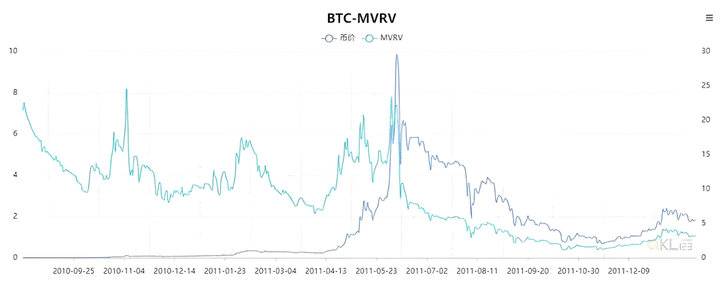
During the first cycle, especially before the bull market in June 2011, MVRV was extremely unstable, generally maintaining between 2-8. This was a manifestation of the early immaturity of the Bitcoin market, where speculation and hype were significant, and many bitcoins moved on-chain also exhibited great instability, including many bitcoins that may have been lost during this period. As Bitcoin's price quickly fell, MVRV also saw a significant drop, reaching a historic low of 0.4.
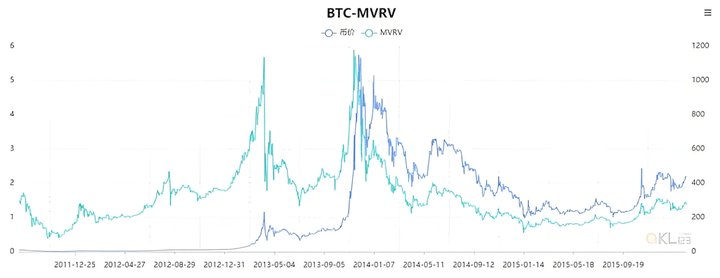
During the second cycle, MVRV rose alongside the price increase, peaking at 1.4, but subsequent price declines brought it back down to a low of 0.85. It then rose all the way up to over 5.6, corresponding to the two price peaks before the end of the bull market. The bear market trough (from January to October 2015) saw MVRV mostly hovering between 0.8 and 0.9. A long period where MVRV is below 1 indicates that many long-term holders have fallen into a loss, corresponding to a market turning from bearish to bullish.
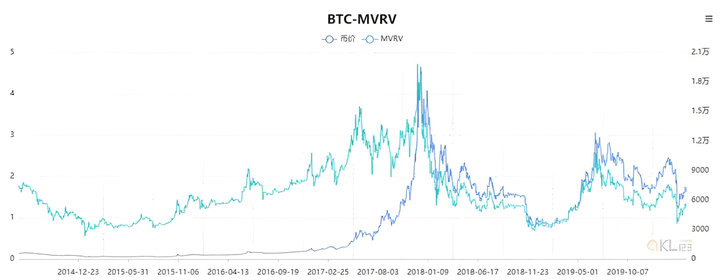
During the third cycle, as Bitcoin's price continued to rise, MVRV reached extreme levels greater than 4 (price severely overvalued) near the bull market peak. After that, Bitcoin entered a bear market, with MVRV maintaining between 0.7 and 0.9 during the bear market trough from November 2018 to March 2019. In early April, it broke through 1, ushering in another round of rising prices. However, MVRV peaked at 2.57 at the end of June before retreating with the price, especially under the impact of the COVID-19 black swan, this value briefly fell below 1 before quickly rebounding to around 1.3. Although Bitcoin's price is currently at a historically low level, the possibility of a second bottom is not ruled out (MVRV may fall below 1 again).
(2) MVRV performance of Litecoin and Bitcoin Cash
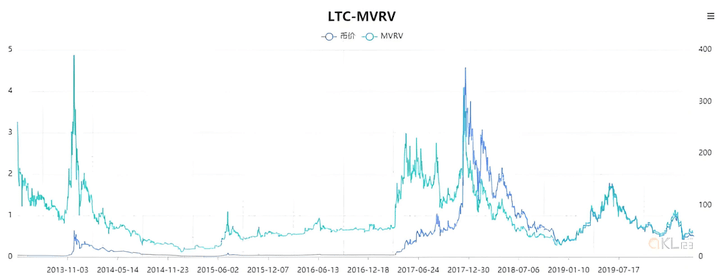
Litecoin was born in November 2011, nearly three years after Bitcoin. During 2013, LTC-MVRV performed similarly to BTC-MVRV in the first cycle, maintaining a relatively high level (between 1-6), but overall lower than the latter. Moreover, the bear market lows in early 2015 and late 2018 saw LTC-MVRV drop to 0.1 and 0.3 respectively. However, the LTC-MVRV corresponding to the peak of the bull market at the end of 2017 was close to BTC-MVRV. This situation arises partly because Litecoin's market cap is relatively small, making it more susceptible to market sentiment, resulting in greater price volatility; on the other hand, Bitcoin is more recognized in the market, and Litecoin's relative valuation is lower, leading LTC-MVRV to show a lower level over the long term.
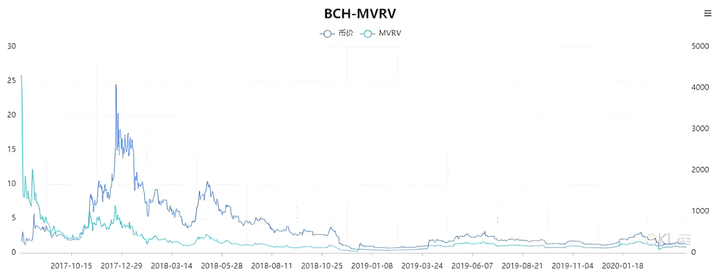
BCH split from the Bitcoin community in 2017. Before the bull market, BCH-MVRV fluctuated significantly between 2-6, similar to Bitcoin's early performance. After the bull market, BCH-MVRV declined with price fluctuations, dropping to a low of 0.22 at the end of 2018. After a surge in April 2019, it peaked at 1.6 at the end of June that year, similar to LTC-MVRV's performance. However, currently BCH-MVRV is around 0.8, while LTC-MVRV is around 0.6, meaning Bitcoin Cash's relative valuation is higher than Litecoin's, but still not as high as Bitcoin's.
III. Three Variants of the MVRV Indicator
(1) MVRV Z-Score
MVRV Z-Score was first introduced by Awe & Wonder, and is a derived indicator optimized from the MVRV indicator. MVRV Z-Score reflects the degree of deviation between market cap and realized market cap, essentially representing the standard deviation between market cap and realized market cap. The calculation formula is as follows:

Among them, StdDev(MV) is the standard deviation of market cap. Its usage and MVRV are similar, used to determine whether Bitcoin is severely overvalued or undervalued. Awe & Wonder pointed out in the article that the accuracy rate of this indicator for judging trend direction is as high as 90%.
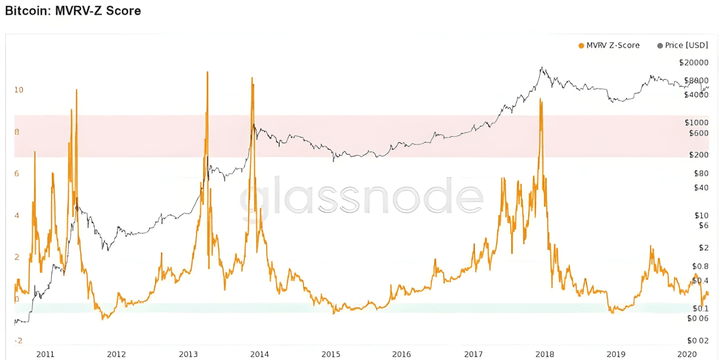
Due to the smoothing effect of standard deviation on short-term extreme changes, the MVRV Z-Score is relatively smoother than MVRV. Moreover, it better reflects changes in long-term trends, providing a certain improvement in the accuracy of trend judgment. In addition, compared to the cyclical changes of MVRV ratio, the use of MVRV Z-Score is more intuitive. In the figure, the green zone corresponds to the market bottom zone, while the red zone corresponds to the market peak zone.
(2) RVT Ratio
The RVT ratio was first created by David Puell, representing the ratio of realized market cap (RV) to on-chain transaction volume (Transaction Volume). The difference from MVRV is that RVT uses realized market cap as the numerator and on-chain transaction volume as the denominator. The calculation formula is as follows:
RVT = RV / TV
Among them, TV represents the on-chain transaction volume. Since the crypto asset market has mainly been driven by speculative demand in the secondary market over the past decade, there is a strong correlation between on-chain transaction volume and secondary market capitalization. Therefore, the RVT ratio and MVRV have similar uses, both can be used to judge market bottoms and tops over long cycles.
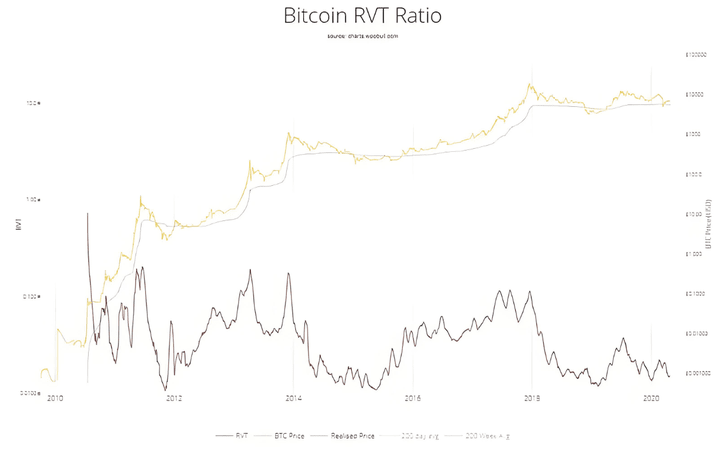
Observing the performance of RVT over the past decade, the RVTs corresponding to the bear market bottom phases in 2012, 2015, and 2019 were generally between 0.010 and 0.013, while the price peaks in 2011, 2013, and 2017 were all above 0.110. Compared to MVRV, RVT is slightly less accurate in determining the major cycle bull-bear bottoms and tops, but is relatively clearer in judging certain phase peaks and troughs.
(3) On-chain VWAP Ratio
The on-chain VWAP ratio (VWAPR) is the ratio of market price to on-chain VWAP, where on-chain VWAP can be seen as a variant of RV. Its calculation formula is as follows:
VWAPR = Price / VWAP
Among them, VWAP stands for Volume Weighted Average Price, which is calculated by weighting the price by the trading volume over a certain period. The specific calculation method involves multiplying the price by the corresponding trading volume, summing them up, and then dividing by the total trading volume to obtain the VWAP ratio. Here, the VWAP is not the same as the VWAP in the secondary market, but an on-chain data calculation indicator.
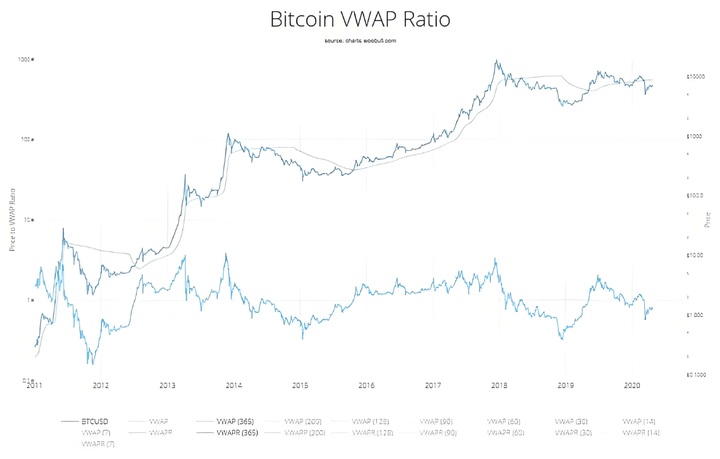
Due to differences in calculation periods, VWAPR can vary: Short periods (7 to 90 days) can be used to judge short-term highs or lows, while long periods are suitable for determining highs and lows over larger cycles. Here, only the 365-day weighted value is compared with MVRV. Observing the VWAPR (365) over the past decade, it can be found that the bear market bottoms in 2012, 2015, and 2019 corresponded to VWAPR values below 0.4, while the peaks in 2011, 2013, and 2017 were all above 3.0. It can be seen that VWAPR (365) closely matches the accuracy of MVRV's judgments, but the former becomes more flexible and variable depending on the selected period.
Lastly! If you're currently losing money in crypto and doubting life, take 3 minutes to read this article, it might help you turn your situation around.
Remember this twelve-character mantra: cut losses when wrong, hold tight when right, small losses lead to big gains. How to play specifically?
1. Look at the overall trend
When the 5-day moving average is above, only go long; when it's below, only go short. Don't go against the trend, or you will suffer greatly.
2. Test water positions
Look for positions where the stop-loss is only $1, but can earn 10 times. Usually, at the bottom of the market when it just starts, if you're wrong, you only lose the equivalent of a meal.
3. Cutting losses should be quick
If the key level breaks, cut immediately, don't fall in love with the position. If the market rebounds after cutting, then you can re-enter, it's better than getting liquidated.
4. Adding positions is the key
After making the first wave of profits, wait for a pullback to the support level to add positions. Remember: adding positions should be as cautious as opening the first order.
5. Move the stop-loss
Each time you add a position, raise the stop-loss. That way, in the end, you only have profits running, and you can sleep well.
6. Let profits fly
Don’t act like you’ve never seen money before, running away with just a 10% profit. The real fat meat is still ahead, wait for a clear topping signal before dumping all at once.
These 6 points seem simple, but 90% of people fail due to execution. If you can control your hands, making money is just a matter of time. When I understood this, my account balance started skyrocketing. Now it's your turn.
The above are trading insights from 10 years of cryptocurrency speculation, having experienced many ups and downs. These are heartfelt words of enlightenment, hoping they will be useful to everyone. Quality products from Yan An, in the crypto world, there are beauties that are unique and independent, with a spiritual path to follow and a skill to master cryptocurrencies!
No matter how diligent a fisherman is, he won't go out to fish in the stormy season, but will guard his boat carefully, knowing that this season will pass, and a sunny day will come! Follow me, and I will teach you fishing and how to fish; the door to the crypto world is always open, only by going with the flow can you have a life of ease. Save this in mind!