I have been trading cryptocurrencies for over 10 years. In the first three years, I suffered significant losses and was in debt of 3 million. After self-adjustment, I achieved financial freedom over the last seven years, maintaining stable compound growth, with a monthly income in the seven figures and an annual income in the eight figures!
Success is definitely not accidental; every successful person has gone through numerous trials and walked step by step. It cannot be denied that some people are born geniuses, but such individuals are rare, neither you nor I are. Most people gradually approach perfection after experiencing failures. It is precisely these failures that lead to many insights that shortcuts cannot provide.
A common saying is that there are no good opportunities; in reality, opportunities are reserved for those who are prepared. Only when the opportunity arises can one be ready to seize it. Waiting passively for opportunities, like waiting for a rabbit to come to you, will lead to either missing out or being unable to grasp it when the opportunity truly appears.
Although it is said that bear markets do not indicate a bottom and bull markets do not indicate a top, many people seem to like to seek answers to this question. So, in the spirit of research, in this share, we will simply discuss 15 reference indicators for escaping the peak of Bitcoin.
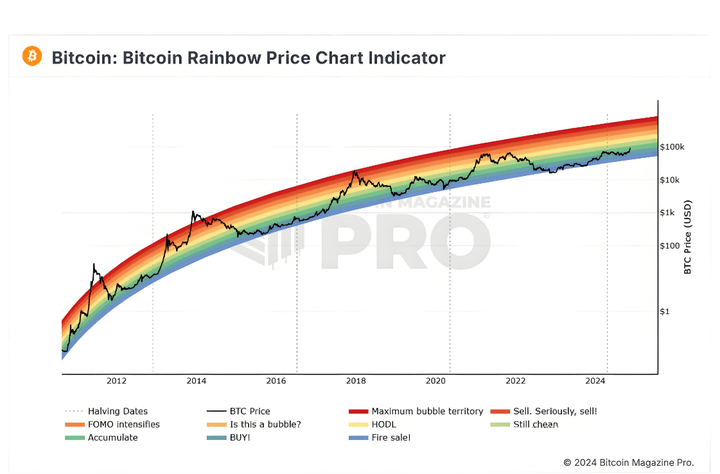
The 1st indicator: Rainbow Price Chart Indicator
As a long-term valuation tool for Bitcoin, the rainbow chart indicator should be quite familiar to everyone, or at least you should have heard of it. This indicator uses a logarithmic growth curve to predict the potential price direction of Bitcoin in the future, overlaying a rainbow band on top of the logarithmic growth curve channel to highlight market sentiment at each rainbow color stage as Bitcoin prices move. The suggested peak escape position can be chosen between the yellow and red areas. As shown in the figure below.
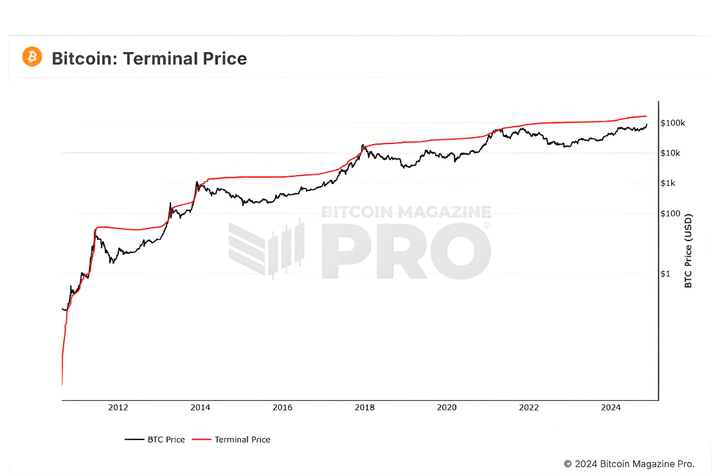
The second indicator: Terminal Price
Historically, this indicator has been relatively effective in predicting the peaks of Bitcoin price cycles. For example, during the bull peak in November-December 2017, Bitcoin prices touched the red line, and again during the bull peak in March-May 2021, Bitcoin prices once again touched the red line. According to this indicator, we should sell as soon as the price of Bitcoin approaches or touches the red line again. Currently, the displayed position of the red line is around $170,000. As shown in the figure below.
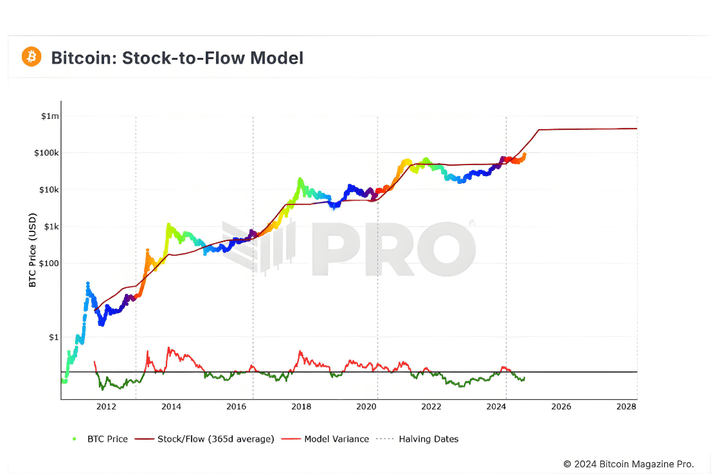
The 3rd indicator: Stock-to-Flow Model (S2F Model)
Over time, the price of Bitcoin changes in relation to its stock and circulation. When the price is above the S2F level, the divergence line changes from green to red. When the price is below the S2F line, the divergence line changes from red to green. Based on the current trend of this indicator, the first quarter of next year (2025) seems to be a favorable time to sell. As shown in the figure below.
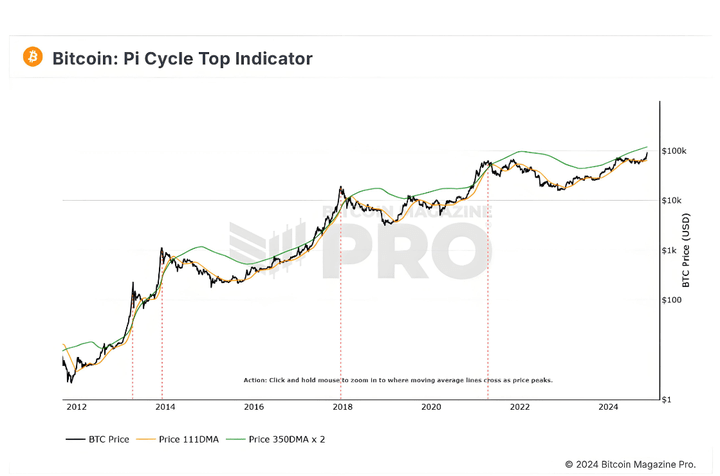
The 4th indicator: Pi Cycle Top Indicator
This indicator uses 111DMA (i.e., 111-day moving average) and 350DMA x 2 (i.e., the multiple of the 350-day moving average) to identify the top of market cycles. Historically, in the past three bull market cycles, when 111DMA rises and crosses 350DMA x 2, we see it aligns with Bitcoin's price peaks. Currently, the green line of this indicator (350DMA x 2) is $120,000, which means that Bitcoin may peak after breaking through $120,000 in this bull market. As shown in the figure below.
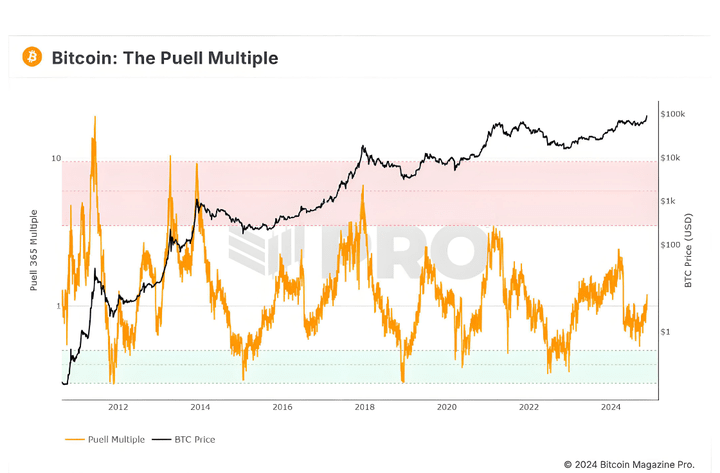
The 5th indicator: The Puell Multiple
This indicator primarily highlights two important range areas for Bitcoin. The Puell Multiple entering the green box area indicates a period of extremely low Bitcoin value, while entering the red box area indicates a period of extremely high Bitcoin value. We need to sell when the Puell Multiple approaches or enters the red area. However, considering the current market situation, the suggestion here is to consider batch selling when this indicator exceeds 2 and to escape the peak when it exceeds 3. As shown in the figure below.
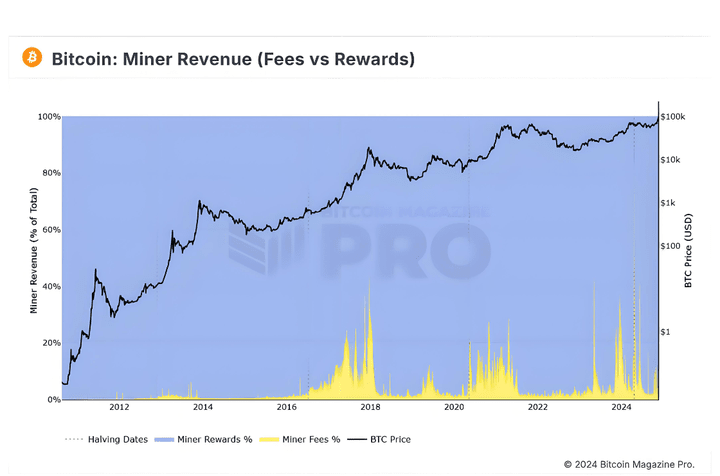
The 6th indicator: Miner Revenue (Fees vs Rewards)
Historically, during previous bull markets, whenever the price of Bitcoin began to peak, the percentage of fees would rise sharply, as demand for Bitcoin naturally increases during bull markets with more new participants entering the market and generating more transactions. Based on current indicators, when miner fees account for more than 30%, it may be time to consider selling Bitcoin in batches. As shown in the figure below.
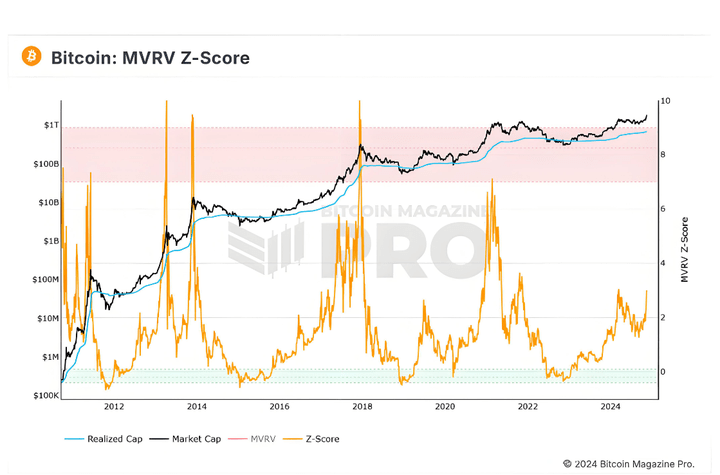
The 7th indicator: MVRV Z-Score
This indicator determines whether Bitcoin is undervalued or overvalued. Historically, since 2011, whenever the MVRV Z-score approaches or exceeds 7, it indicates that the market is entering a peak. As shown in the figure below.
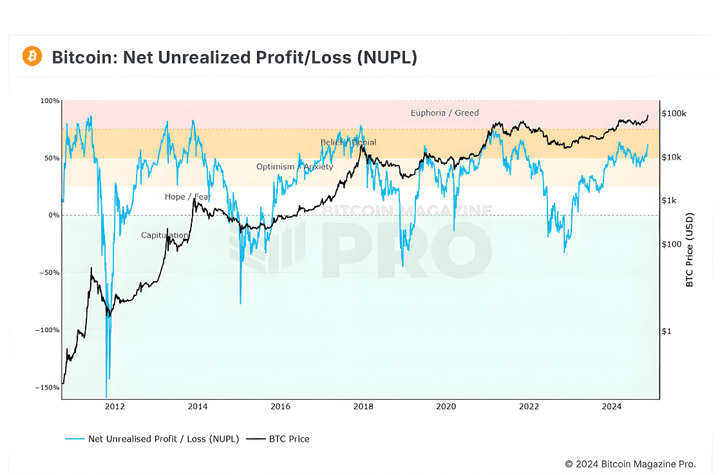
The 8th indicator: Net Unrealized Profit/Loss (NUPL)
This indicator is used to assess the total profit/loss on Bitcoin held by investors. Historically, whenever this indicator approaches or reaches 75%, it may be time for you to consider escaping the peak. As shown in the figure below.
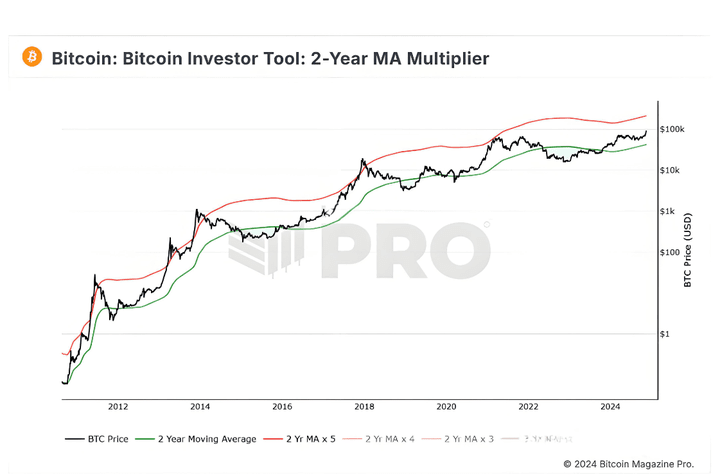
The 9th indicator: 2-Year MA Multiplier
This indicator uses a 2-year MA (Moving Average), along with the multiplication of that moving average, i.e., 2-year MA x 5, to predict the price of Bitcoin. Historically, when Bitcoin's price approaches or exceeds 2-year MA x 5 (the red line in the chart), it is the best time to sell Bitcoin. As shown in the figure below.
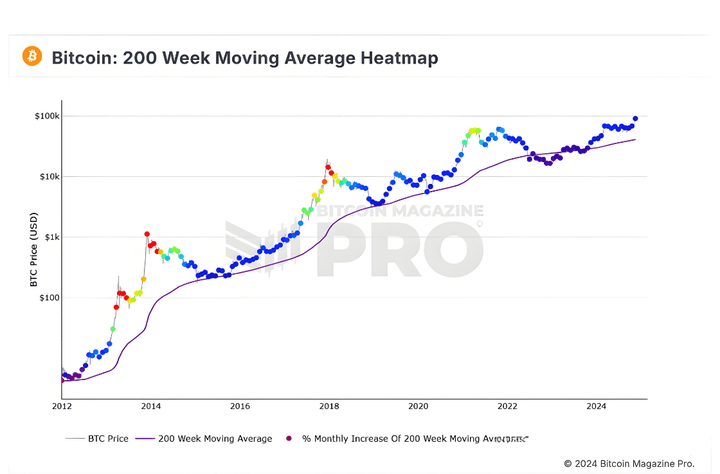
The 10th indicator: 200 Week Moving Average Heatmap
This indicator uses a color heat map based on the 200-week moving average growth rate, assigning a color to the price chart based on the percentage of monthly growth of the 200-week moving average. Historically, when we see orange or red dots on the price chart, it indicates that the market is overheated and it is the best time to sell Bitcoin for profit. As shown in the figure below.
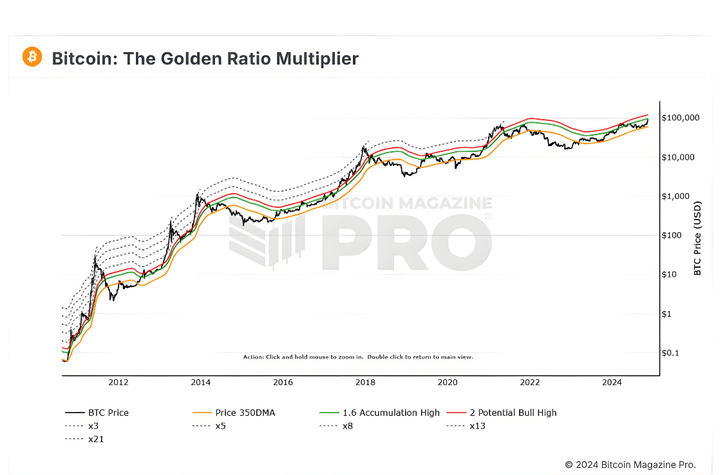
The 11th indicator: The Golden Ratio Multiplier
This indicator uses the multiple of Bitcoin's price 350-day moving average (350DMA) to identify potential resistance areas for price fluctuations. Based on the current indicators, the area above the green line and reaching the red line is a relatively good range for batch selling. As shown in the figure below.
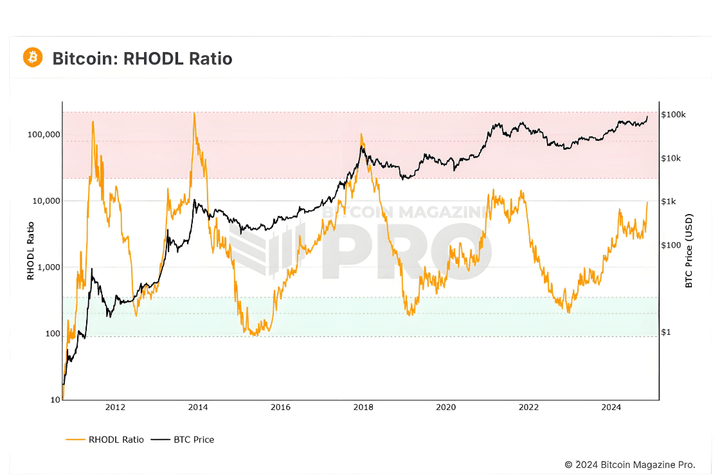
The 12th indicator: RHODL Ratio
This indicator uses the ratio of realized value HODL waves. When the orange line approaches or reaches the red band area, it indicates that the market is overheated and it is suitable to take profits in batches. As shown in the figure below.
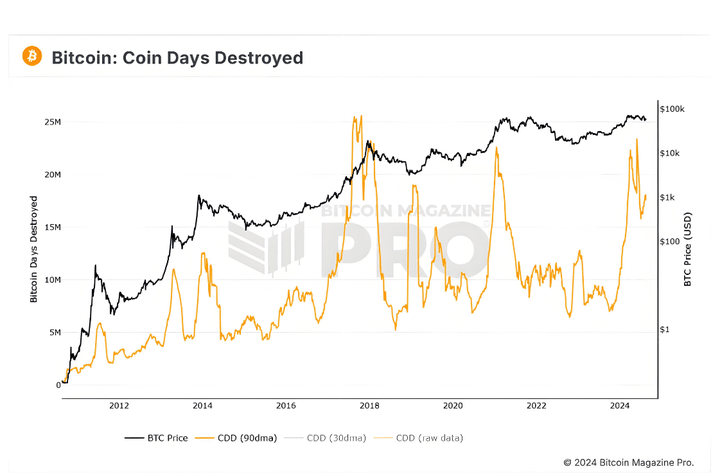
The 13th indicator: Coin Days Destroyed
This indicator shows when old, dormant Bitcoins suddenly awaken and are sent back to the market. When long-term holders begin to transfer their holdings, it often indicates that they are about to sell for profit. Therefore, we see a significant surge in CDD before market peaks. As shown in the figure below.
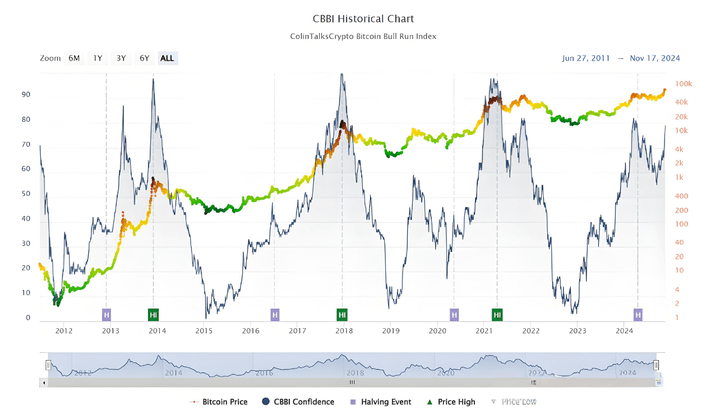
The 14th indicator: Bitcoin Bull Run Index (CBBI)
This indicator is a comprehensive data metric that integrates the use of nine other indicators to help us understand the stage of the Bitcoin cycle. A higher score indicates a potential peak of the Bitcoin explosive cycle. Based on the current display data of this indicator, when the value exceeds 80, one can start to consider batch selling Bitcoin. As shown in the figure below.
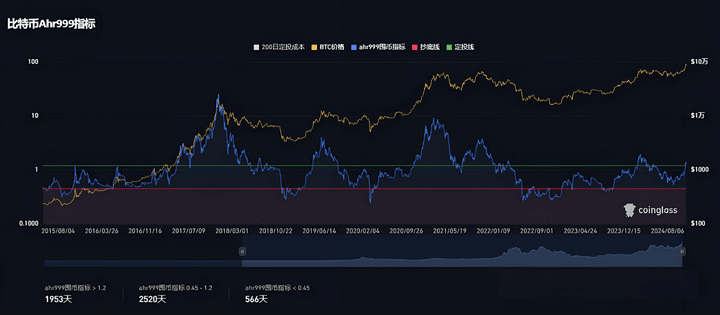
The 15th indicator: Ahr999
This indicator was proposed by a Chinese netizen named Ahr999 in the e-book (Hoarding Bitcoin). Currently, this hoarding expert has exited the market, and all accounts with the same name online are not Ahr999 himself. The calculation formula of this indicator is = (Bitcoin price / 200-day regular investment cost) * (Bitcoin price / index growth valuation), where the index growth valuation is the fitting result of coin price and coin age.
This indicator is also known as the Bitcoin Hoarding Indicator, and it is relatively simple to use. When the index is below the green line (value of 1.2), it indicates entering a regular investment range. When the index is below the red line (value of 0.45), it indicates entering a bottom-fishing range. Similarly, when the index exceeds the green line, it indicates a potential selling range. Currently, this indicator seems less suitable for guiding peak escape operations and is more suitable for long-term regular investment references. As shown in the figure below.
In addition to the above indicators, if you enjoy studying candlestick charts, you can also combine weekly or monthly MACD, RSI, and other indicators for auxiliary reference. Additionally, all these cyclical indicators can not only assist in guiding selling (escaping the peak) operations during bull markets but also be applicable during bear markets to seize accumulation opportunities for hoarding coins.
In summary, there are still many indicators for Bitcoin at present. Although we have shared 15 indicators, the key point here is not to use all the indicators but to select the few that you believe are the most effective for long-term auxiliary reference.
No indicator is perfect, and when an indicator is focused on by everyone, it may no longer be a perfect indicator. What you need is to find new integration points among different indicators. Additionally, we need to keep ourselves updated, such as considering changes in policies regarding the cryptocurrency industry in various countries and global macroeconomic conditions for comprehensive considerations and judgments.
At the same time, during this relatively long trading process, we need to maintain enough patience and continuously improve our trading strategies and trading discipline.
Of course, one final reminder is that all data indicators are also based on historical data extrapolation or model calculations, which can only serve as auxiliary references. Your trading decisions should also be based on your own risk preference and position management, and all the indicators listed above are cyclical indicators, which are not very significant for short-term operations.
In this process, finally! I have distilled 10 golden rules, concise yet full of wisdom.
If you intend to cultivate in the cryptocurrency circle for the long term, this article will certainly benefit you greatly, and you may feel enlightened after reading it!
1. The way to trade cryptocurrencies lies in selecting strong coins and closely following the upward trend. For coins in a downward trend, we choose to ignore them, as time is precious and it is not advisable to engage with the main forces. If a coin stays above the trend line, holding it patiently is the best strategy. For example, during the AI boom at the beginning of the year, as long as it does not break the 30-day moving average, you can hold it with peace of mind. Once it breaks, exit decisively.
2. The main trend is paramount; when the market is favorable, there must be a leading main trend. If the main trend is weak or missing, it signifies that risks outweigh opportunities. In such cases, it is advisable to observe the changes quietly and wait for the main trend to emerge, and do not act impulsively.
3. Diversify your investments, including in cryptocurrency trading. Even if you are optimistic about a certain coin, do not invest your entire capital; learn to diversify your holdings, and the number of types of coins held should not exceed four to spread risk.
4. Frequent trading is not only unhelpful but also financially damaging. In cryptocurrency trading, avoid being overly anxious; feeling uneasy if you don't trade for a day. Frequent trading may bring temporary pleasure but will ultimately lead to significant losses, benefiting only the brokers. If you do not possess the skill for short-term trading, do not attempt to become a market maker.
5. After a significant loss, it is essential to recuperate; after a big gain, it is even more important to be cautious. After a significant loss, one's mindset is easily affected, and one must understand the psychology of revenge trading, avoiding blindly trying to recover losses, which is a gambler's mentality and should be avoided. After a big gain, emotions run high, making it easy to lose caution, and thus, a big gain is often followed by a significant loss, so one must remain vigilant.
6. Diversify your positions, stability is key. Even if you are optimistic about a certain cryptocurrency, do not buy heavily all at once. Even if it proves correct later, you should not act that way. The future is unpredictable, and no one can foresee what will happen tomorrow.
7. Don't overly focus on minute charts. Retail investors should not stare at minute charts all day long; this is not only unhelpful but can also disrupt trading mindset. Trading cryptocurrencies should also involve a balance of work and rest; reviewing for an hour each day is sufficient.
8. Think deeply before the market opens, rather than making impulsive decisions during trading. In cryptocurrency trading, boldly hypothesize and cautiously verify. Through post-market reviews and pre-market planning, clarify market hotspots and make predictions about trading. But remember, prediction is not forecasting; blind forecasting replaces market choices with subjective opinions, which is a major taboo in trading.
9. Missing an opportunity is better than incurring a loss. In trading, opportunities will always come again. Rationally identify and neutralize issues, focusing on success benefits rather than stress.
10. Improving trading skills and keeping a trading log is key. Record all relevant information and experiences related to trading. Without logs, valuable experiences will be lost, and repeating mistakes is inevitable. Trading logs are, in fact, powerful tools for capital and risk management. Understanding trading issues is necessary to solve them. Therefore, setting a trading log as one of your goals is essential.
The above are some of my views and insights. If you find them helpful, feel free to like and save them. I am Yan An, someone who has experienced three rounds of bull and bear markets, skilled in logical coin selection and technical timing. I only trade within my cognitive range, and each direction has been validated by the market!
Even the most diligent fisherman would not go out to sea to fish during a storm but will carefully guard their boat. This season will pass, and a sunny day will surely come! Follow Yan An, who teaches you both fishing and how to fish. The door to the cryptocurrency world is always open, and only by following the trend can one lead a life in sync with the trend. Save this and keep it in mind!