Ethereum has entered consolidation after rebounding above $3700, with bulls still controlling the market. Previously breaking the resistance level of $2800-$2880, the chart structure turned bullish, maintaining momentum above $3273. The current focus is on the key resistance level of $3965; a breakout could challenge historical highs; during pullbacks, the range of $3273-$3370 will provide strong support. As long as this area remains solid, the upward trend is technically valid.
XRP is retreating to seek support, with buyers hesitant or possibly dropping to $2.15.
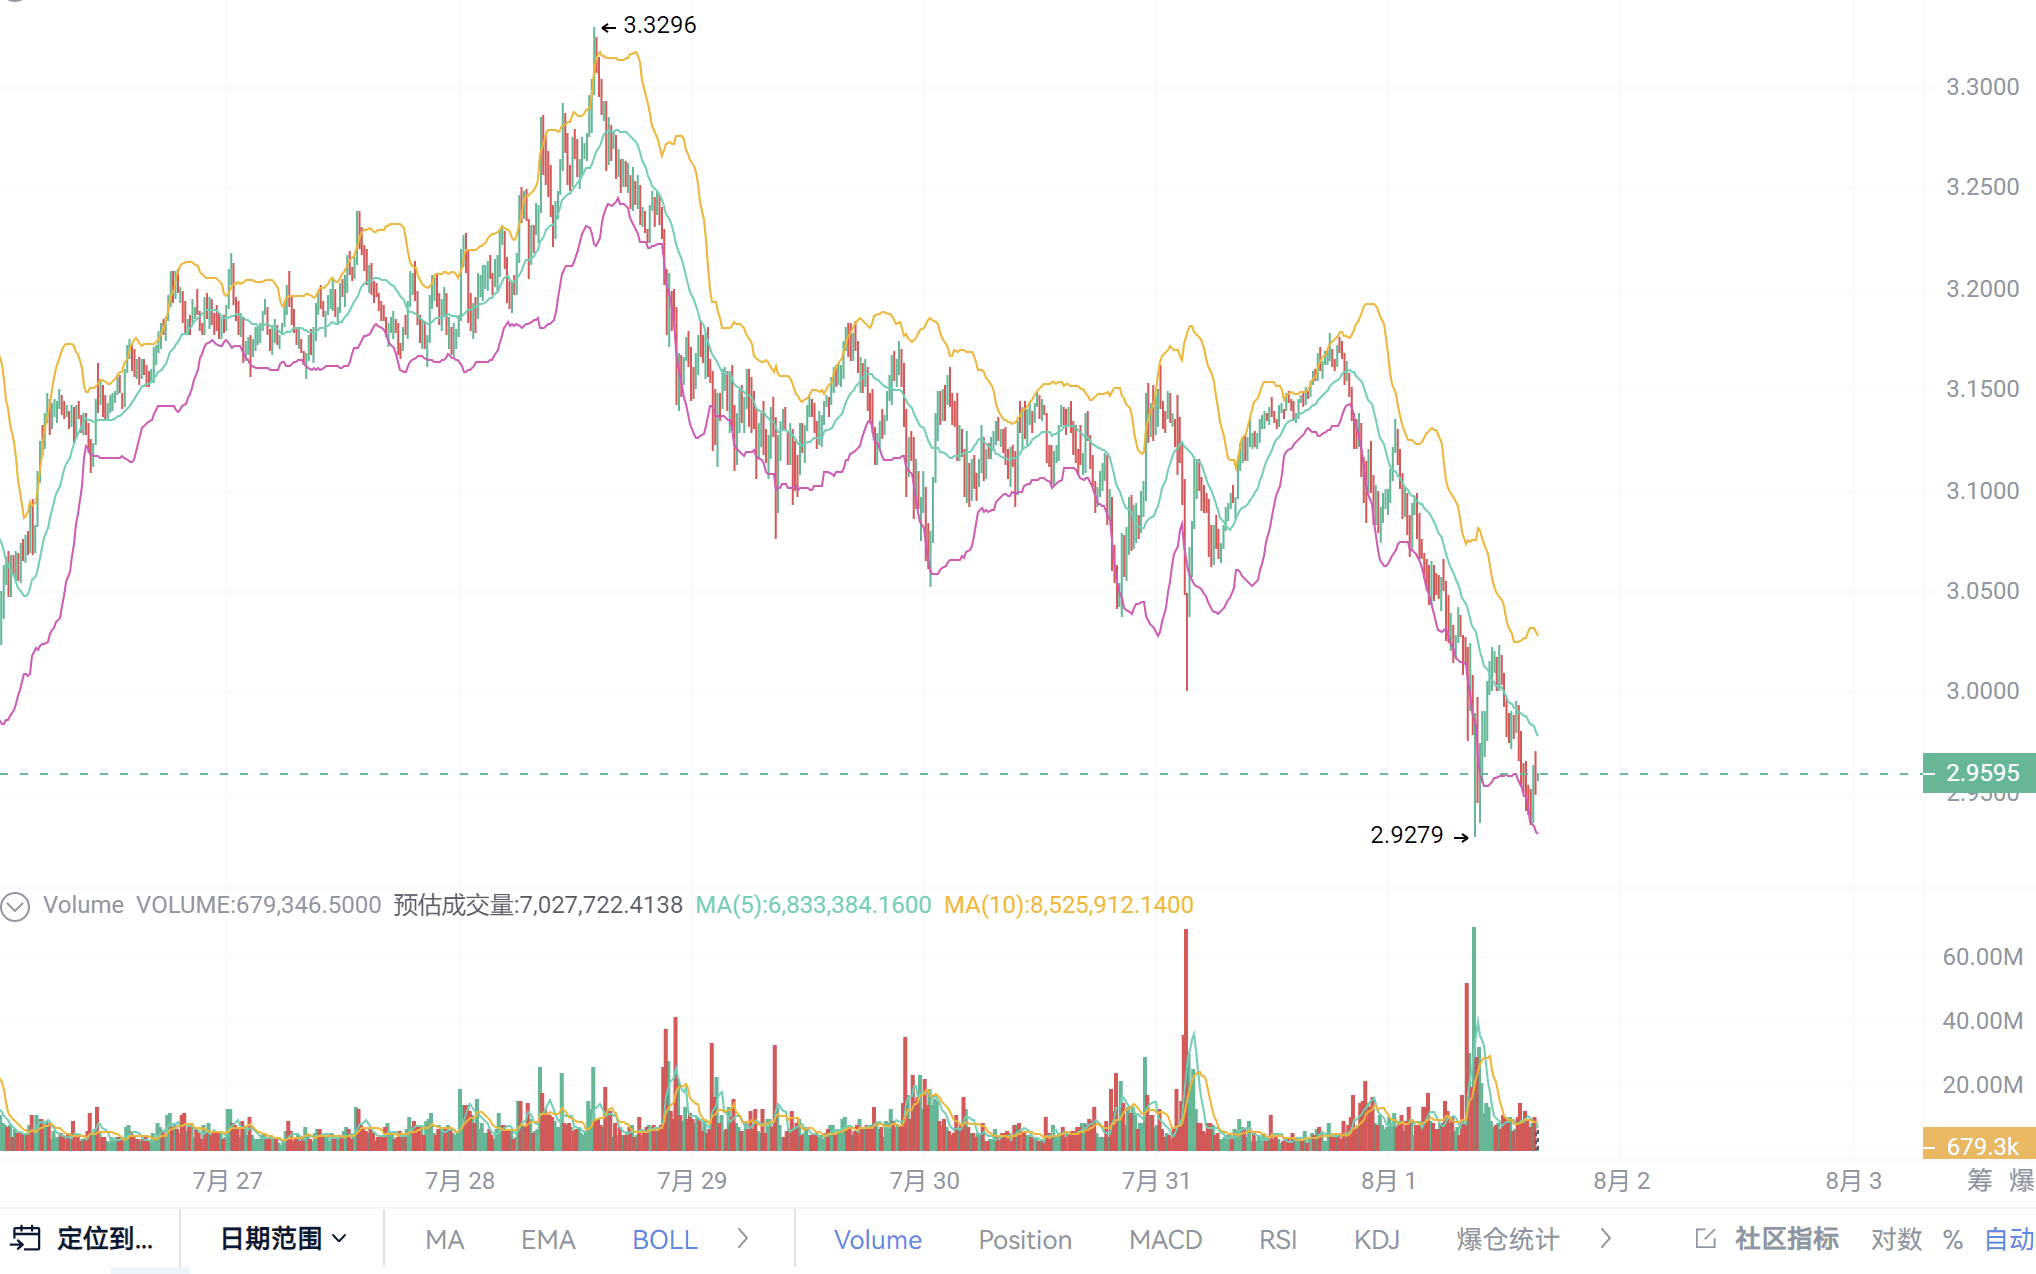
XRP fell back after reaching a 7-year high, influenced by overall bearish sentiment in the market. Analysts pointed out that its rise was driven by a large number of buy orders, but after breaking the 2024 high, it encountered resistance, trapping long positions at high prices. More notably, when the price reached new highs, trading volume significantly decreased (trading volume was $78 billion when breaking $3 in 2024, while this time it was only $41 billion when breaking $3.6), indicating weakened buying interest.
If buyers fail to exert force, XRP may retreat further from $2.95, with the next bearish target being $2.15-$2.3 (seen as a 'suitable entry point'), with deeper potential down to $1.60-$1.93; if supported by buying, it may still rebound to $4.64.
KAS and SUI show rebound signals, with positive technical formations.
Kaspa has risen 25.57% this month, recovering from a 27.19% decline over the past six months, but has fallen 9.24% in the past week, showing significant volatility. The current trading range is $0.0595-$0.0916, with support at $0.0438 and resistance at $0.1078.
RSI at 51.28 is neutral, with the momentum indicator slightly bearish. Short-term sentiment is improving, but long-term challenges remain.
SUI has recently risen 38.55%, up 3.54% weekly, but down 5.71% over six months, showing short-term reversal signals. Prices are fluctuating between $2.19-$3.48, testing resistance at $4.19 and support at $1.59.
The oscillation indicator is slightly bullish, with an RSI of 54.22 showing a balance between bulls and bears, lacking a clear trend but presenting tactical opportunities.
LTC and LINK show bullish structures, possibly entering a coin accumulation phase.
Chainlink has risen 35% in recent months, down 28% over six months, with the current range being $11-$15.70, resistance at $18.03, and support at $8.63.
The oscillation indicator is slightly bullish, but the momentum indicator is negative. Bulls temporarily control the market, but bearish pressure remains, necessitating attention to breakout opportunities.
Litecoin has risen 29% in recent months, down 13% over six months, with a trading range of $76.80-$94.61, resistance at $103.27, and support at $67.65.
RSI near 60 displays buying pressure, but the momentum indicator is negative and weekly down 1.16%, indicating market caution.
Both show bullish structures, with analysts suggesting they may be nearing a key accumulation phase, potentially indicating significant increases ahead.
