Overview:
After going through a volatile multi-year cycle, QTUM is now back at one of the most critical historical support zones. This demand area has acted as a strong reversal point multiple times since 2020 and is once again being tested as price consolidates near the bottom of its macro range.
---
📉 Price Structure & Key Levels:
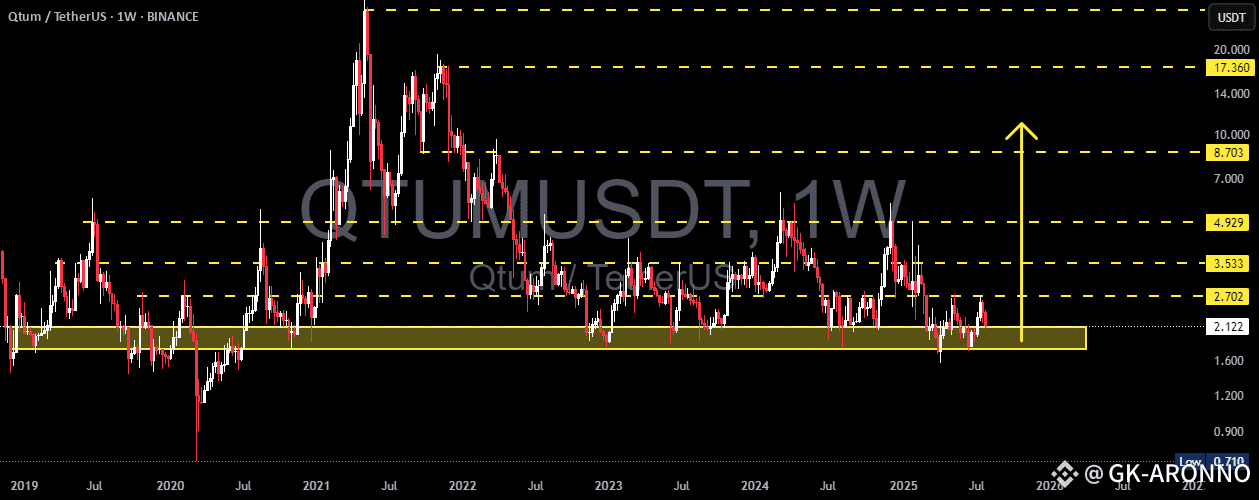
📍 Major Support Zone (1.70 – 2.10 USDT):
A proven accumulation zone based on multiple long wicks and price rejections in the past.
This is where smart money tends to accumulate during market uncertainty.
📍 Layered Resistance Levels (Bullish Targets):
2.70 USDT → Initial breakout validation
3.53 USDT → Mid-range resistance
4.93 USDT → Key structural level
8.70 USDT → Mid-term breakout target
17.36 USDT → Peak from previous macro cycle
---
🧩 Current Pattern: "Sideways Accumulation Range"
QTUM is clearly in a range-bound accumulation phase, with tight price action within a key support area. Historically, such patterns often precede large impulsive moves, especially when accompanied by volume surges and breakouts from structure.
> ⚠️ Important Note: Sideways movement at historical support, combined with increasing accumulation volume, often leads to a breakout into the markup phase.
---
📈 Bullish Scenario: Potential Upside Momentum
Trigger: A confirmed breakout and weekly candle close above 2.70 USDT.
Additional Confirmation: Strong bullish candle with increased volume.
Targets:
3.53 USDT (local resistance)
4.93 USDT (mid-range structural level)
8.70 USDT (swing target)
17.36 USDT (macro cycle high)
🎯 High reward-to-risk potential if entries are made near support with a stop-loss under 1.70 USDT.
---
📉 Bearish Scenario: Breakdown Risk
Trigger: Weekly candle closes below 1.70 USDT.
Implication: Breakdown from long-term demand zone.
Downside Targets:
1.20 USDT → Minor horizontal support
0.71 USDT → Historical all-time low
Warning Sign: High volume breakdown = likely sign of institutional selloff or panic exit.
---
📊 Strategic Summary:
> QTUM is at a pivotal crossroads.
The 1.70 – 2.10 USDT range is a decisive area.
A bullish breakout could spark a major recovery rally,
while a breakdown may lead to a deeper capitulation.
This is a “calm before the storm” situation. Traders should monitor closely as the next few weekly candles could define the trend for the rest of 2025.