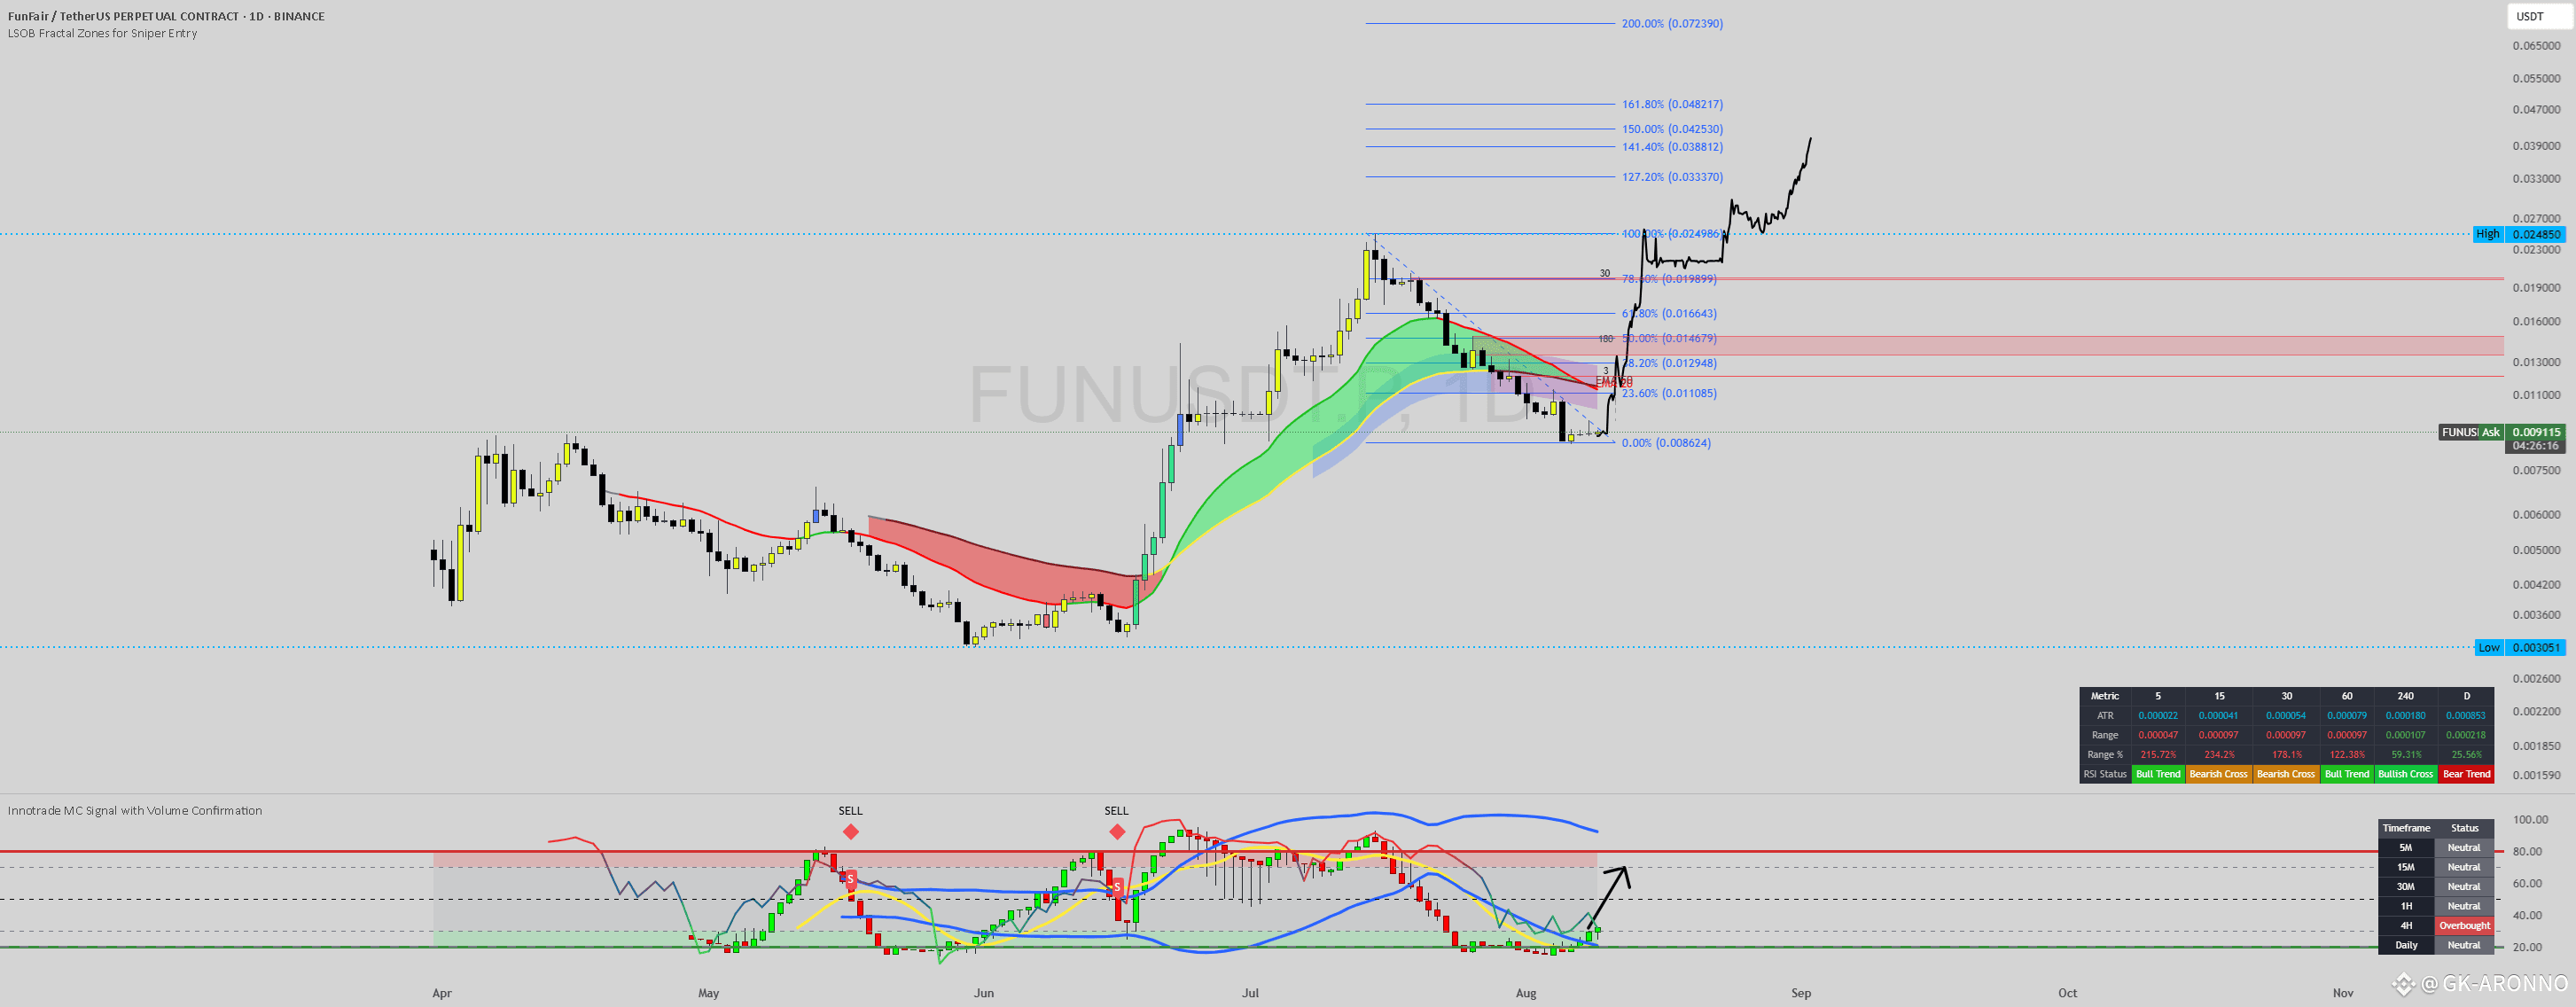
This daily chart for FUNUSDT (FunFair/TetherUS) suggests that a significant correction has found a floor, and the asset is now positioned for a strong bullish reversal with substantial upside potential.
Market Structure Shift: The chart illustrates a classic reversal pattern. After a steep decline from the peak at approximately $0.02485, the price has entered a consolidation phase at a critical support level. The projected path, indicated by the hand-drawn pink line, represents an anticipated "Change of Character" (Choch) from bearish to bullish as the price is expected to start forming higher highs and higher lows. Other traders have also noted that FUNUSDT is showing signs of a potential bullish reversal.
Support and Bottoming Formation: The price is finding strong support at the $0.008624 level, which corresponds to the 0.00% Fibonacci retracement level of the prior major uptrend. This level is acting as the definitive bottom in this analysis. The price action consolidating above this low suggests an accumulation phase is underway.
Indicator Confluence:
* The primary chart indicator, the LSQB Fractal Zones for Sniper Entry, shows the price holding within the green-colored band. In systems like this, fractal-based indicators identify potential reversal points.The green zone acts as a dynamic support area, signaling that the underlying trend is either bullish or attempting a bullish reversal.
* The lower indicator, Innotrade MC Signal with Volume Confirmation, is showing its signal line moving up from the lower boundary (green zone), which typically represents oversold conditions.[4] A black arrow points upwards, suggesting an impending or recently triggered buy signal and a buildup of bullish momentum. This custom indicator is designed to identify high-probability reversals by blending momentum oscillators and confirming them with volume and volatility analysis.
Price Projection and Targets: The drawn pink line illustrates the expected trajectory for the price, anticipating a powerful rally from the current support. The key objectives are based on Fibonacci extension levels, which are used to project potential targets in a new trend:
Strategy:
Position: Long (Buy)
Entry: The analysis identifies the current price area around the $0.008624 - $0.009129 zone as a "sniper entry" or strategic buying opportunity.
Targets: The primary targets for this bullish move are
0.024986
0.024986
0.033370, and potentially higher towards $0.048217.
Conclusion:
With the price stabilizing at a key Fibonacci support level, a bottoming formation in place, and bullish signals from the custom indicators, FUNUSDT presents a compelling bullish reversal setup. The current price level is highlighted as an ideal entry point to capitalize on a potential new uptrend with significant room for growth.
Disclaimer: This analysis is based on the provided trading chart and is for educational purposes only. It should not be considered financial advice. Always conduct your own research and manage risk appropriately. Crypto markets are known for their volatility.