
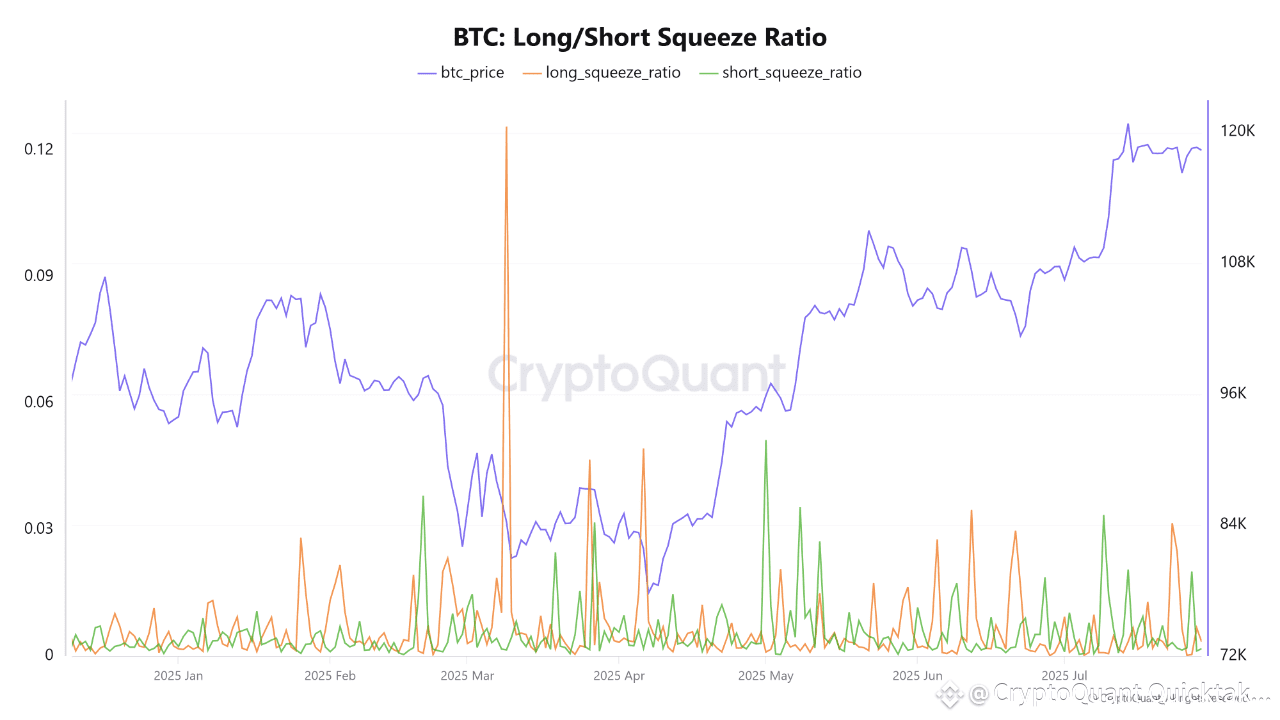
The Long/Short Squeeze Ratio reflects one of the most influential phenomena in the futures market: forced liquidations. This indicator highlights the pressure leveraged traders, both long and short, experience when prices suddenly move against their open positions.
During the period from April to late July 2025, the chart shows a significant increase in the Short Squeeze ratio on several occasions, particularly in mid-July. This suggests that a large number of short positions were forced to be liquidated after a price surge, prompting traders to buy back Bitcoin to cover their losses, which contributed to the acceleration of the price rise.
Conversely, some peaks in the Long Squeeze Ratio occur during periods of price decline, indicating the liquidation of long positions, which exacerbates the decline. This recurring pattern reflects a clear dynamic: the market tends to accelerate movement in the direction where the largest number of leveraged positions are hit.
High short squeeze ratios often precede a sharp price rise, while long squeeze ratios indicate the possibility of sharp corrections. Understanding these mechanisms gives traders a tactical advantage in a highly volatile market.
Highs in the short squeeze ratio indicate pressure on sellers (short) leading to a rapid price rise due to liquidation. This is a bullish signal if accompanied by a price rise.
Highs in the long squeeze ratio indicate pressure on buyers (longs) following a sharp price decline. This is a negative signal if liquidation continues for a period.
Written by Arab Chain

