Ethereum (ETH) nears 4,000 USDT with a peak at 3,941 USDT before starting a slight decline. At the time of this writing, it is at 3,760 USDT and the retracement from the peak in the last 24 hours is 3.65%. The month of July is on track to close with ETH up +52.20%.
Ethereum nears 4,000 USDT
The ongoing rally of Ethereum started from the annual low recorded in April, at 1,385 dollars. In 110 days, the price has recorded an increase of +172%. This momentum positions Ethereum as the best token in the Top 20 for growth in the rebound of the last three months from the April low.
Altseason and Ethereum
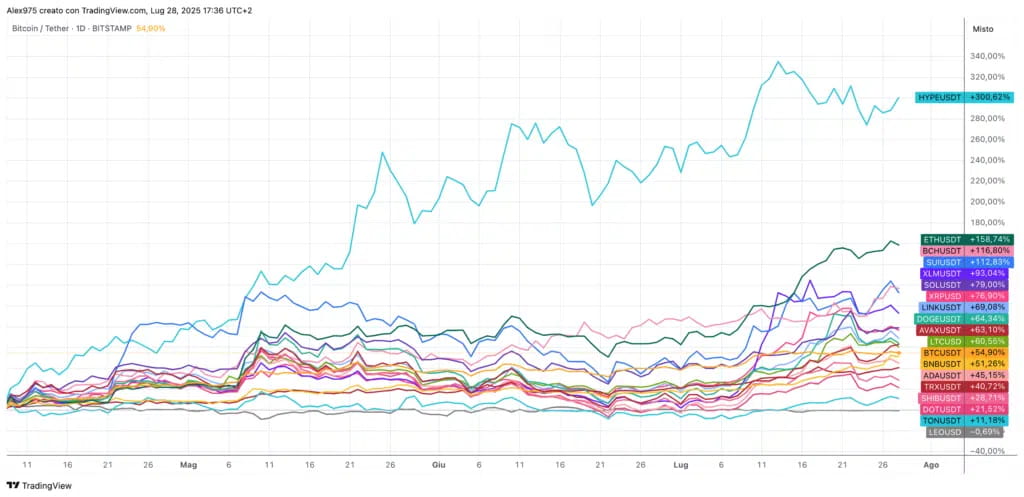
In the attached graphic overview, it is clearly highlighted how Ethereum ranks among the best performers. In first place is Hyperliquid with +268%, followed by Ethereum and a series of other mid-high cap altcoins.
In recent weeks, attention has intensified on what could configure as a new Altseason, with a significant expansion of the altcoin sector.
Market cap comparison: Ethereum, Bitcoin, and Altcoins
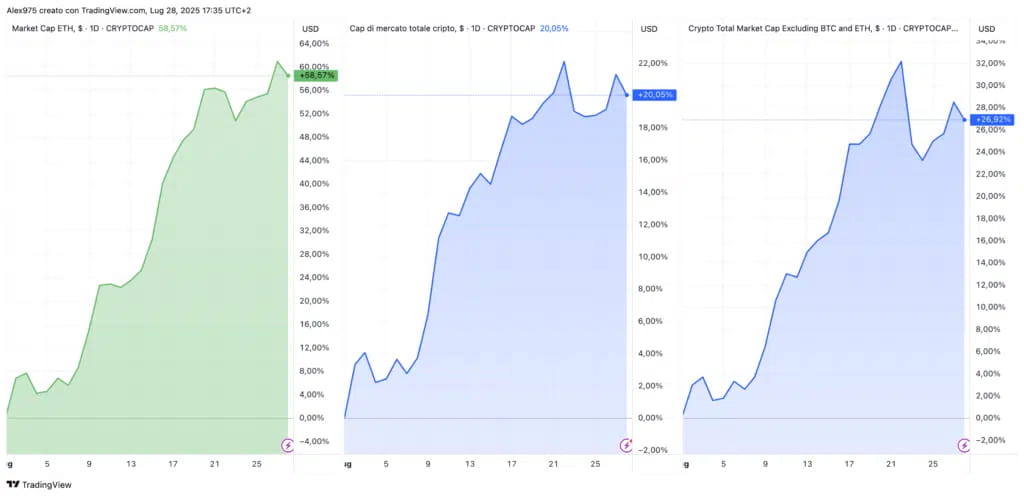
Attached is the trend of Ethereum's market cap since the beginning of July, compared to that of Bitcoin and TOTAL3 — which is the market capitalization of the crypto market excluding BTC and ETH.
In this scenario, where the overall market cap of the crypto market reached a new all-time high of 4 trillion USDT (as detailed in this article by director Alessio Ippolito), the main contribution to the increase came precisely from Ethereum, with a +57.60% since the beginning of July, well beyond Bitcoin's +19.77%. TOTAL3 also recorded a solid +26.65%, indicating growing involvement in the altcoin sector.
These data suggest a gradual capital shift from Bitcoin to Ethereum and subsequently to the rest of the altcoins, a typical scenario in the early stages of a potential altseason.
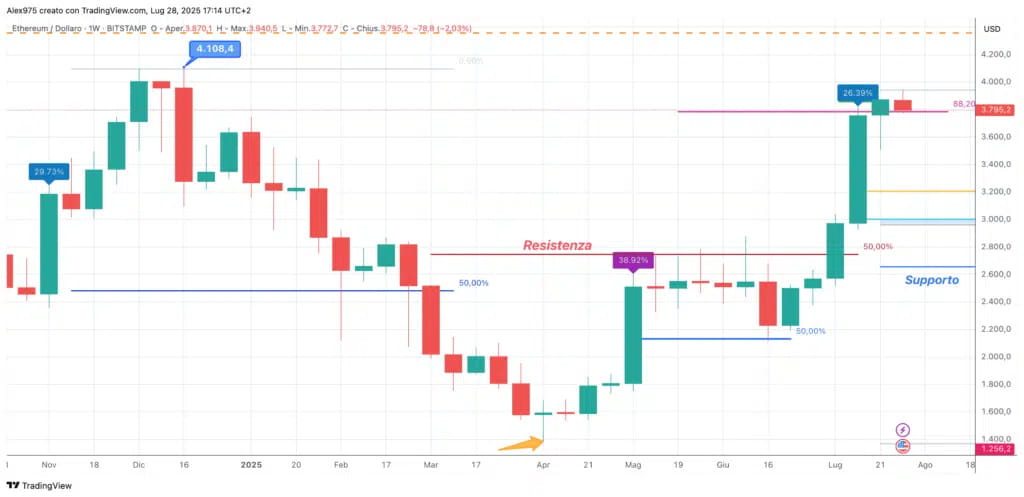
The weekly chart of Ethereum is now familiar to many traders, who know its weekly candles by heart. Here we have an overview from the peak in December 2024 at $4,108, followed by a sharp descending phase culminating in the minimum of April 2025 at $1,385 USD. From that level, the ongoing rally began.
In the following three months, Ethereum went through a rather challenging consolidation phase, stuck below the key resistance of 2,720 USD. A dividing level until three weeks ago, when the decisive breakout occurred. From there, a new leg up started, culminating yesterday with a peak of 3,940 USD.
ETH Objectives
The current technical scenario now points towards testing the peak of December at 4,108 USD. A potential breakout above this level would pave the way for a possible continuation of the bullish trend, with the next target set on the all-time high of November 2021.
Daily traffic analysis on Ethereum
In the daily chart, a negative close was noted yesterday, accompanied by a possible short-term warning signal. This is highlighted by the RSI, which remained below the highs marked approximately ten days ago, indicating a divergence.
This behavior of the RSI represents a warning of possible loss of momentum and could herald a correction phase. However, it will be necessary to wait for potential confirmations from the price before considering bearish signals.
In this context, the first short-term support level is at 3,550 USDT, while the most relevant support is at around 3,420 USDT.


