Stellar corrects after the July exploit. The weekly doji signals a reversal. PayPal fueled the rally. Attention to the supports at 0.3980 and 0.360 USDT
The corrective context of the last 48 hours in the crypto market directly involves Stellar (XLM). After the strong rise recorded in the first three weeks of July, a price downturn has begun.
Stellar corrects after the July rally
On a weekly basis, $XLM is correcting by -9.20%, after having already closed last week with a decline of 1.70% after it had reached the annual high at 0.5265 $. At the time of writing, Stellar is priced at 0.4190 $ and on a daily basis records a 1.24%. The performance since the beginning of 2025 remains positive, with a performance of +29.35%.
Stellar's boom in July is signed by PayPal
Stellar's rise in July is mainly attributed to the first week of the month, during which the token recorded an impressive +87.74%. The movement was triggered by significant news about the ongoing collaboration with PayPal, which sparked investor interest.
This surge pushed Stellar's market capitalization to 13.36 billion dollars, allowing it to reach position number 12 in the global cryptocurrency ranking.
Technical overview on a weekly basis
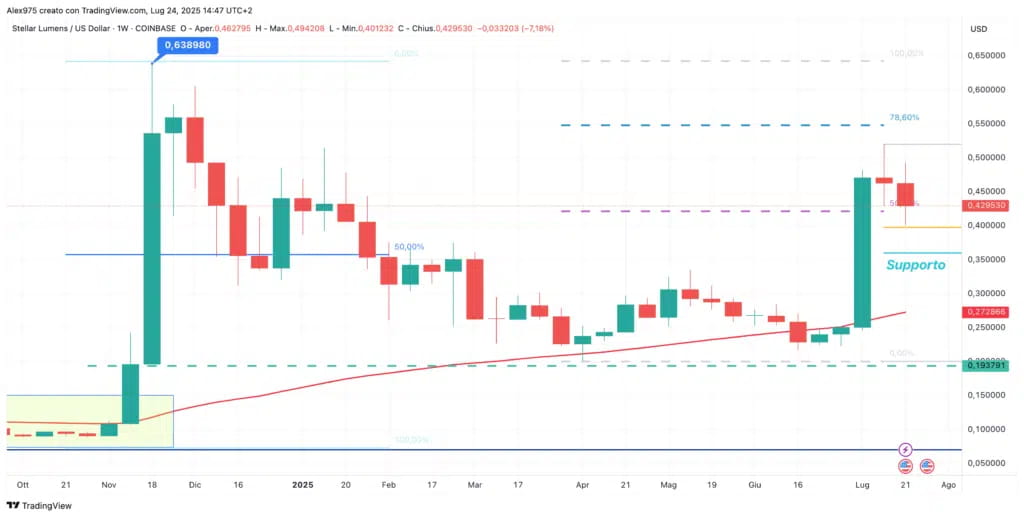
Observing the weekly chart of the last ten months, it can be seen that in November 2024, Stellar broke out of a congestion that had lasted since July 2022. This movement generated a bullish acceleration that led the month to close with a +173%, with a peak of 0.6389 USDT, a level that XLM had not reached since May 2021.
Collapse in 2025 until April
In 2025, the market initiated a corrective phase that pushed the price to the support in the area of 0.3550 USDT, whose bearish breakout occurred at the end of January. The decline continued until it reached an annual low of 0.2000 USDT in April.
From that point, a rebound phase began, structured in a series of swings, which saw the price of XLM stop at the high of May at 0.3344 USDT, followed by a new drop that brought the price to the low of June at 0.2167 USDT.
Breakout of resistance and reversal for Stellar
In the current graphical view, it can be observed how the rebound that started in June led to the breakout of the main vector resistance, drawn from the high of November 2024 to the low of April 2025, in the area of 0.42 USDT.
Last week, XLM reached a high of 0.5206 USDT, approaching the target resistance at 0.5480 USDT, but was unable to reach it. The weekly candle that formed was a doji with two long shadows, formed beyond the upper Bollinger band.
From a technical point of view, this is a reversal setup, and the current week seems to confirm the beginning of a corrective phase.
Reversal doji
In the current context, the vector to observe is the one that starts from the low of April to the high of last week. On this movement, two key support levels can be identified:
the first in the area of 0.3980 USDT
the second, deeper, in the area of 0.3600 USDT
Analysis on the daily chart of Stellar
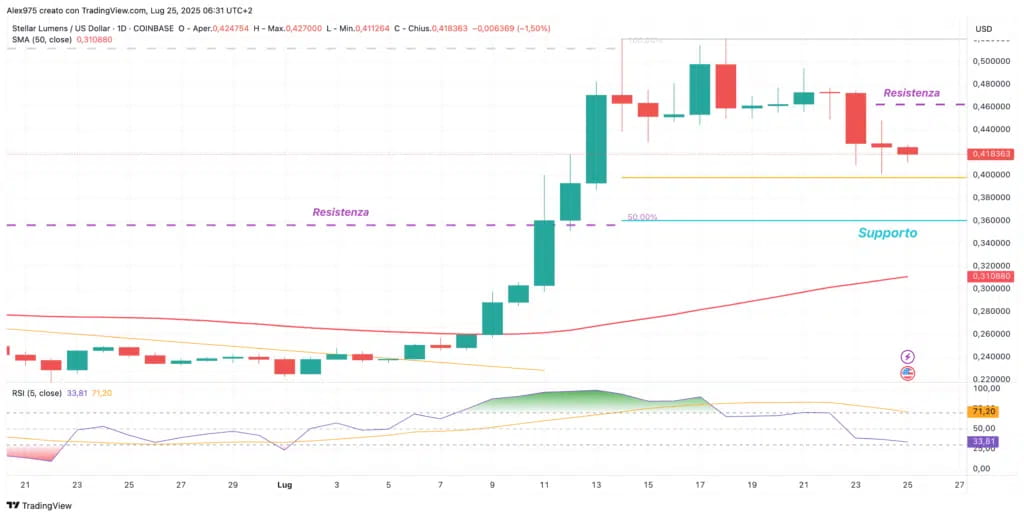
On the daily chart, it can be seen that yesterday the price of Stellar approached the first support level. Observing the RSI, it had already signaled a weakening of the momentum a week ago, with the exit from the overbought area.
In this context, the support in the area of 0.36 USDT is crucial: a break of this level could open the way for a deeper correction, possibly towards the SMA50. For a restart, it will be necessary for Stellar to close above the area of 0.46 USDT.

