Pure wave theory has some flaws that are hard to accept:
(1) Bear market adjustments in wave theory often have multiple scenarios and hypotheses, which always need to be repeatedly verified after the fact, leading to a lag that makes people hesitant to act decisively.
(2) There can be significant declines in a bull market, and significant rises in a bear market. Waves X and XX in a bear market can even reach historical new highs, leaving many people confused, often asking whether it's a bull or a bear?
Today I seriously reflect on past shortcomings: merely judging bulls and bears through wave theory has always been unsatisfactory in terms of perception and effect!
However, using the [Fear and Greed Index] to determine peaks and bottoms, bulls and bears, is more easily accepted in terms of perception and effect!

In the coming days, I will analyze the [Fear and Greed Index] in my weekly articles, and we will utilize the [Fear and Greed Index] to make friends and flee more.
1. The cycle of bulls and bears of the Fear and Greed Index
(1) What is a bull?
The process of the Fear and Greed Index rising from the lower Bollinger band (bottom, below 20-25) to the upper Bollinger band (peak, above 85-95) becomes a bull market!
(2) What is a bear?
The process of the Fear and Greed Index dropping from the upper Bollinger band (peak, above 85-95) to the lower Bollinger band (bottom, below 20-25) becomes a bear market!
(3) Weekly, monthly, and daily Bollinger bands
The [monthly Bollinger bands] of the Fear and Greed Index are used to determine the overall direction of bulls and bears.
To determine the bottom of a bear market and the approximate peak of a bull market, the [weekly Bollinger bands] of the Fear and Greed Index are needed.
To accurately determine the bottom of a bear market and the precise peak and timing of a bull market, the [daily Bollinger bands] of the Fear and Greed Index are needed.
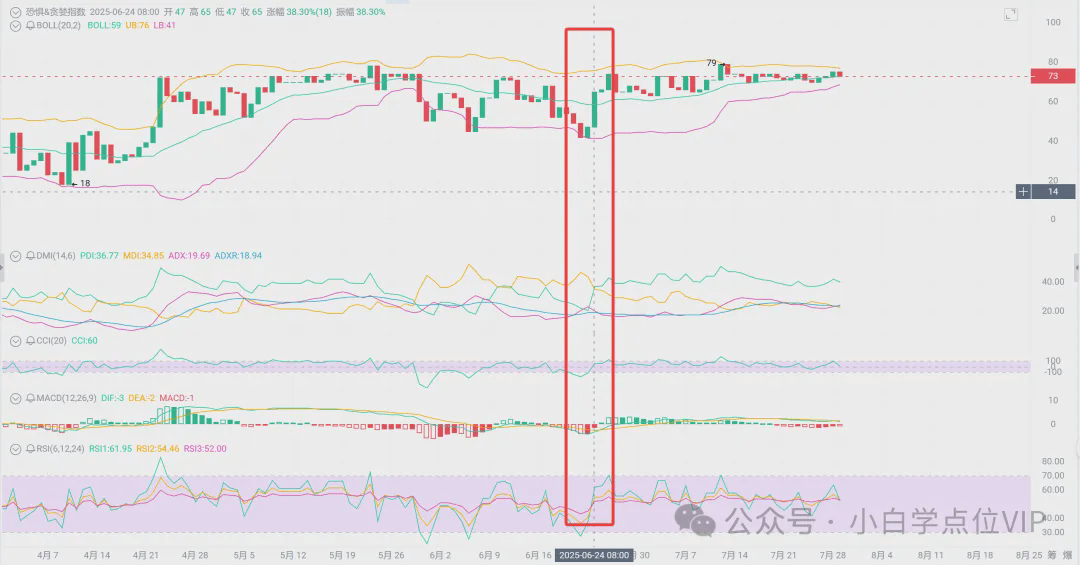
2. How to use the Fear and Greed Index to determine the final bottom of a bear market?
The final bottom of a bear market is the bottom of the bull-bear reversal.
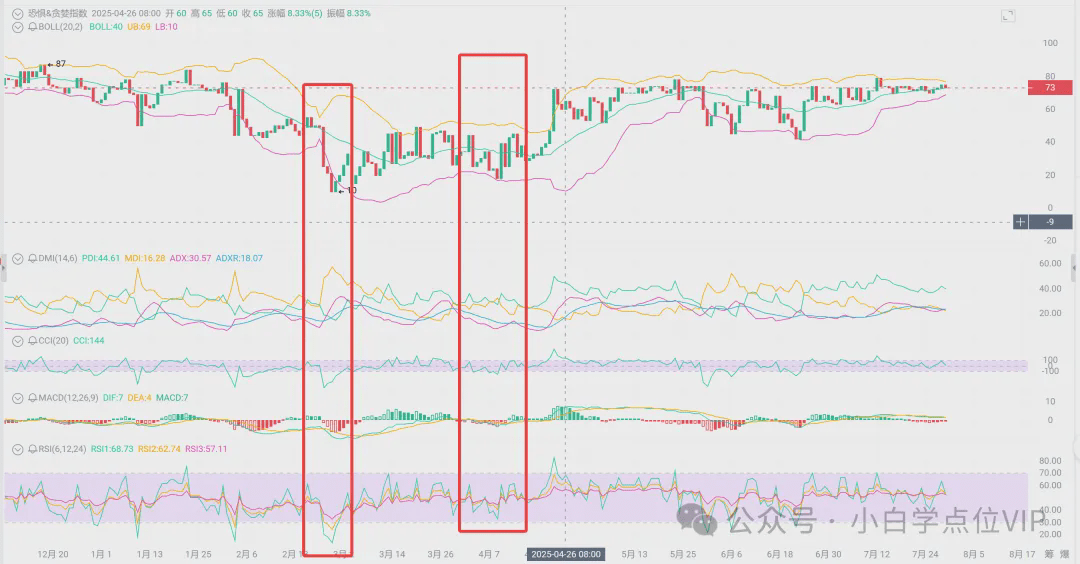
(1) The Fear and Greed Index drops to near the lower Bollinger band on a daily level, with values below 25. Values below 10-20 have greater certainty.
(2) The daily RSI is around 30 or below, and if the RSI shows a bottom divergence, the certainty is greater.
(3) The daily CCI is below -100, and can reach -200 to -300, or if the daily CCI shows a bottom divergence, the certainty is greater.
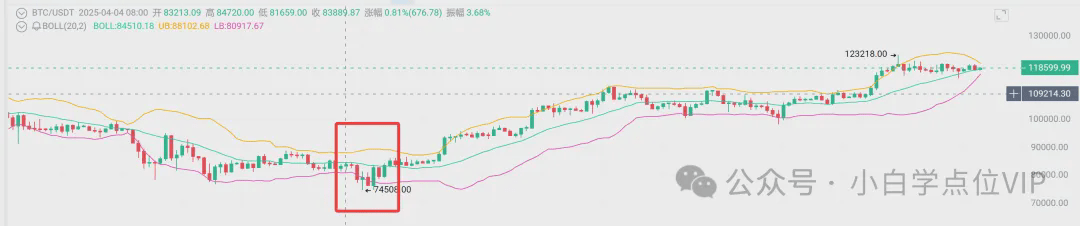
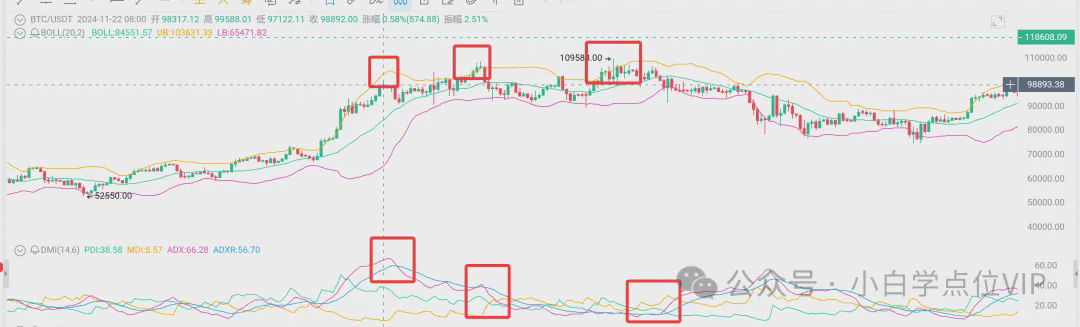
(4) In the daily DMI index, if the PDI crosses above the MDI forming a golden cross, it preliminarily confirms the bottom; if the ADX crosses above the ADXR, it further confirms the bottom. In the chart below, at the end of February, the bear market was not at its lowest point because the PDI did not cross above the MDI, and the lowest point in the bear market appeared in April.
(5) When the height of the MACD red bar on the daily chart shrinks, and the 4-hour MACD begins to form a golden cross, it preliminarily confirms the bottom. The daily MACD golden cross further confirms the bottom.
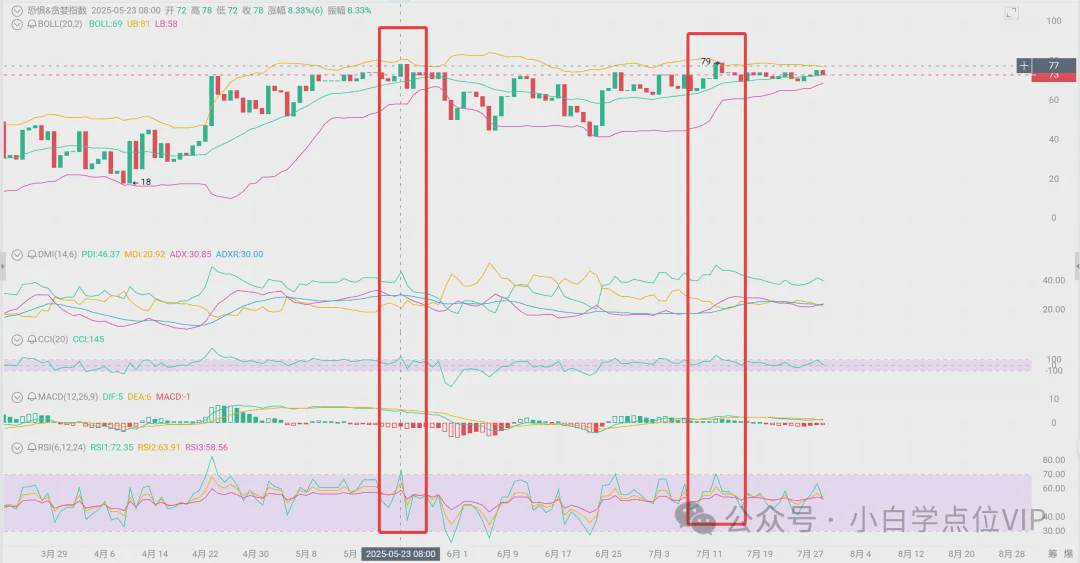
3. How to use the Fear and Greed Index to determine the peak of the rising continuation in a bull market?
The rise of a bull market is staged, and there will also be peak formations during the rising process.
(1) The Fear and Greed Index rises to near the upper Bollinger band on a daily level, with values at 75 or above (most will not exceed 85-90; exceeding that is the final peak).
(2) The daily RSI is around 70 or above, and if the RSI shows a top divergence, the certainty is greater.
(3) The daily CCI is above 100, and can reach 200 to 300, or if the daily CCI shows a top divergence, the certainty is greater.
(4) In the daily DMI index, if the PDI and ADX show significant spikes and declines, be cautious of the peak; if the ADX shows a significant cross below the ADXR, it preliminarily confirms the peak, and if the PDI crosses below the MDI forming a death cross, it further confirms the peak.
(5) When the daily MACD forms a death cross, the height of the red bar appears to expand, or when the daily MACD forms a golden cross, the green bar shrinks, and the 4-hour MACD begins to form a death cross, it preliminarily confirms the peak. The daily MACD death cross further confirms the peak.
Warning: Bitcoin $BTC , Ethereum $ETH #ETH重返3800 and altcoins do not reach the final peak of the bull market at the same time, so whenever the bull devil reaches a stage peak, fish, shrimp, and crabs must escape synchronously.
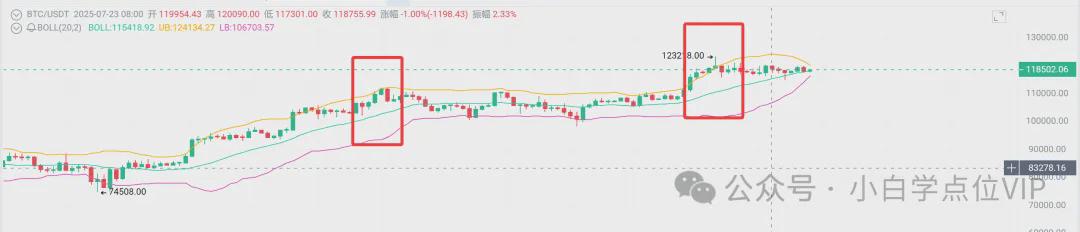
Altcoins always peak ahead of Bitcoin. For instance, some altcoins reached their ultimate peak of the mini bull market around May 12, and some altcoins reached their ultimate peak around July 22.
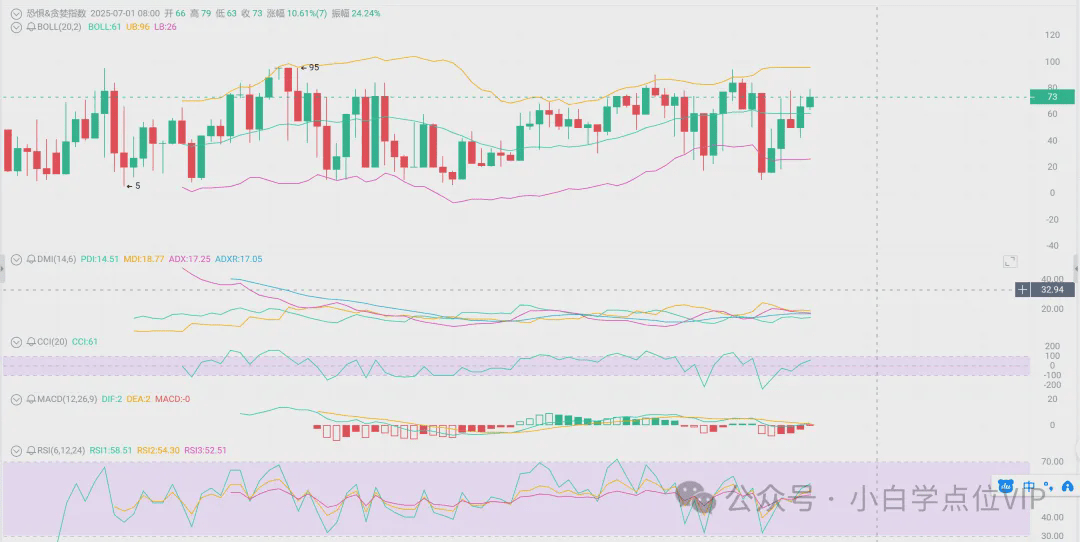
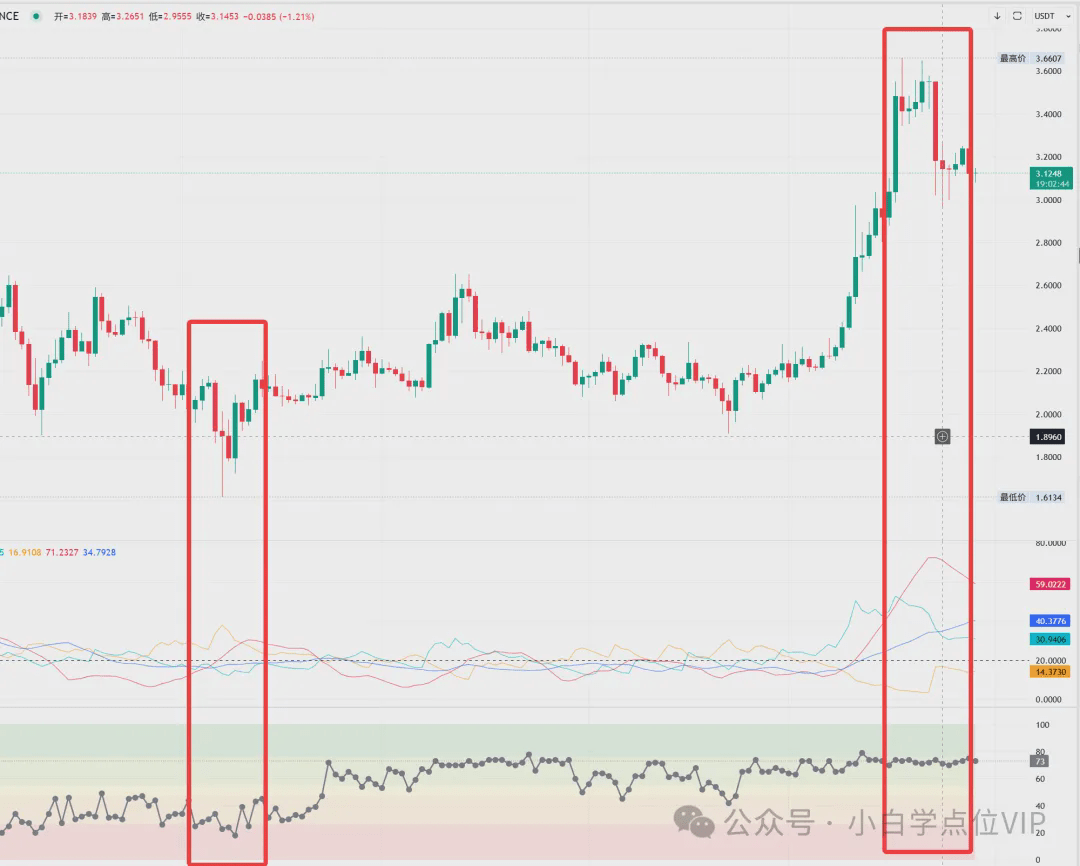
Of course, each altcoin has its own [Fear and Greed Index], and each fish, shrimp, and crab can execute their escape according to their respective [Fear and Greed Index], for example, XRP $XRP :
4. How to use the Fear and Greed Index to determine the bottom of the rising continuation in a bull market?
The rise of a bull market is staged, and there will also be bottom formations during the rising process.
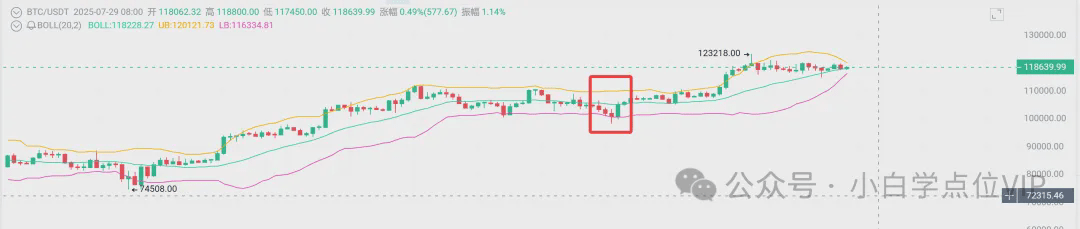
(1) The Fear and Greed Index drops near the lower Bollinger band on a daily level, with values below 46 (mostly above 26).
(2) The daily RSI is around 30 or below, and if the RSI shows a bottom divergence, the certainty is greater.
(3) The daily CCI is below -100, and can reach -200 to -300, or if the daily CCI shows a bottom divergence, the certainty is greater.
(4) In the daily DMI index, if the PDI crosses above the MDI forming a golden cross, it preliminarily confirms the bottom; if the ADX crosses above the ADXR, it further confirms the bottom.
(5) When the height of the MACD red bar on the daily chart shrinks, and the 4-hour MACD begins to form a golden cross, it preliminarily confirms the bottom. The daily MACD golden cross further confirms the bottom.
5. How to use the Fear and Greed Index to determine the final peak of a bull market?
The final peak of a bull market is the peak of the bull-bear reversal.
(1) The Fear and Greed Index rises to near the upper Bollinger band on a daily level, weekly upper Bollinger band, and monthly upper Bollinger band, with values above 75, most around 85-90 or even higher.
(2) The daily RSI is around 70 or above, and if the daily RSI shows a top divergence, the certainty is greater.
(3) The daily CCI is above 100, and can reach 200 to 300, or if the daily CCI shows a top divergence, the certainty is greater.
(4) In the daily DMI index, if the PDI and ADX show significant spikes and declines, be cautious of the peak; if the ADX shows a significant cross below the ADXR, it preliminarily confirms the peak, and if the PDI crosses below the MDI forming a death cross, it further confirms the peak.
(5) When the daily MACD forms a death cross, the height of the red bar appears to expand, or when the daily MACD forms a golden cross, the green bar shrinks, and the 4-hour MACD begins to form a death cross, it preliminarily confirms the peak. The daily MACD death cross further confirms the peak.
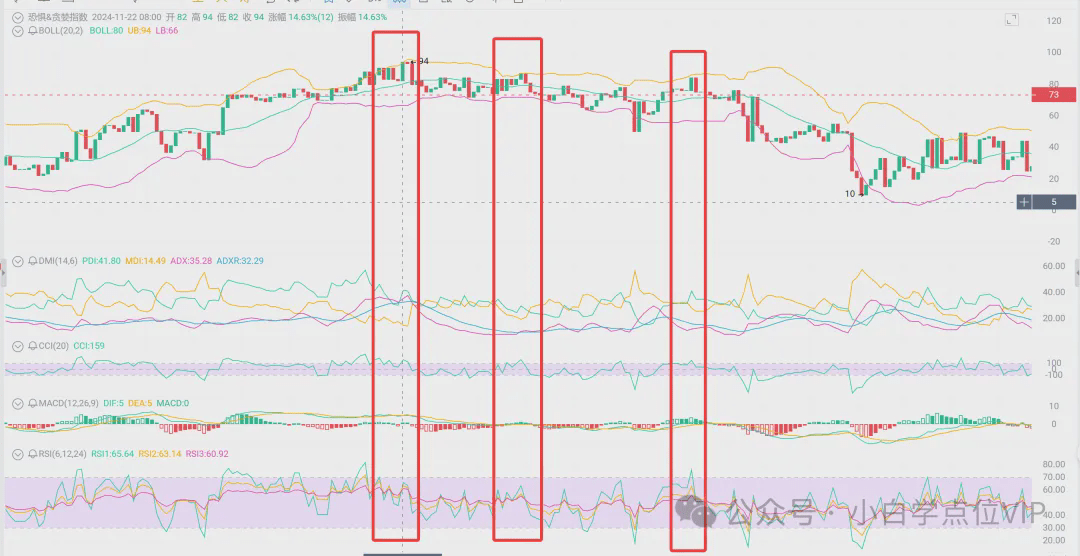
Final peaks often appear as double peaks or even triple peaks, and it is particularly important not to be confused by false breakouts! When double tops or triple tops occur, the daily RSI and CCI will show top divergences, and the daily MACD will show area or height divergences.
After the final peak appears, the market turns from bull to bear, and a bear market comes, so one must short! Don't have any illusions!


