1. The last escape opportunity for altcoins.
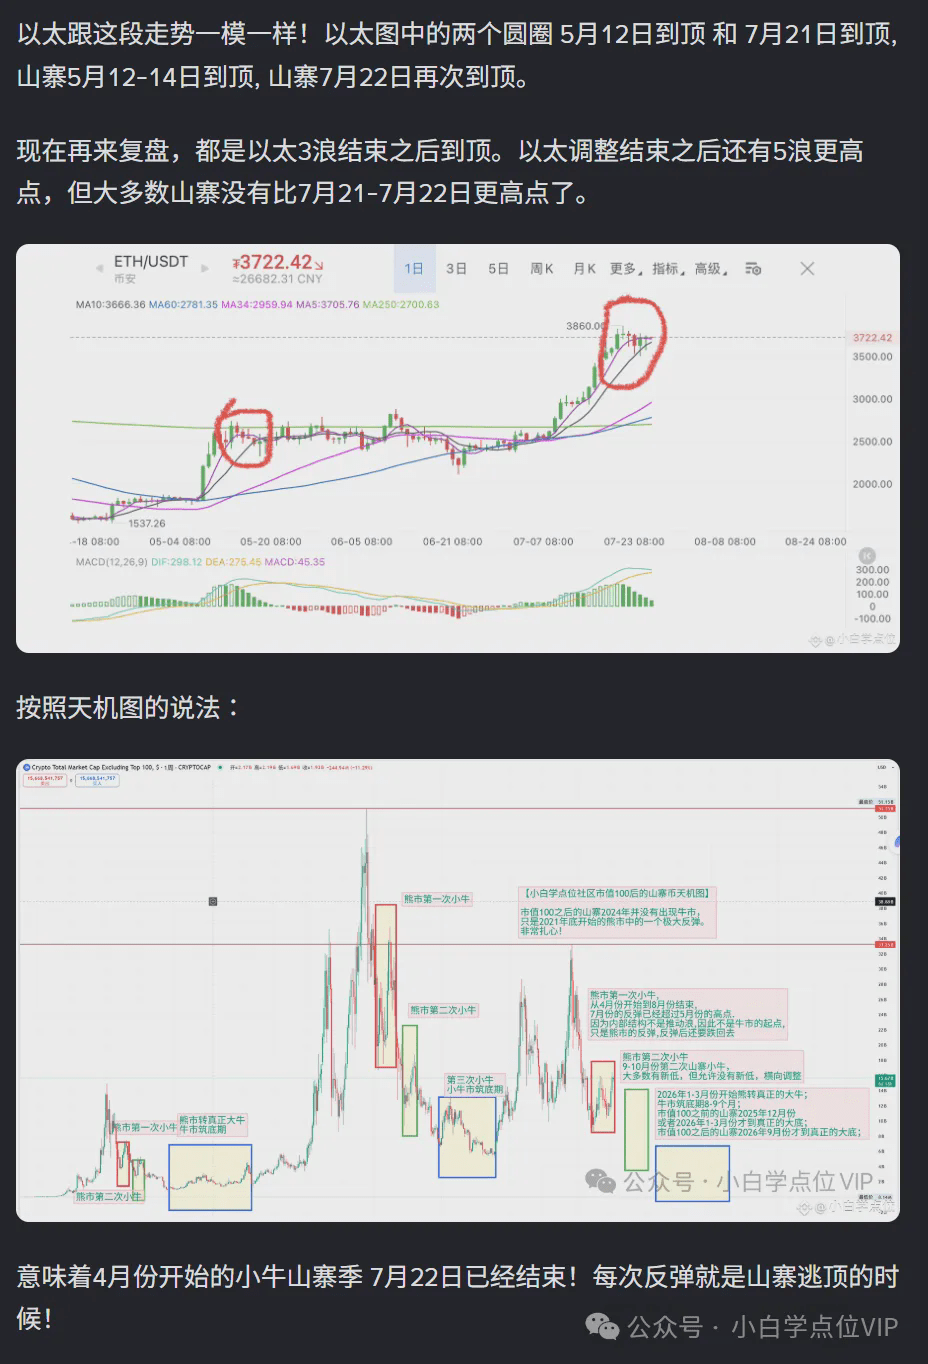
In last week's article (The 5 waves rise of Bitcoin has started! How to simply and preliminarily determine the main rising wave through MACD + MDI + ADX indicators?), it was mentioned that [If the Concubine is a false breakout, most fish, shrimp, and crab rises will not exceed the highest peak of July 22-23].
In my article on July 26 at a certain An Square (The season of fish, shrimp, and crabs that started in April has ended!):

The idea I proposed in the private circle on July 26 has been verified to be correct:

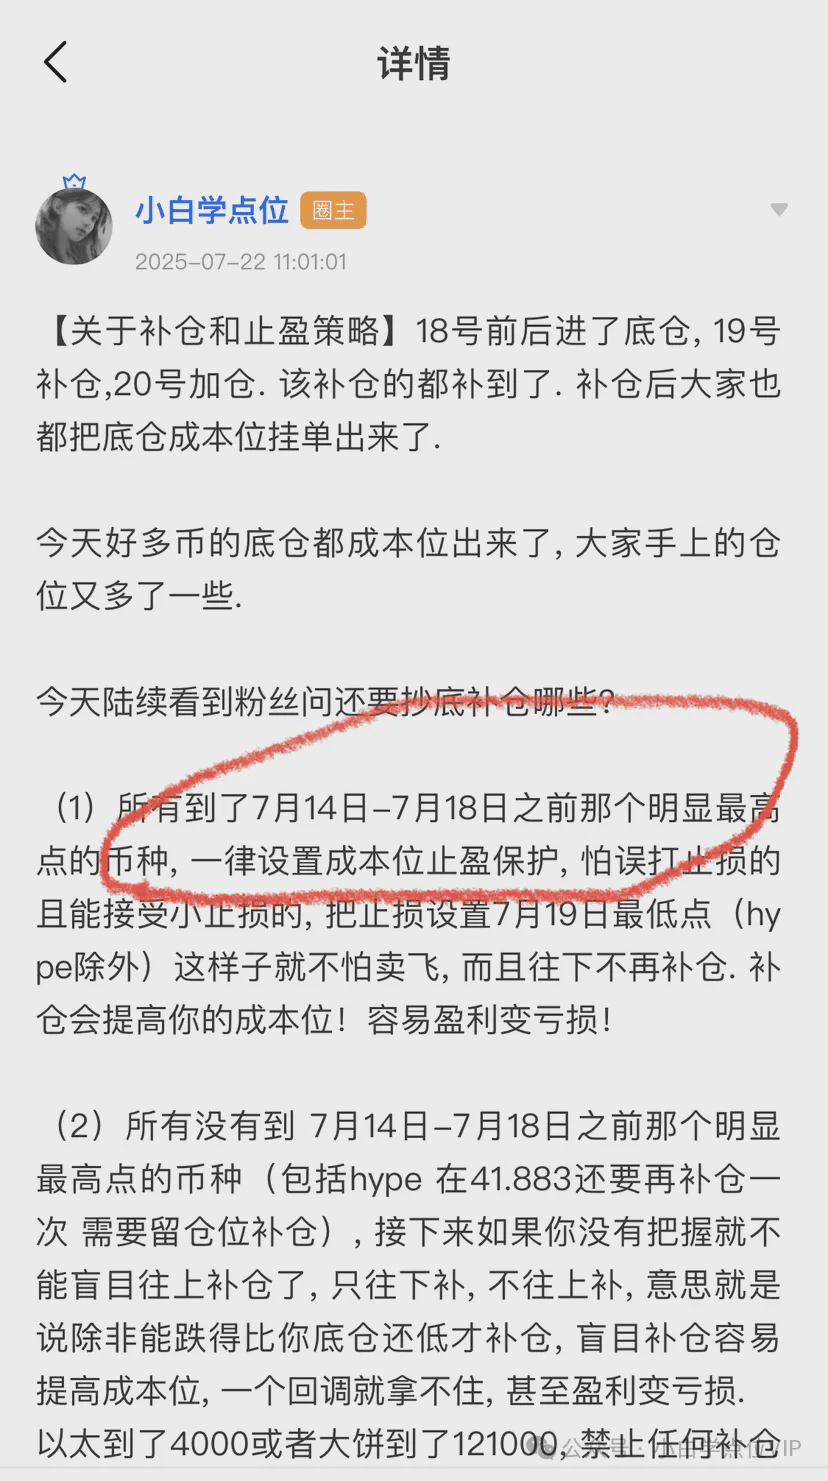
[The season of fish, shrimp, and crabs that started in April ended on July 22, the next wave of fish, shrimp, and crabs season will start in August-September and end in October.]
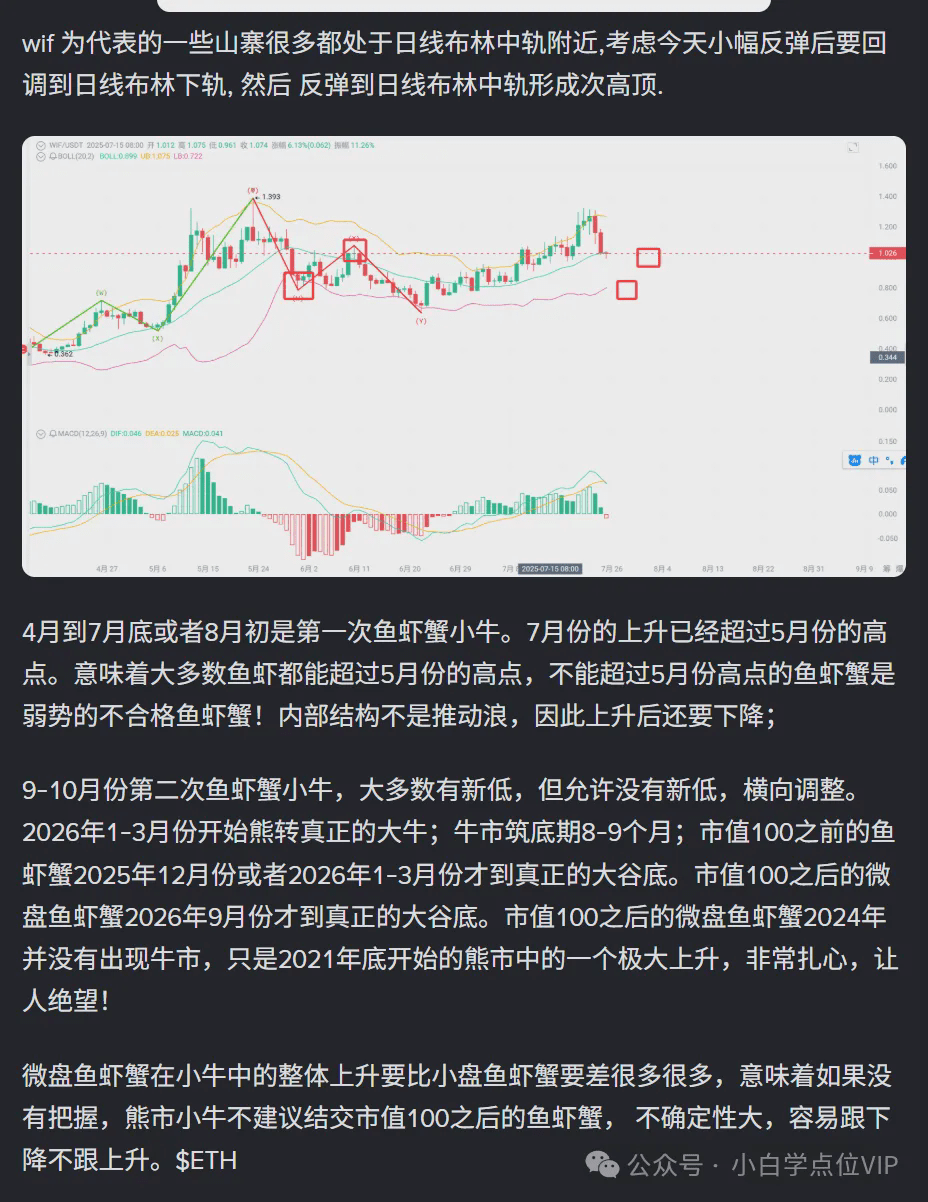
After July 26, the majority of fish, shrimp, and crab rose to the upper Bollinger band on the 4-hour chart, then fell to the lower Bollinger band on the daily chart, and then rose near the middle Bollinger band on the daily chart, forming a secondary peak, which must be lower than the highest point on July 21-22.
Taking WIF as an example, on April 28 it rose to near the upper Bollinger band on the 4-hour chart:
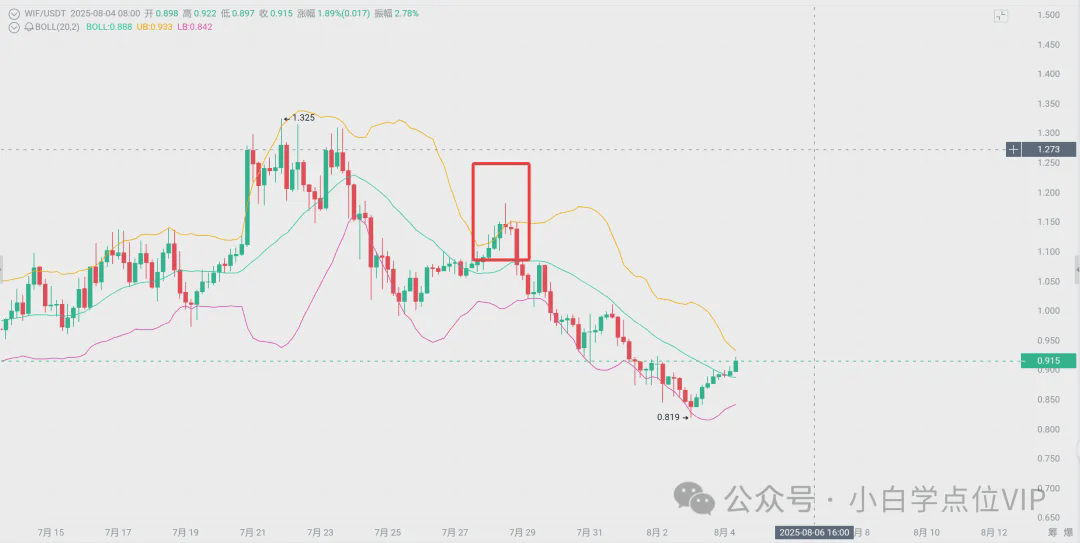
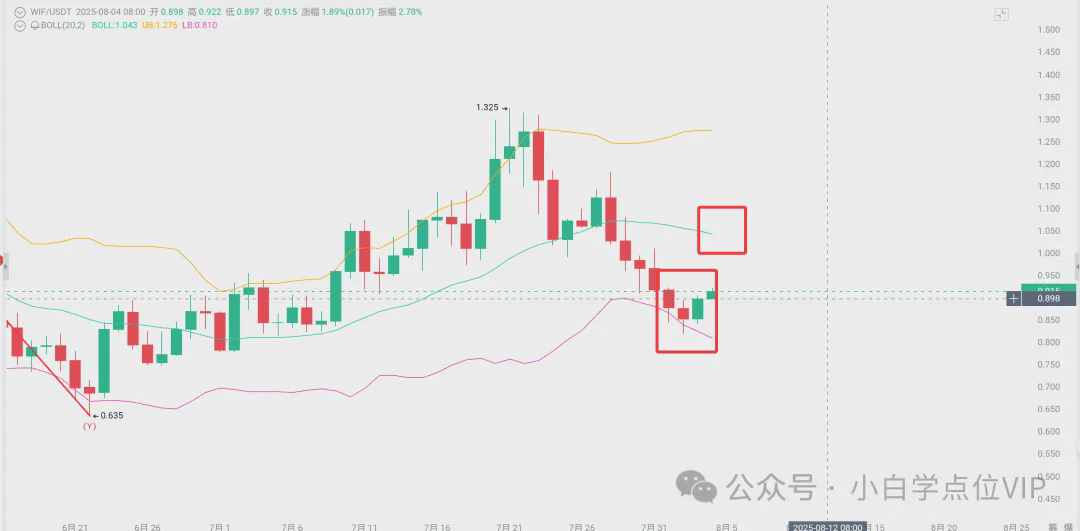
From August 1 to August 2, it fell to the lower Bollinger band on the daily chart and is currently moving towards the middle Bollinger band on the daily chart.
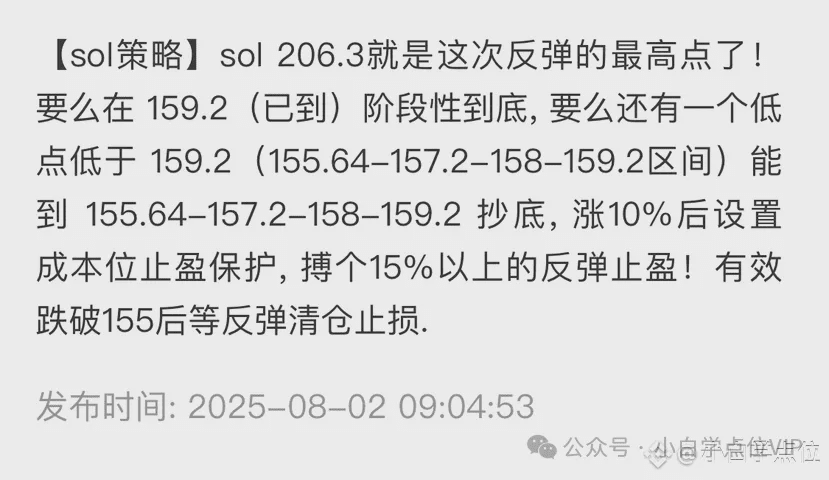
Taking SOL as an example, 155.64-157.2-158-159.2 indeed reached! The lowest was 155.83! There wasn't much error because it was already reminded that the season of fish, shrimp, and crabs had ended around July 22! 206.3 is the highest peak:
The overall rise of altcoins continues for 2-3 days or more, expecting to rise to the middle Bollinger band on the daily chart or near the upper Bollinger band, with a rise of about 10-15% or more, and then continue to decline! After the rise, fish, shrimp, and crabs must clean up their positions! Short positions!
Then it will continue to decline until the end of August or September, until the Bull Demon King's greed index falls below 46, preferably below 20-26, and then in September-October the small bulls of fish, shrimp, and crabs will start!
2. Huge divergence, the Bull Demon King and the Concubine may not have 5 waves anymore!
In my article on August 1 at a certain An Square (Huge divergence, extreme uncertainty, waiting quietly for the new small bulls of fish, shrimp, and crabs in late August or September!), I pointed out that [the Bull Demon King and the Concubine may not have 5 waves anymore]:


I also analyzed the wave pattern of Bitcoin in my article on August 2 at a certain An Square (The rise after the significant drop of fish, shrimp, and crabs is coming! Will the Bull Demon King and the Concubine have 5 waves to succeed here?).


 In fact, the Bull Demon King's trend is consistent with my prediction, both the internal structure and position are consistent, and the Bull Demon King has also risen below 112722.58, with the lowest at 111920.
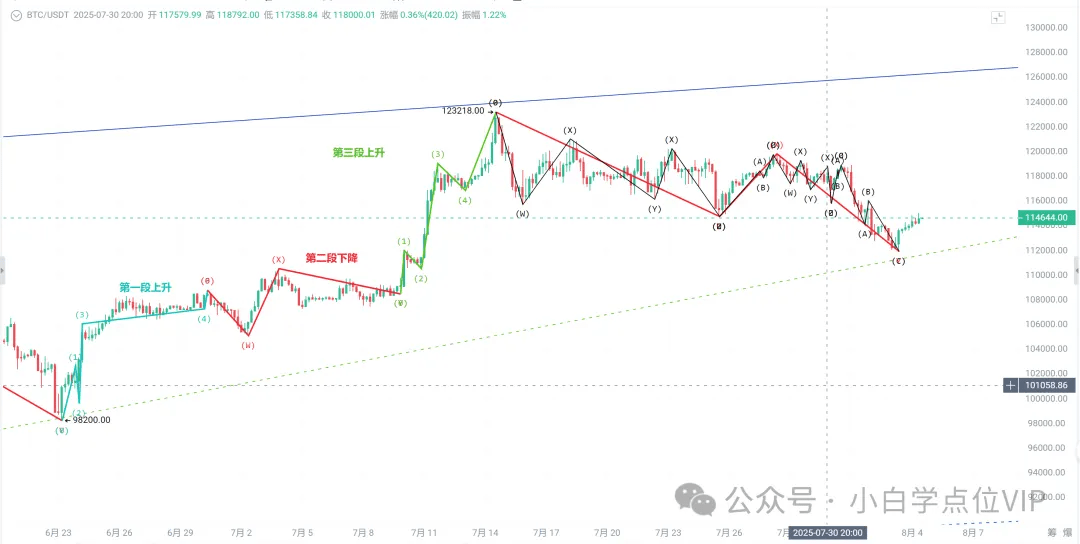

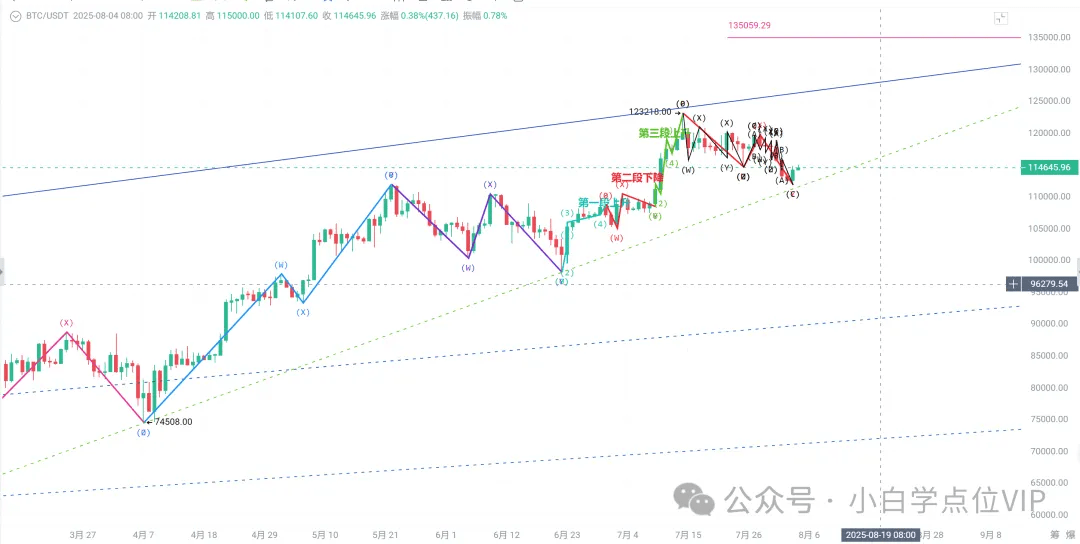
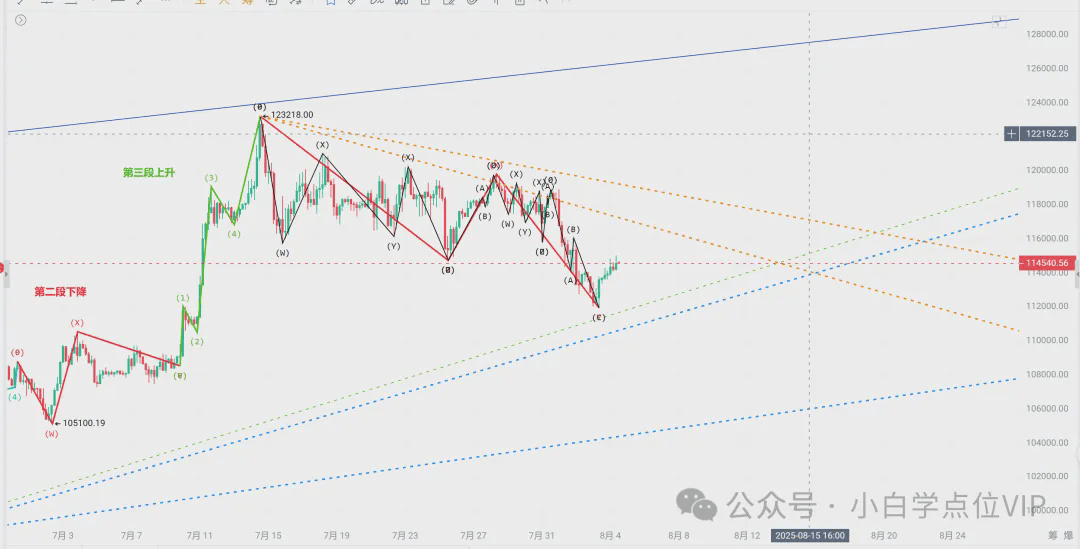
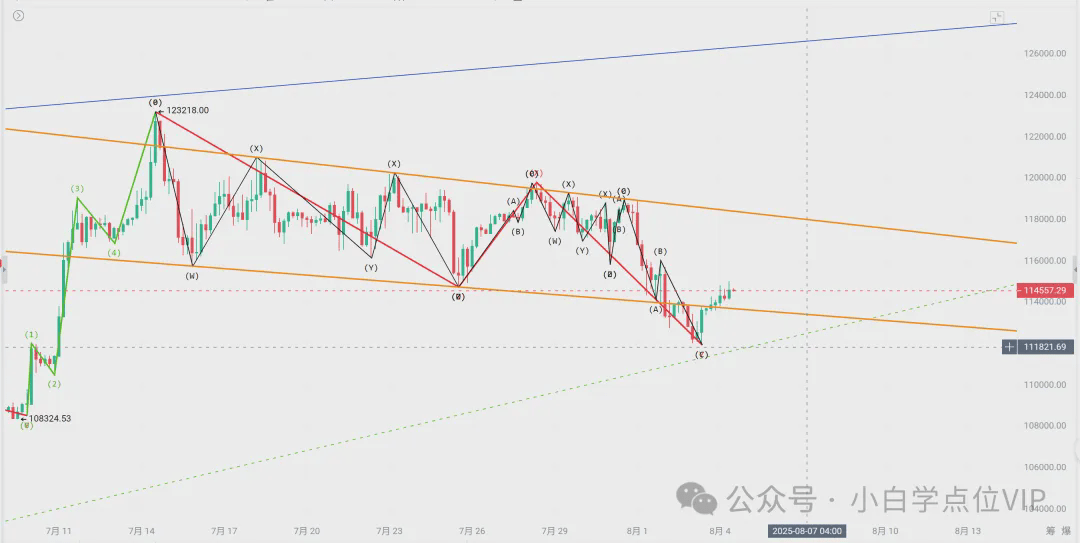
The overall wave chart of Bitcoin is as follows. If it effectively loses the green rising trend line, then the entire rise after 74508 will also end! It can be said that this is the last opportunity for the speculative party, with no retreat! If the speculative party no longer resists, once it loses 111920 again, then the likelihood of 5 waves will be bleak!
Therefore, the gains and losses of 111920 are very critical, concerning whether the Bull Demon King still has 5 waves.
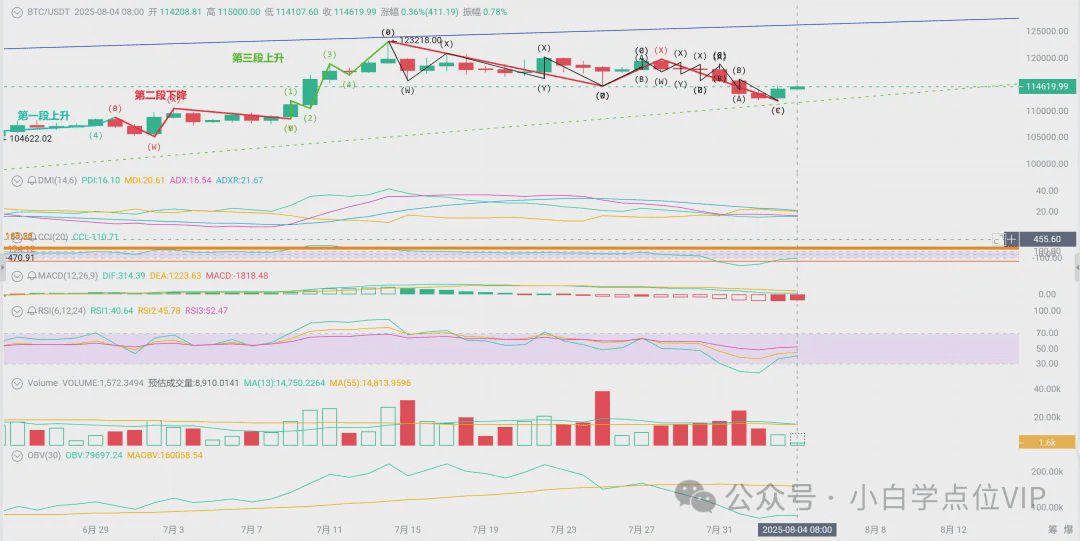
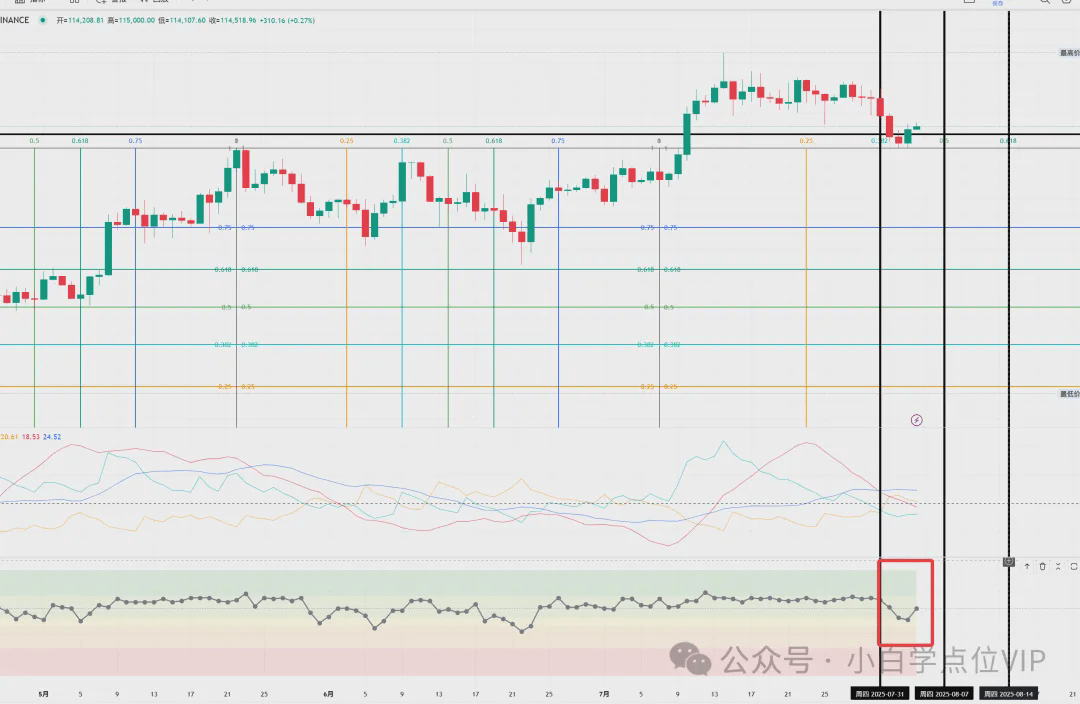
Analyzing from the daily indicators:
The daily MACD continues to show a dead cross. If there are still 5 waves, the daily MACD must cross golden again.
The daily DMI indicator PDI is below MDI. If there are still 5 waves, the daily PDI must cross above MDI.
The daily ADX and ADXR are trending downwards, and ADX is below ADXR and has been below 20-25. If there are still 5 waves, the daily ADX must cross above ADXR and be above 20-25.
The daily OBV continues to be below MAOBV. If there are still 5 waves, the daily OBV must cross above MAOBV.
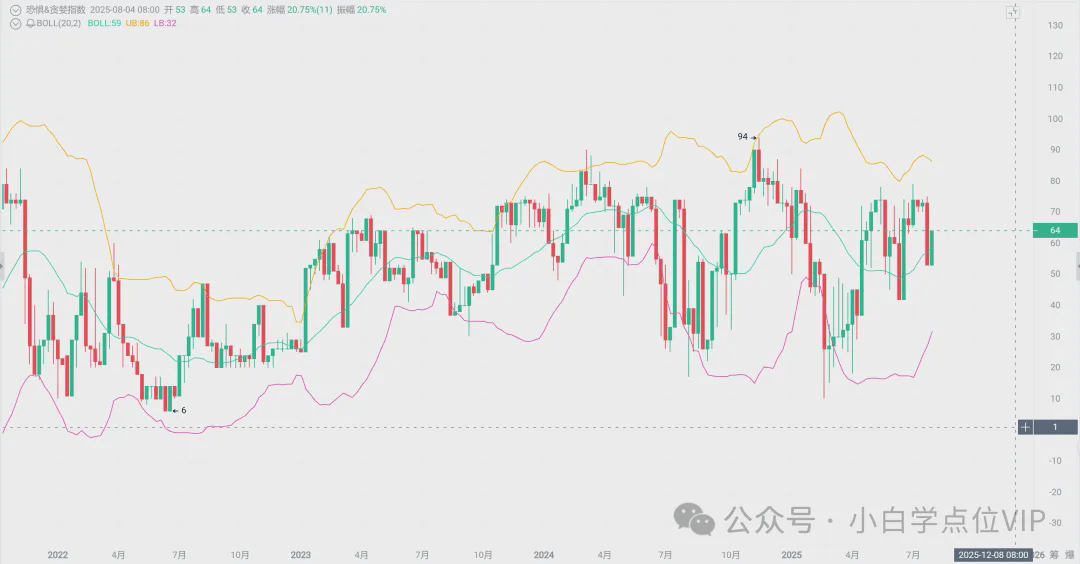
From the analysis of the greed and fear index, the Bull Demon King's greed and fear index was at its lowest at 53 in the past two days.
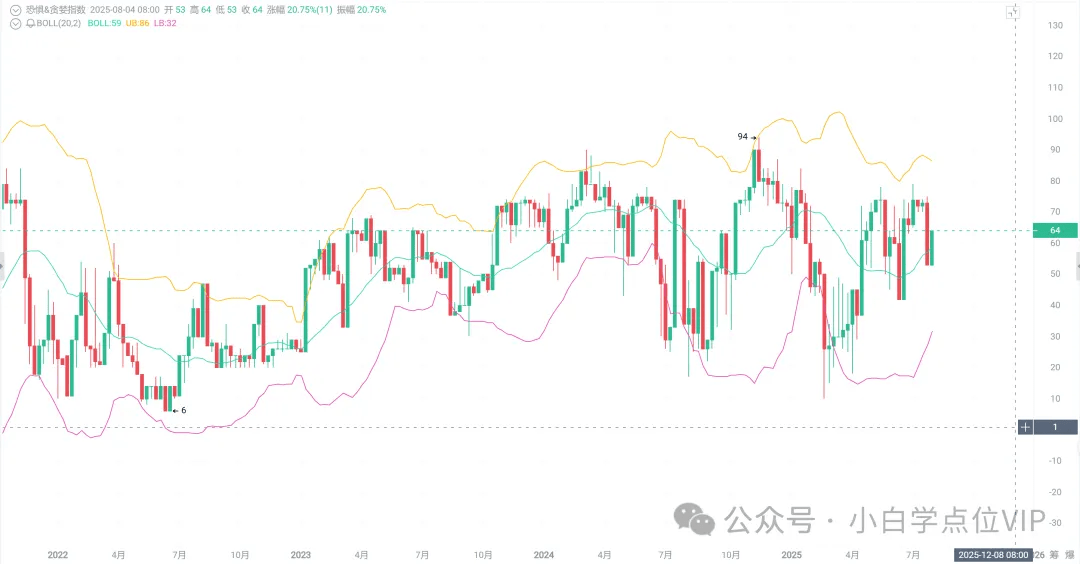
If there are still 5 waves, the index value needs to exceed 75 again, even above 85-90.
If there are no 5 waves, the greed index needs to fall below 25 again.
From the perspective of the Gann time series, the two recent important time nodes, July 22 and August 1, are both phase peaks! The next important time node is August 11.
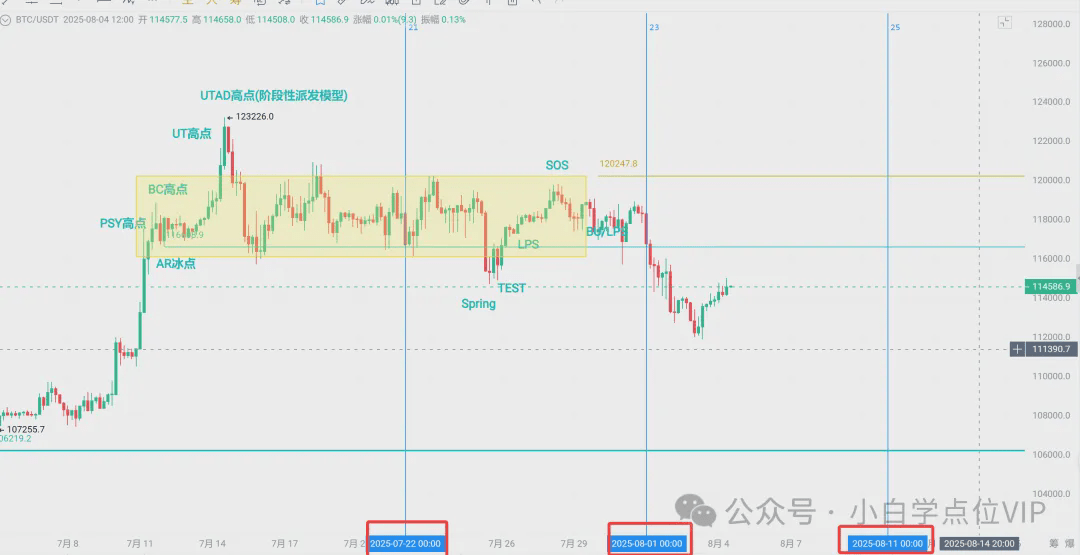
Whether there are still 5 waves depends on the bottleneck of the two orange Gann angle lines. Only if it stabilizes can there be a possibility of 5 waves, otherwise the rise after 74508 will end!
If it loses both blue Gann angle lines, there will be no opportunity at all.
In addition, Bitcoin is moving between two orange channel lines. If it cannot break through the upper edge of the orange channel line, then there will be no 5 waves.
3. What will happen to Bitcoin next?
Next, we will judge the wave pattern based on the rise after 111920, as shown in the figure:
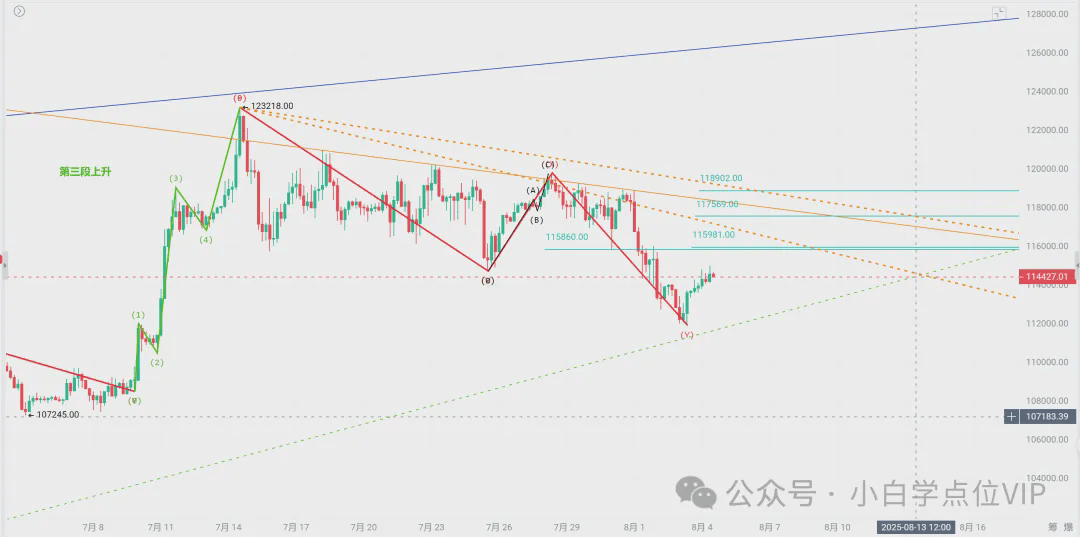
(1) Assuming the rise does not exceed 115860-115981, then the drop of the red line after 123218 is more likely to be a wxyxz adjustment wave, and the red line has one last drop below 111920 before it has a relatively large rise, but if it breaks through 108789, then there will be no 5 waves at all.
(2) Assuming the rise exceeds 115860-115981 and reaches 117569-118902 but stops, then the likelihood of 5 waves is very low.
(3) Assuming the rise significantly exceeds 118902 and effectively stabilizes above 120000, the probability of 5 waves is greater.
(4) Among them, the two orange dashed Gann angle lines and the upper edge of the descending channel are key bottlenecks.
4. What will Ethereum do next?
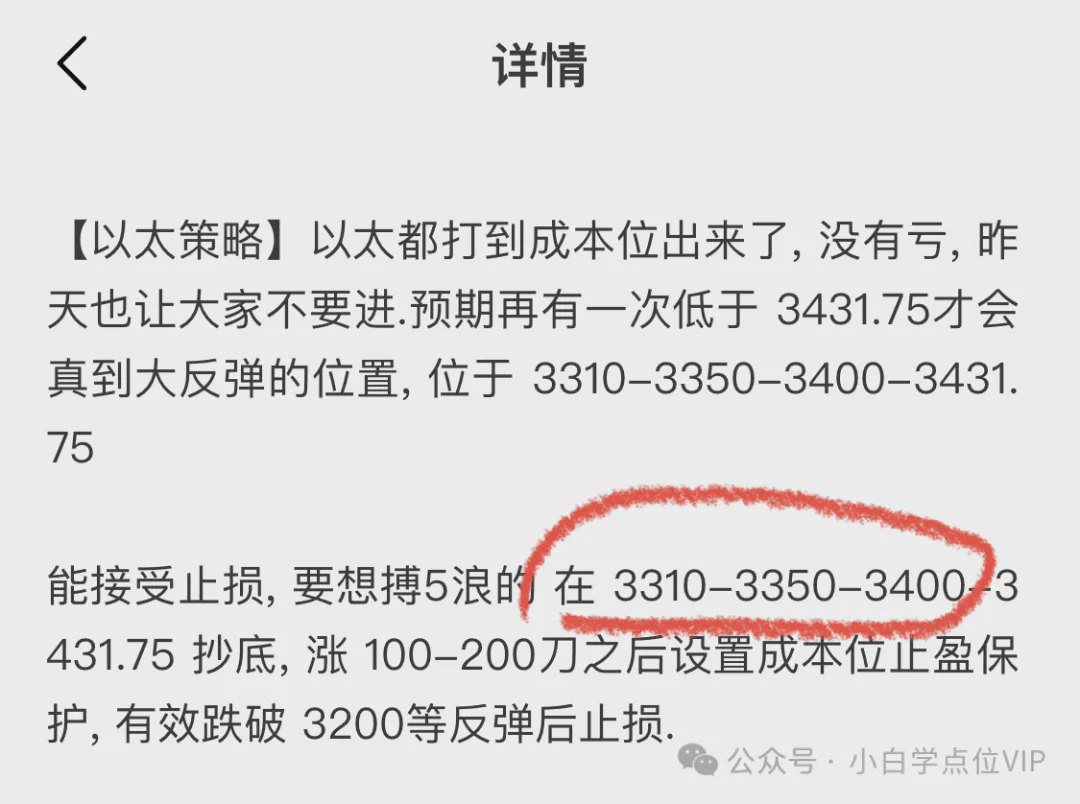
The Concubine indeed pointed out the formation of a temporary bottom near 3350 on August 2 in a private circle.
The chart of the Concubine is as follows, judging the wave pattern based on the rising amplitude after 3354:
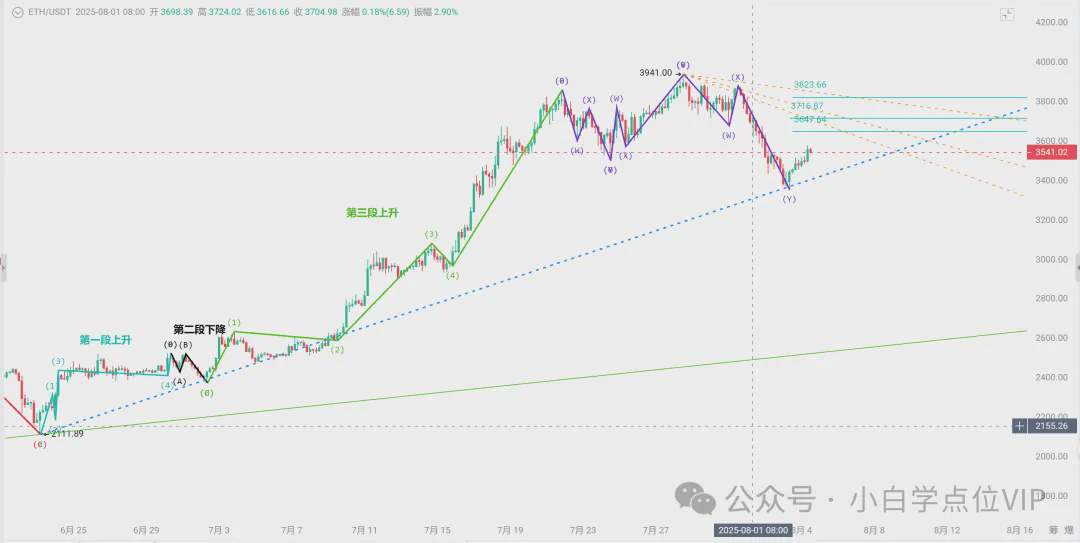
(1) Assuming the rise does not exceed 3647.64, the drop of the purple line is more likely to be a wxyxz adjustment wave, and the purple line has one last drop below 3354 before it can have a relatively large rise.
But if it breaks through 2525, then there will be no 5 waves at all (the lag is very large, and it has no significance for networking).
(2) Assuming the rise exceeds 3647.64-3716.87 but stops at 3823.66, then the likelihood of 5 waves is very low.
(3) Assuming the rise significantly exceeds 3823.66 and effectively stabilizes at 3823.66, the probability of 5 waves is greater.
(4) The Concubine showed an upward movement at the blue Gann angle line, focusing on the bottlenecks of the three orange Gann angle lines.
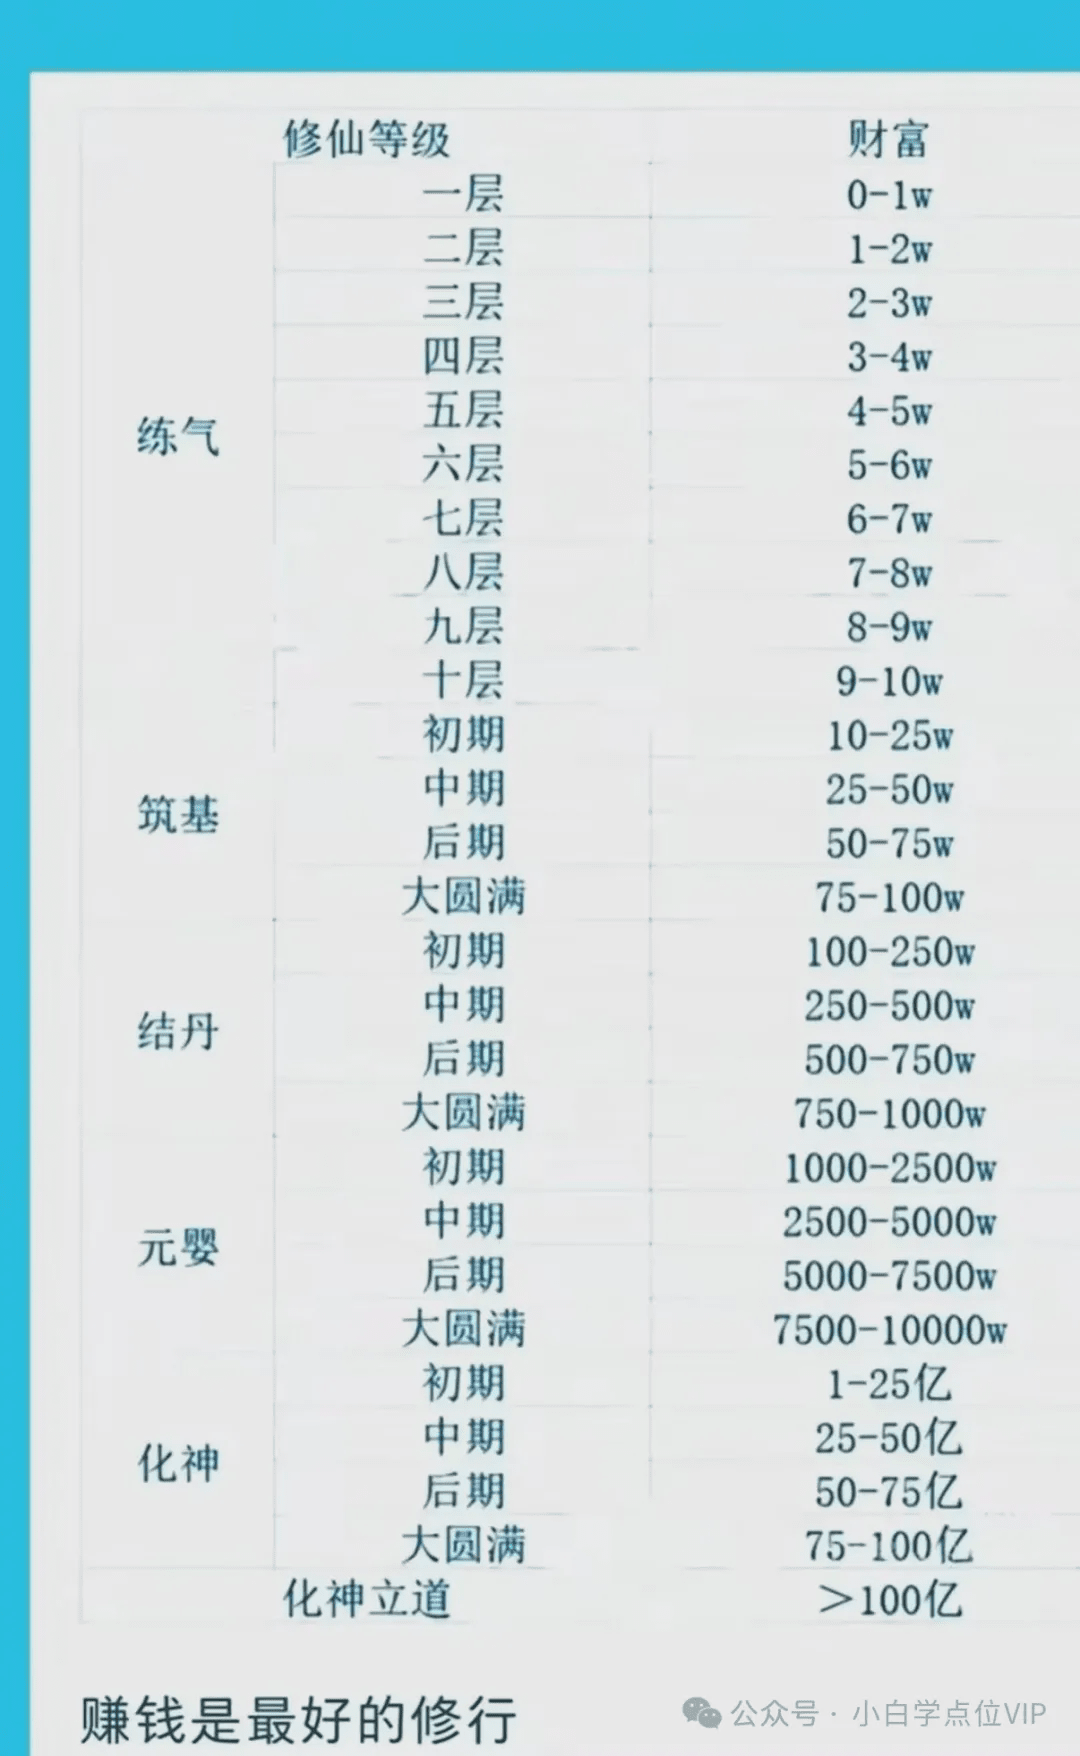
5. Immortals in the realm of cultivation, what level have you all cultivated to?
6. The A-share Shanghai Composite Index also has two scenarios.
[Wave Trend - Version A: 3-3-3-2-Y wave]
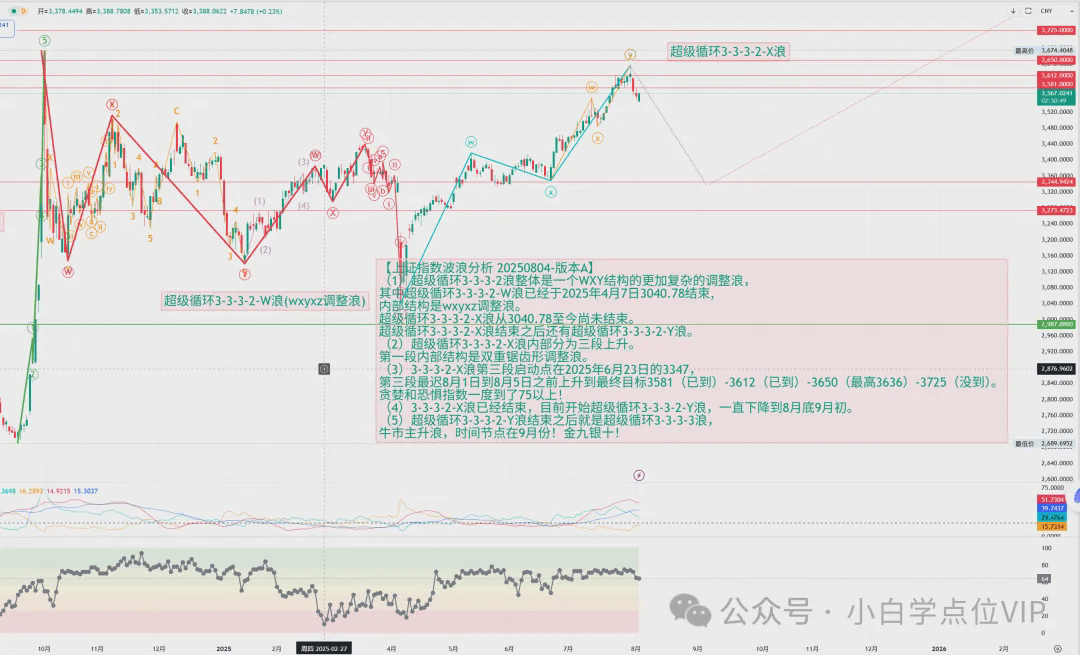
(1) The super cycle 3-3-3-2 wave is overall a more complex adjustment wave with a WXY structure.
The super cycle 3-3-3-2-W wave ended at 3040.78 on April 7, 2025.
The internal structure is a wxyxz adjustment wave.
The super cycle 3-3-3-2-X wave has not ended since 3040.78.
After the super cycle 3-3-3-2-X wave ends, there will still be the super cycle 3-3-3-2-Y wave.
(2) The super cycle 3-3-3-2-X wave is divided into three rising segments.
The first segment's internal structure is a double zigzag adjustment wave.
The third segment rises to the final target of 3581 (already reached) - 3612 (already reached) - 3650 (highest 3636) - 3725 (not reached) no later than August 1 to August 5.
The greed and fear index once reached above 75!
(4) The 3-3-3-2-X wave has ended, and we are now starting the super cycle 3-3-3-2-Y wave, which will continue to decline until the end of August or early September, and it must drop below 3462.752.
(5) After the super cycle 3-3-3-2-Y wave ends, there will be a super cycle 3-3-3-3 wave.
The main rising wave of the bull market, with the time node in September! Golden September and Silver October!
[Wave Trend - Version B: 3-3-3-3-1-4-B wave]
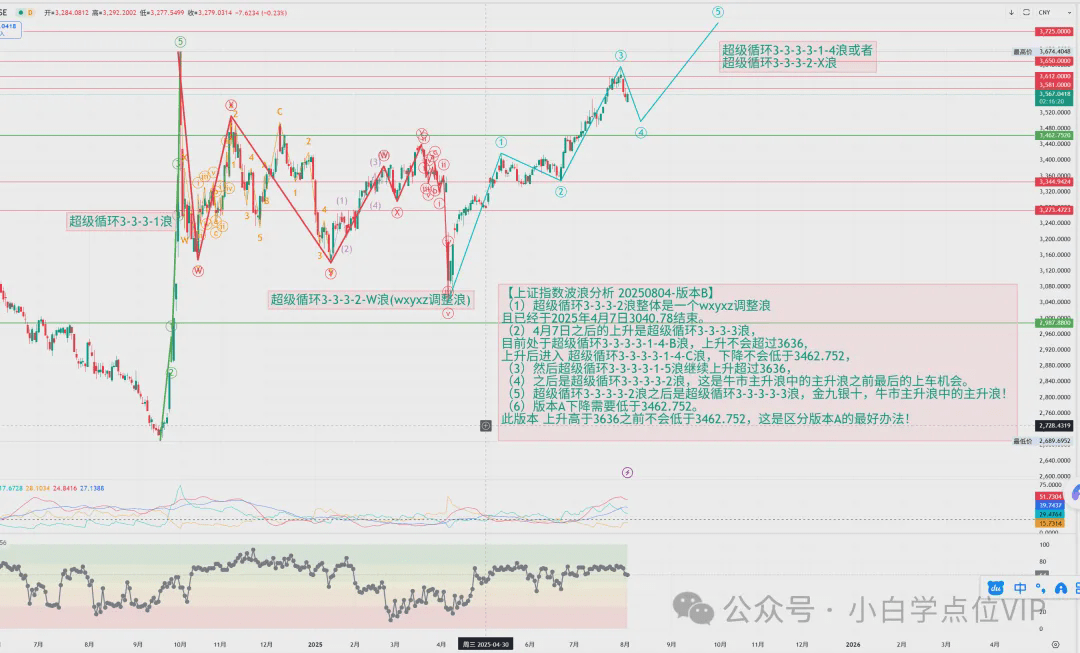
(1) The super cycle 3-3-3-2 wave is overall a wxyxz adjustment wave.
And it has ended at 3040.78 on April 7, 2025.
(2) The rise after April 7 is the super cycle 3-3-3-3 wave.
Currently in the super cycle 3-3-3-3-1-4-B wave, the rise will not exceed 3636.
After the rise, it enters the super cycle 3-3-3-3-1-4-C wave, and the decline will not be lower than 3462.752.
(3) Then the super cycle 3-3-3-3-1-5 waves continue to rise above 3636.
(4) After that is the super cycle 3-3-3-3-2 wave, which is the last opportunity to board before the main rising wave of the bull market.
(5) After the super cycle 3-3-3-3-2 wave, there is the super cycle 3-3-3-3-3 wave, golden September and silver October, the main rising wave in the bull market!
(6) Version A requires a drop below 3462.752. This Version B rise will not drop below 3462.752 before exceeding 3636, which is the best way to distinguish from Version A!
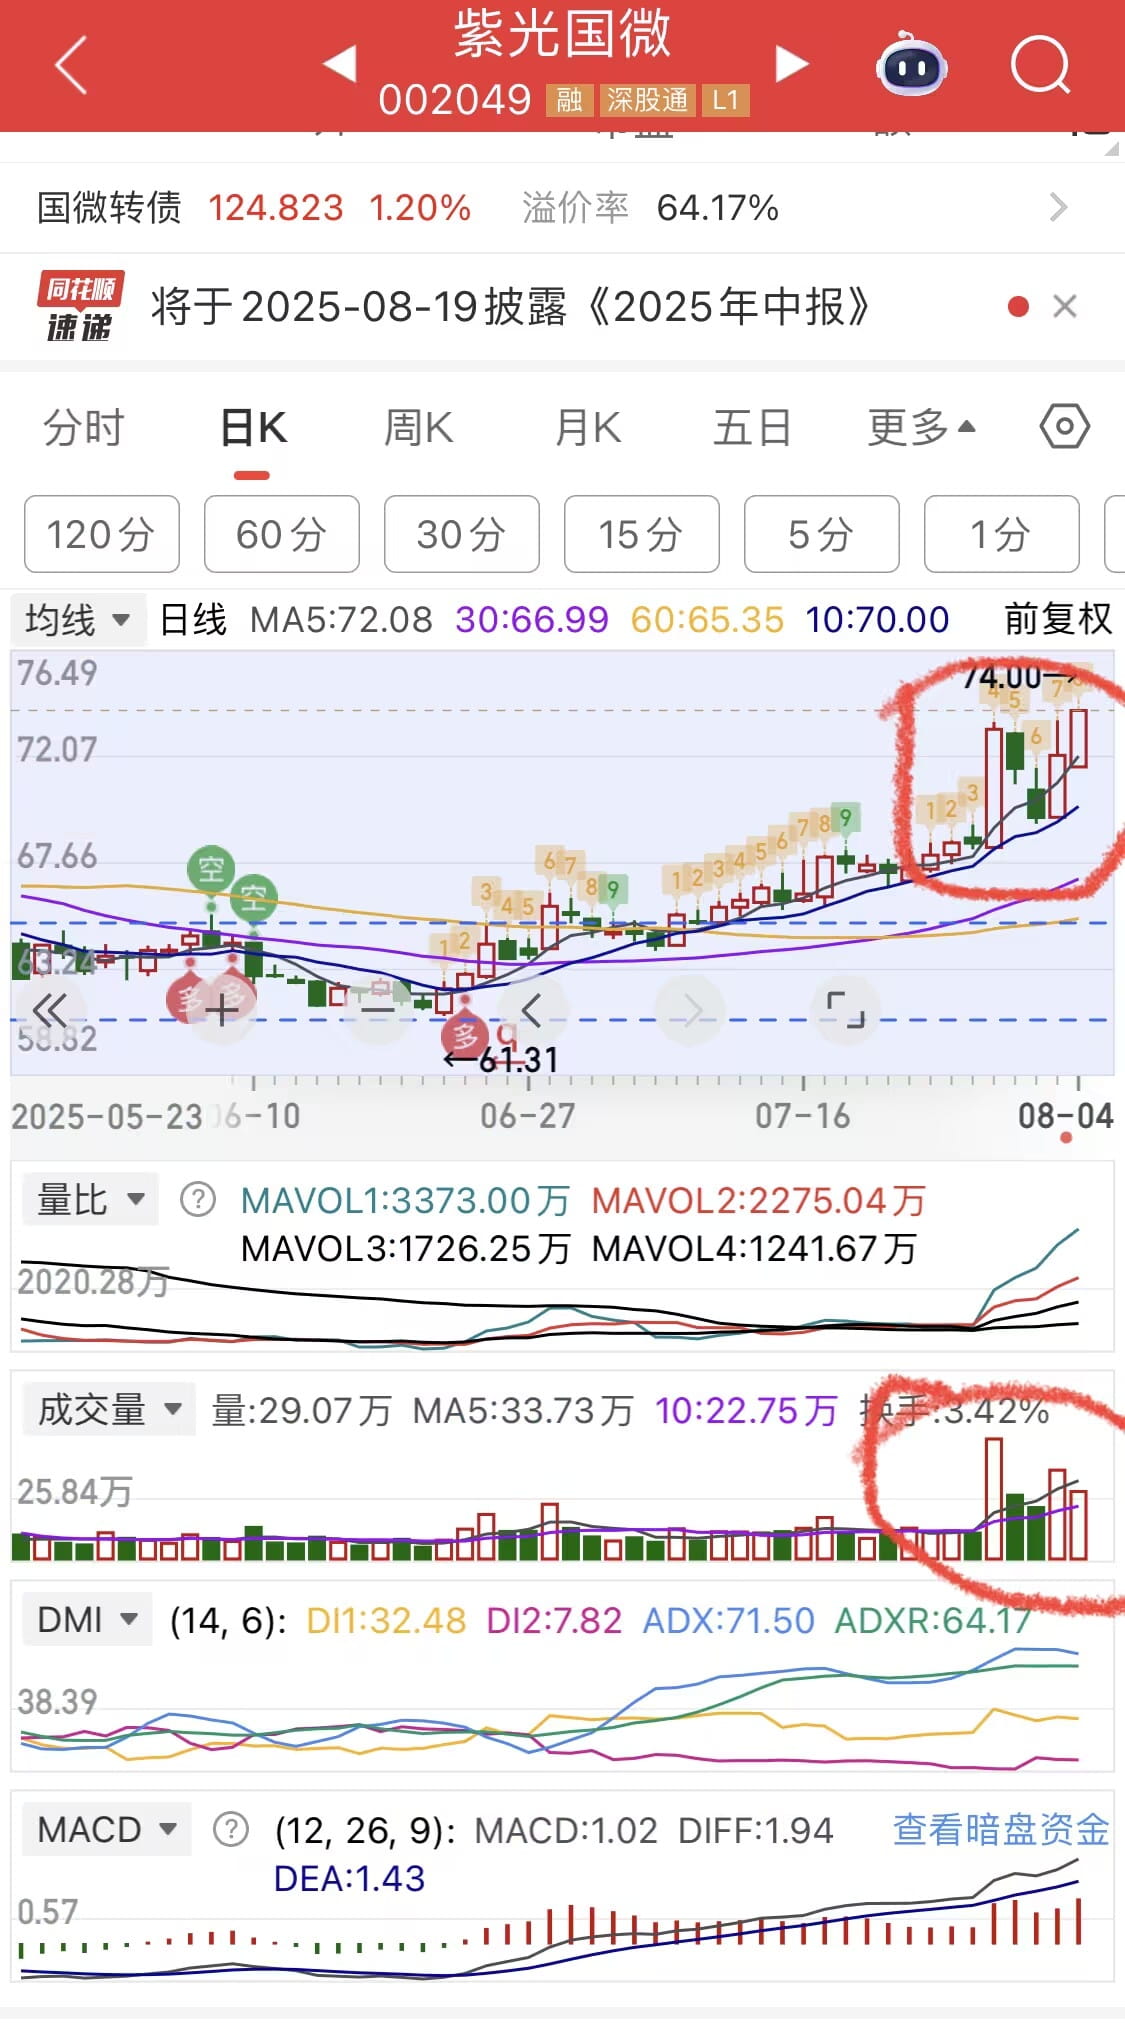
[Ziguang Guowei] The semiconductor chip sector has been very active recently; in August, semiconductor chips may become the main line!
Ziguang Guowei has started its main rising wave today after endless washing! The weekly line is about to break! The daily line is strongly bullish, and there has been an increase in volume for several days!
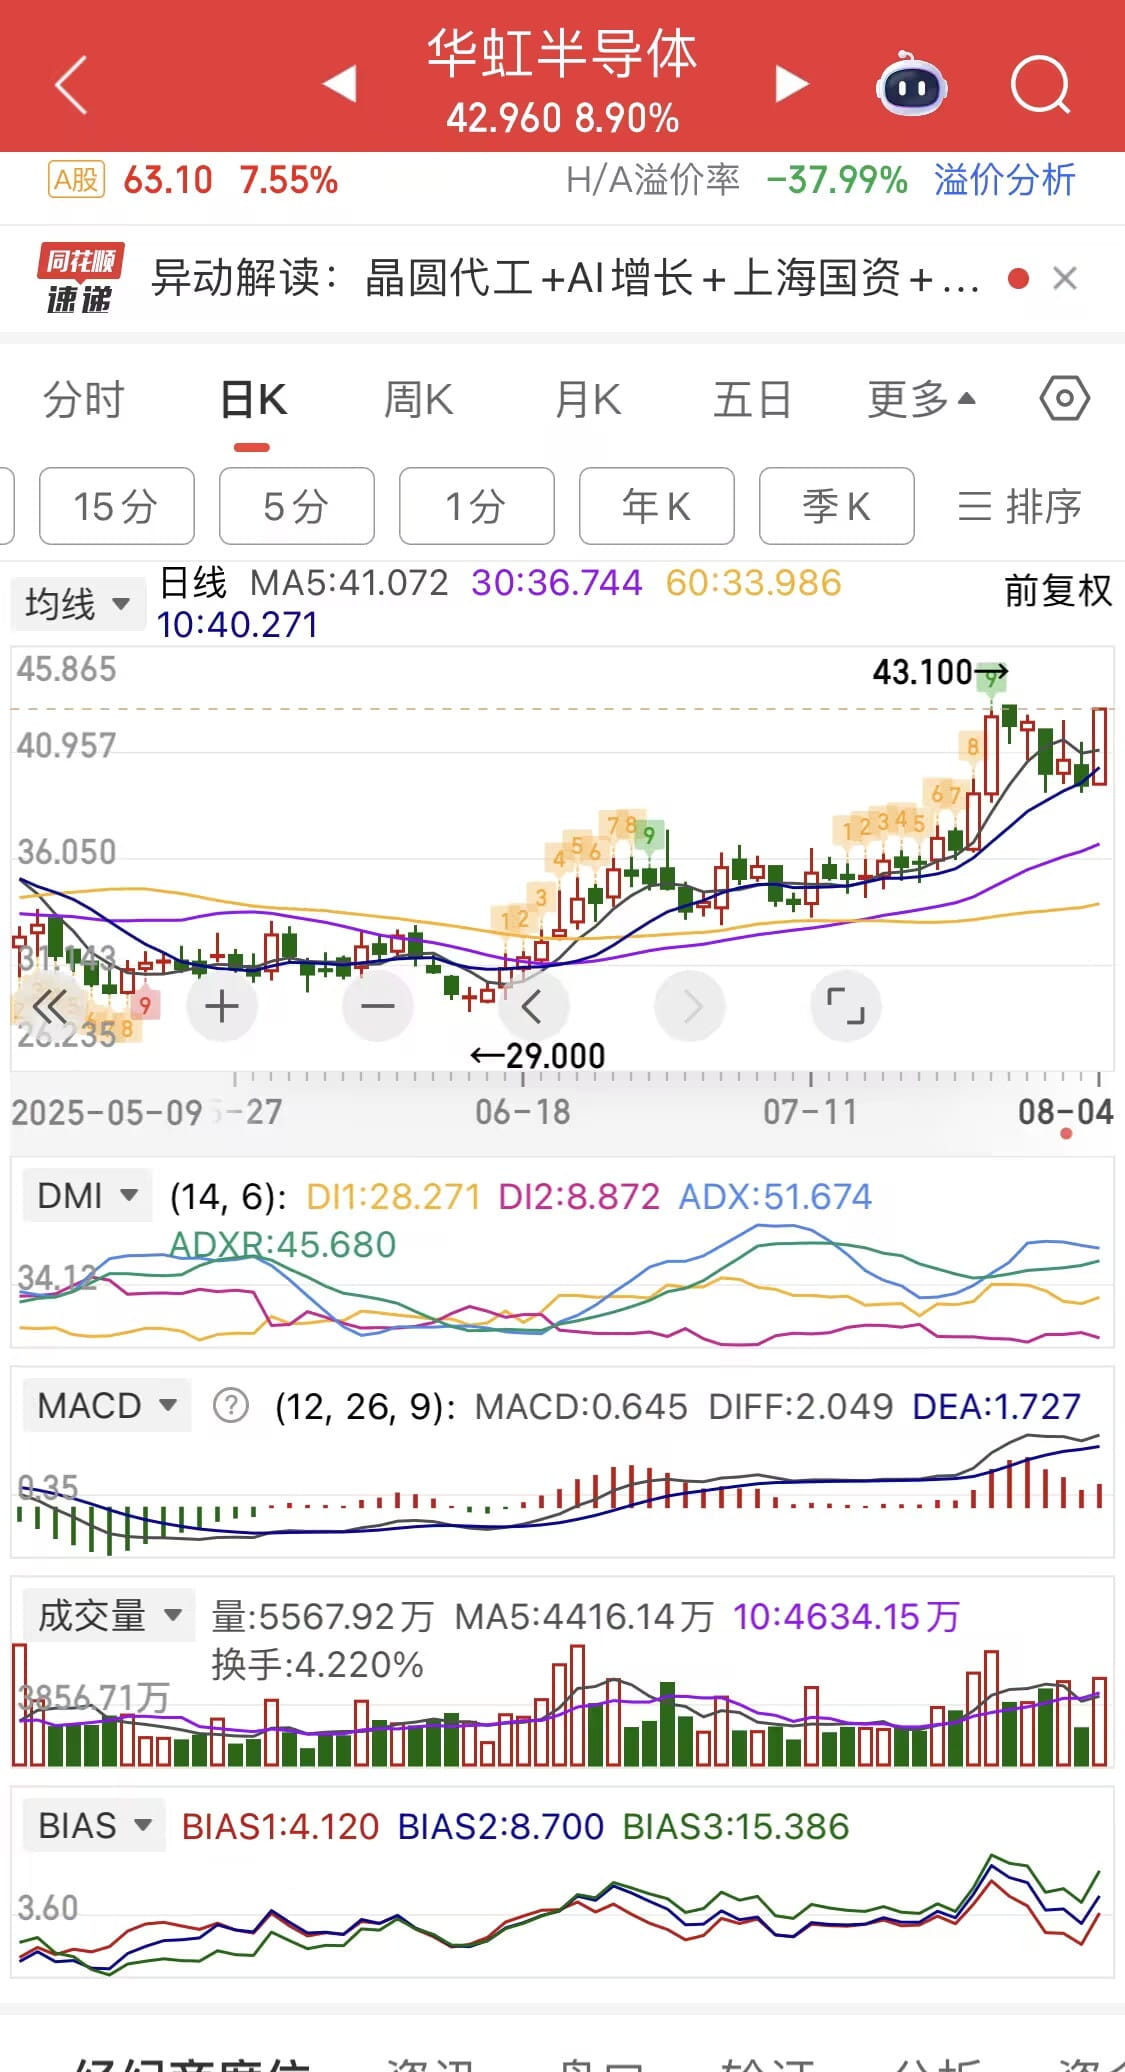
[Hua Hong Semiconductor] Hua Hong Semiconductor continues to rise sharply today!
The current Ziguang Guowei is equivalent to Kailaiying on May 26! Those who firmly held Kailaiying have doubled!
