
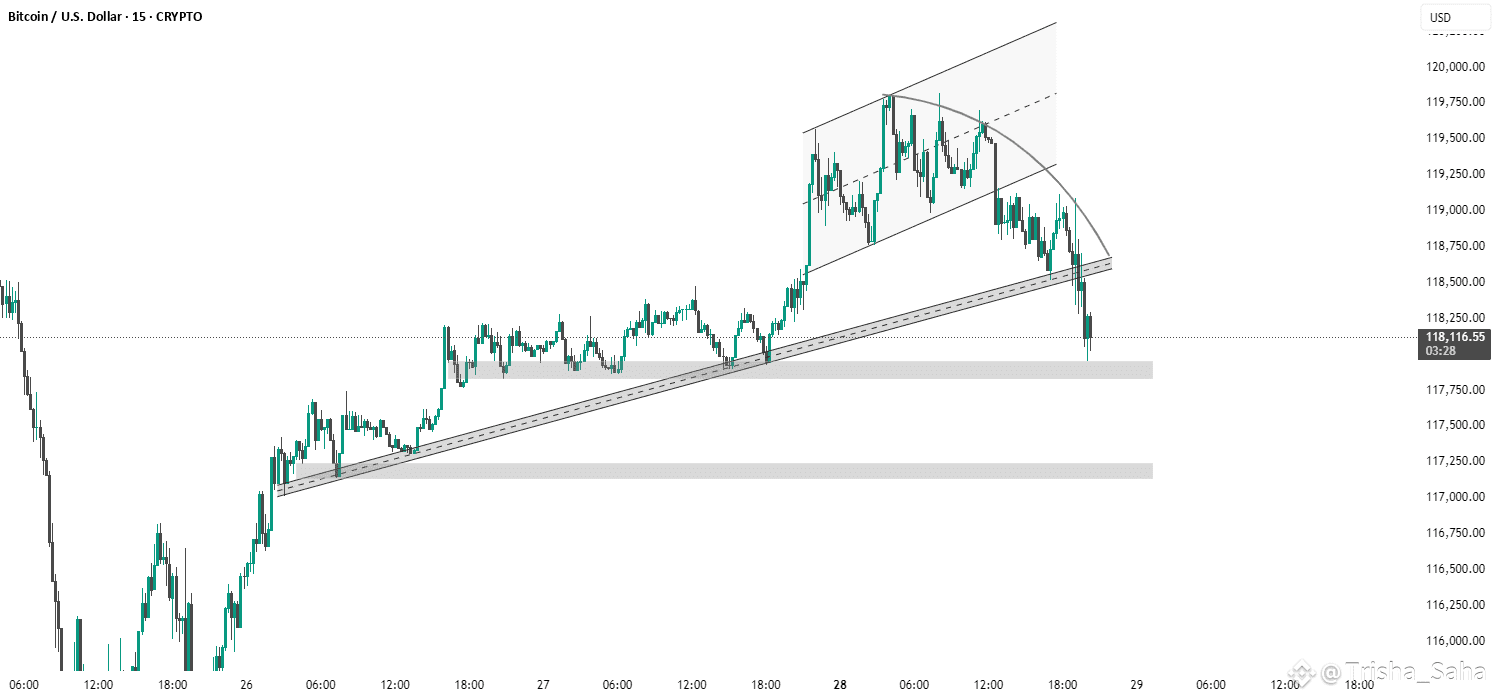
This 15-minute BTC/USD chart shows a clear breakdown from a rising channel, followed by a retest and rejection at the former support trendline. The price has now broken below key trendline support and is testing a demand zone near 118,000 USD. If this level fails to hold, the next support lies around the 117,250–117,000 USD zone. This indicates a potential shift in market structure from bullish to bearish in the short term.
#BinanceHODLerTree #DELABSBinanceTGE #BNBATH #US-EUTradeAgreement #ETHReclaims3800