Date: July 28, 2025
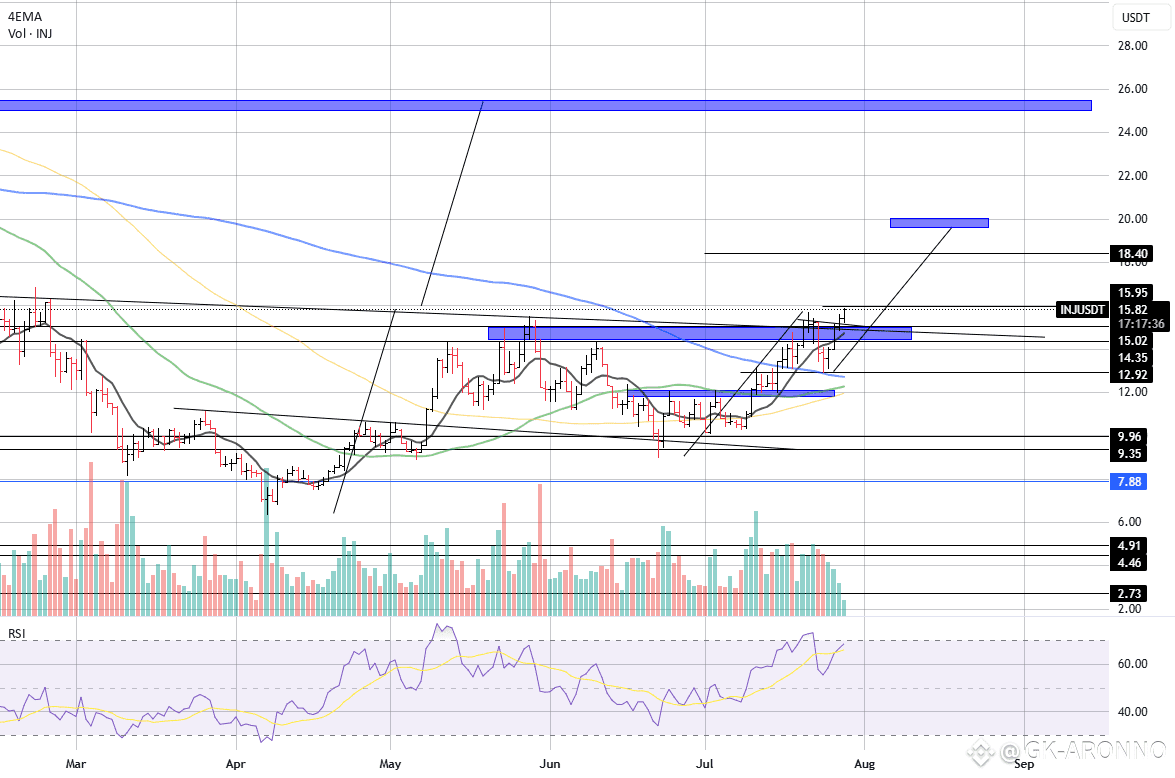
INJ/USDT is displaying a strong bullish structure after breaking through a major resistance zone, supported by increasing volume and positive momentum. The market appears to be entering a new expansion phase.
🔍 Technical Overview:
Current Price: $15.95
EMA Overview:
4EMA: $14.71
50EMA: $12.25
100EMA: $11.94
200EMA: $12.69
Price is currently above all major EMAs, confirming strong bullish momentum and trend alignment.
📊 Structure & Price Action:
Price successfully broke out of the $14.35–15.02 resistance zone, which previously acted as a rejection area.
A clear bullish continuation pattern can be seen, with rising trendlines and higher lows.
Price retested the breakout area and is now pushing higher – confirming demand at higher levels.
📉 Key Support Zones:
$15.02 (recent breakout level, now flipped to support)
$14.35
$12.92 (former consolidation resistance)
📈 Key Resistance & Target Zones:
$18.40: First significant upside target based on the measured move
$25–26 area: Major long-term resistance, highlighted as a high confluence target zone
📊 Indicators:
RSI: 68.57 – Bullish momentum, nearing overbought levels. Could lead to short-term consolidation or pullback, but the trend remains intact.
Volume: Gradually increasing volume with the breakout – a healthy sign of accumulation and breakout confirmation.
🎯 Bullish Outlook:
Trend: Strong uptrend with clean breakout structure
Short-term target: $18.40
Mid/Long-term target: $25–26
Dips toward $15.00–$14.30 may be attractive for bulls looking for continuation entries
📉 Invalidation:
A breakdown below $14.35 with high volume could suggest a failed breakout and bring price back toward the $12.90 zone
A move below the trendline would signal weakness, but until then, bulls remain in control
Good Trading!!