If you master these patterns, losses won't disappear, but your accuracy and timing will immediately improve. Let's start explaining them 👇
✅
Bullish reversal patterns
🟢
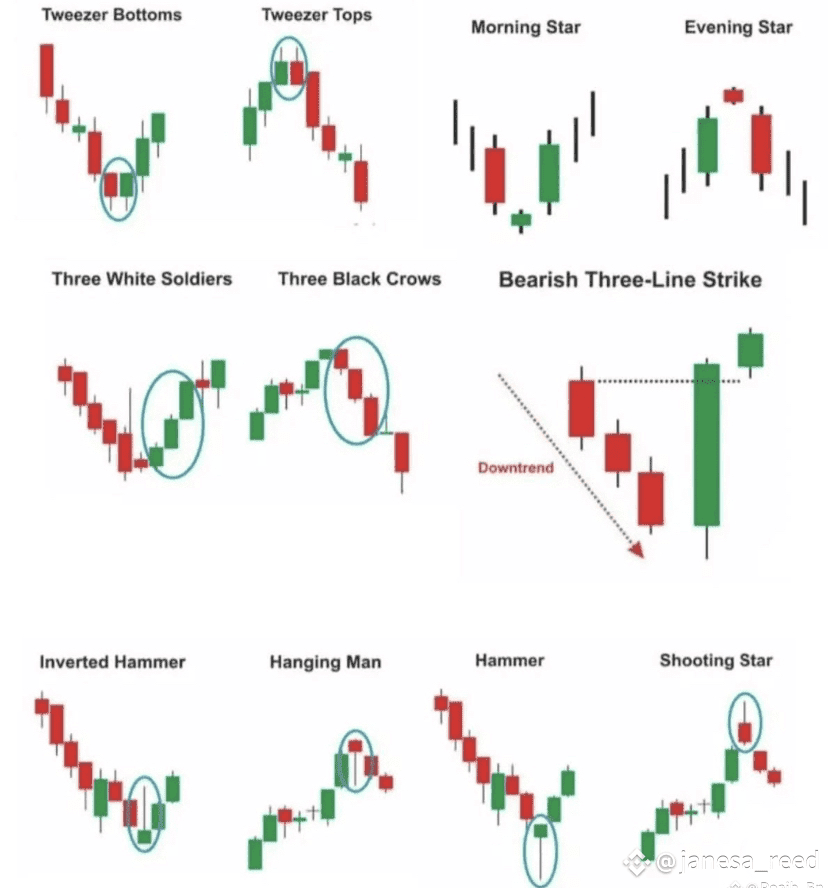
🔁 Bottom Tweezer
Two candles with matching lows - strong support area and buyer pressure stepping in.
🌄 Morning Star
Composition of three candles: Bearish ➝ Doji/Small body ➝ Strong Bullish. Indicates a reversal from bearish to bullish.
👨✈️ Three White Soldiers
Three strong consecutive bullish candles. Classic confirmation of a new bullish trend forming.
🔨 Hammer
Small body + long lower wick = price rejection and potential reversal. Appears after a decline.
📍 Inverted Hammer
Like a hammer, but inverted. The long upper wick shows that buyers tried to push - potential bullish reversal.
❌
Bearish reversal patterns
🔴
🔁 Upper Tweezer
Two candles with equal highs - strong resistance and a signal of seller entry.
🌆 Evening Star
Inverse of Morning Star: Bullish ➝ Doji/Small body ➝ Bearish. Strong reversal signal.
🦅 Three Black Crows
Three bearish candles with lower closes = end of the bullish move and start of a bearish trend.
🎯 Bearish Three Line Strike
Three red candles followed by large green candles - looks bullish, but it's a bull trap! Often leads to strong selling.
👤 Hanging Man
Appears after an uptrend. Small body + long lower wick = sellers creeping in.
🌠 Shooting Star
Small body + long upper wick. Buyers pushed hard but failed - bearish signal.
🖼️ Cheat sheet image for the pattern 👇 (insert image here)
💬 Did you find this helpful?
Drop a 🔥 in the comments if you're serious about learning price action.
And remember that:
✔️ Follow for more setups
✔️ Like if you enjoy a clean chart
✔️ Save for future trades