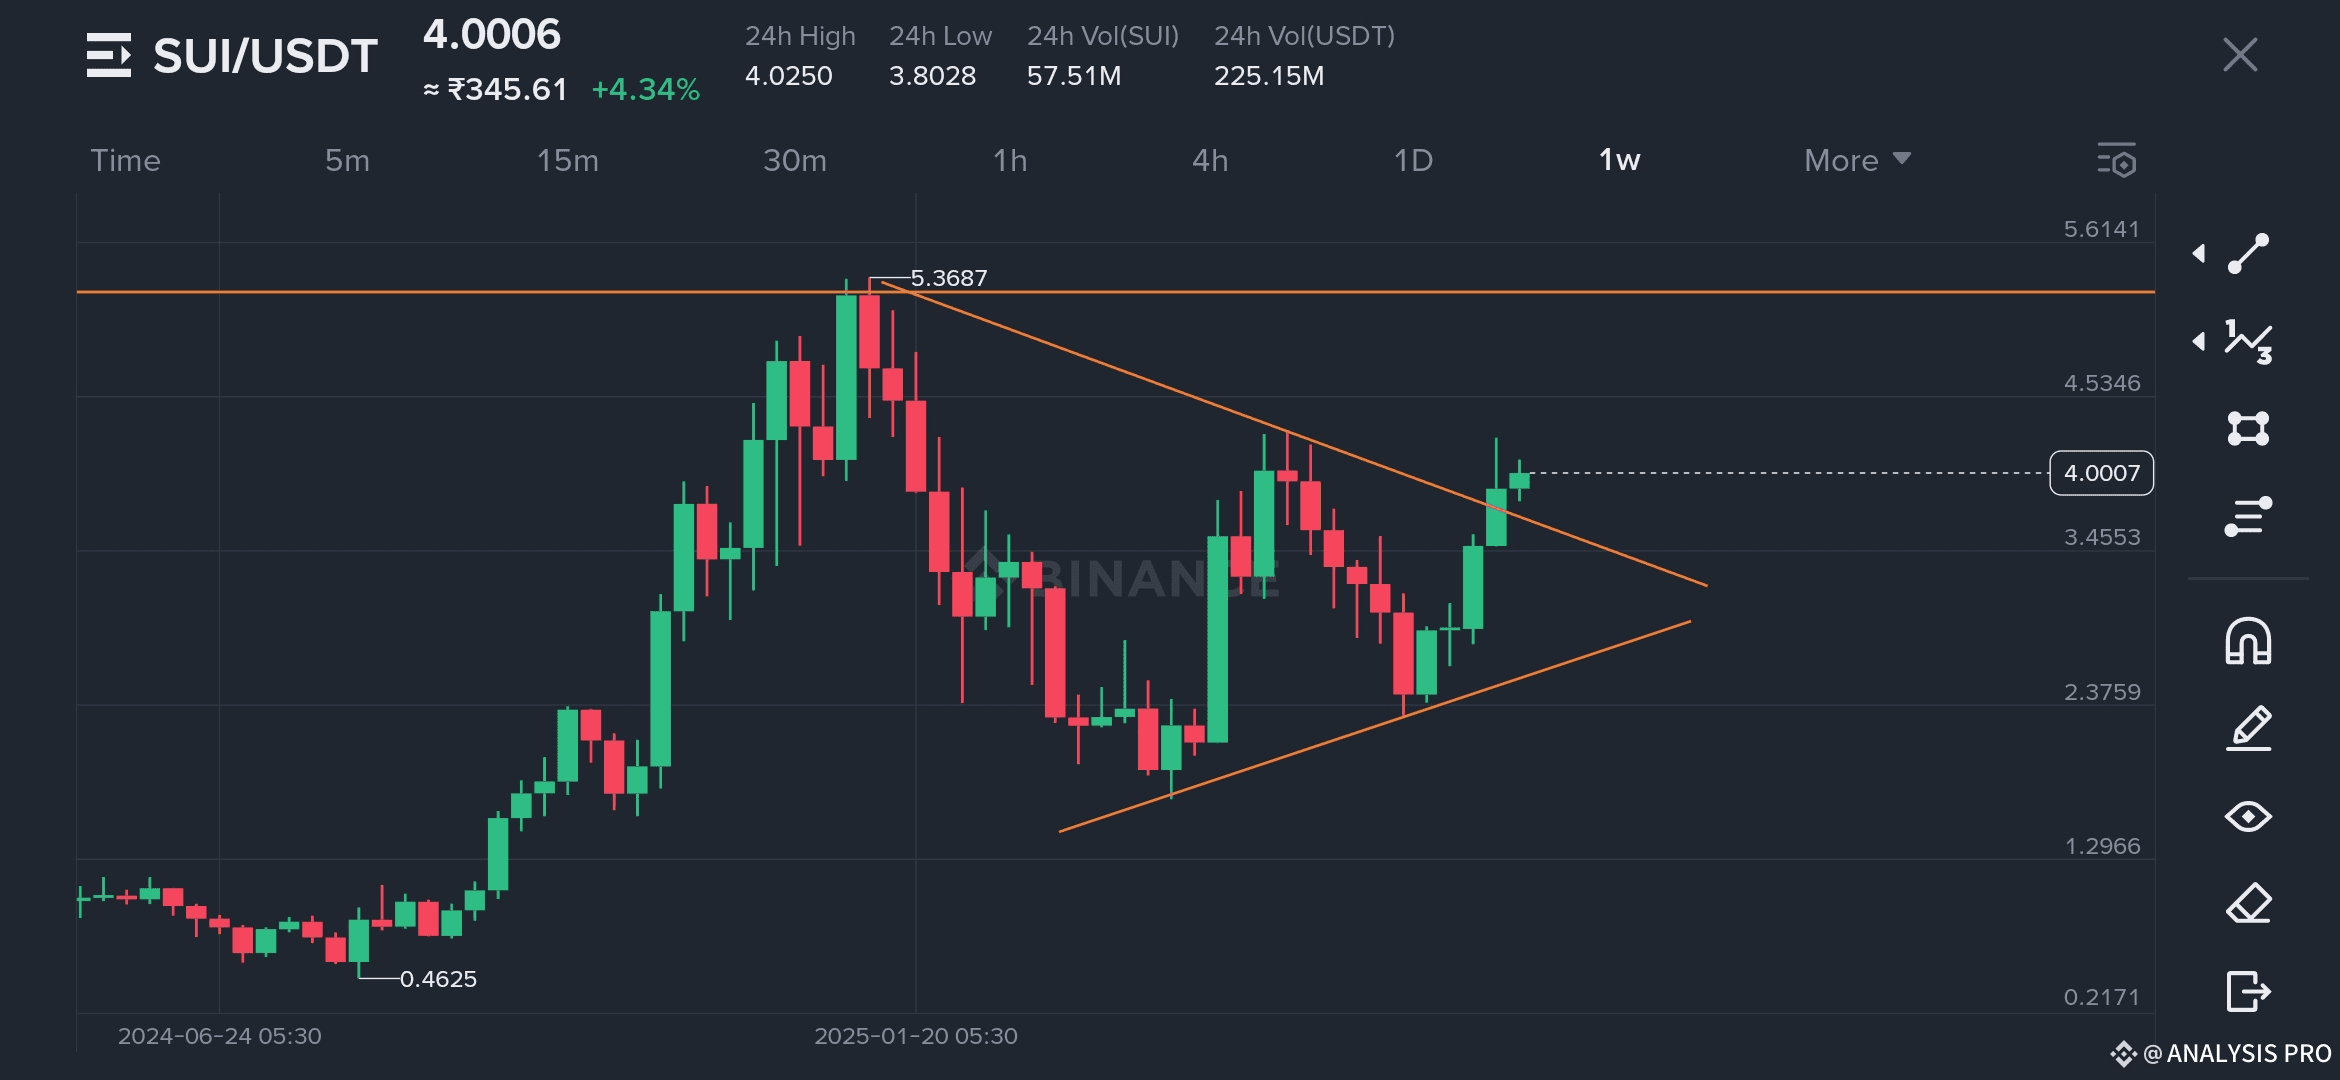
The weekly chart of SUI/USDT, shows a significant bullish breakout from a long-term symmetrical triangle pattern. This technical breakout could mark the beginning of a strong upward trend for the SUI token.
📊 Technical Breakdown
Symmetrical Triangle Pattern:
SUI has now broken out above the descending resistance line, confirming bullish intent.
Key Levels:
Resistance Breakout: Around $3.95 - $4.00
Next Major Resistance: $4.53 and then $5.36
Strong Support Zone: Around $3.45
Historical Context:
SUI has risen from a low of $0.4625 in mid-2024 to a high of $5.3687, showing massive growth.
The recent consolidation phase built a strong base between $2.37 and $3.45, giving strength to this breakout.
📈 What’s Next for SUI?
Bullish Scenario:
If buying volume continues and the breakout holds above $4.00, the token could retest $4.53 and even aim for a new high above $5.36 in the coming weeks.
💡 Conclusion
The technical chart shows that SUI is at a crucial turning point, having successfully broken out of a multi-month consolidation. With strong volume and a well-formed base, the current move could be the start of a new rally. Traders and investors should keep an eye on support retests and upcoming resistance levels.
Trade According
