

Dogecoin rallied from $0.15667 to $0.27031 in July, flipping past resistance into support and suggesting renewed bullish strength.
Major accumulation zones are between $0.056 and $0.243, supporting DOGE’s recovery with minimal resistance above $0.40.
DOGE faces key resistance at $0.36–$0.40, aligned with a long term descending trendline from the 2021 high near $0.86.
Dogecoin monthly performance in July shows a sharp rebound, with the price gaining over 63% to reach $0.27031. This recovery follows a bounce from $0.15667, suggesting renewed strength after a prolonged correction.
As per “Galaxy” on X, DOGE may be approaching a multi year trend shift, driven by historical levels of accumulation and key resistance being tested. A wide bullish monthly candle has emerged, indicating sustained buying pressure since early July.
This recovery flipped several past resistance zones into new support areas. According to chart observations, the price is now heading toward a critical descending resistance trendline. This green line originates from DOGE’s 2021 peak of nearly $0.86 and now intersects between $0.40 and $0.45.
Long Term Trendline Resistance
The descending resistance trendline has capped Dogecoin rallies since its all time high. The price is now approaching this level again. A clear monthly close above this line could suggest a potential shift in trend.
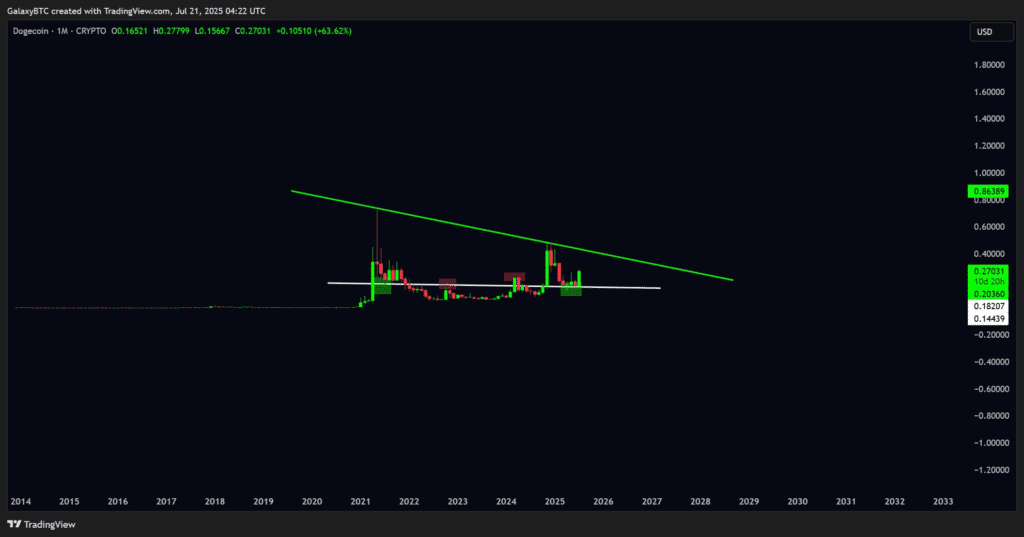 Dogecoin 1-month price chart, Source: Galaxy on X
Historical resistance has already flipped into support multiple times during this recovery, adding weight to a possible continuation. Meanwhile, the horizontal white line near $0.14439 has shown its importance.
Price recently rebounded from this area in early 2025, supporting its relevance as a strong bottom. Current movement indicates that $0.20 to $0.27 is now acting as a crucial support range.
Accumulation Seen Below Current Price Levels
The UTXO Realized Price Distribution (URPD) chart shows substantial Dogecoin accumulation between $0.056 and $0.24. The largest cluster is centered around $0.056, where more than 29 billion DOGE last changed hands.
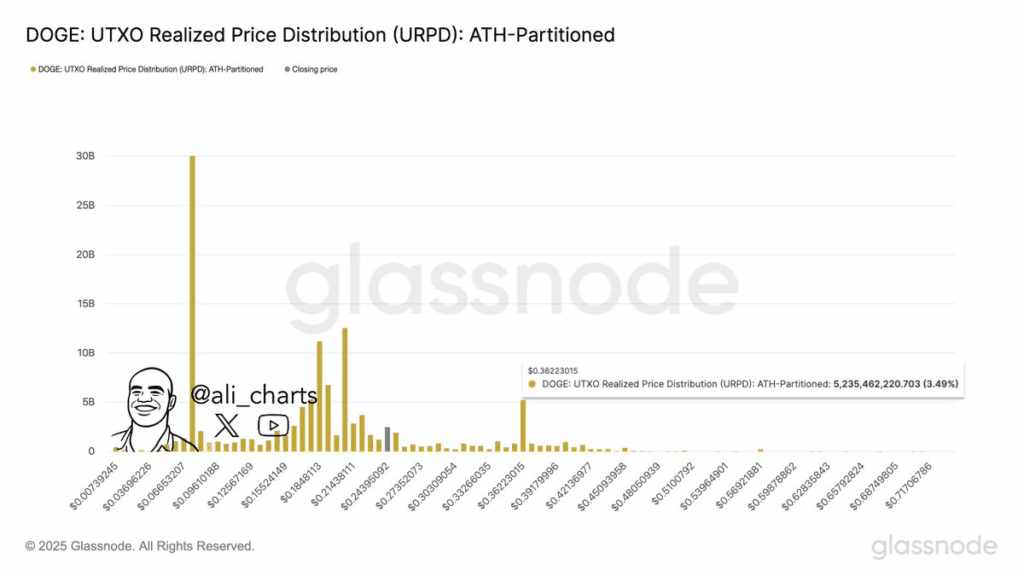 Dogecoin price dynamics chart, Source: Ali on X
This indicates strong investor interest in lower zones, which now act as solid foundational support. Additional key accumulation levels were seen at $0.102, $0.195, and $0.243, with volumes between 5 to 10 billion DOGE.
These zones support the strength of the ongoing recovery, especially with lighter realized activity beyond $0.40. Minimal volume exists between $0.40 and $0.71, implying reduced resistance in those upper levels.
Resistance Emerging at $0.36 and $0.40
Data from analyst Ali shows that the next major hurdle is around $0.36, where over 5 billion DOGE were last moved. This level represents a resistance cluster where holders may look to break even.
The intersection of the long term trendline near $0.40 adds pressure, a possible reaction zone in the near term. However, the absence of significant holder activity beyond this area may ease potential overhead resistance once cleared.
Continued holding above the $0.20–$0.27 range is essential for any sustainable breakout. Dogecoin’s July surge, together with its support structure and rising demand zones, now directs attention to the $0.36–$0.45 resistance window.
The post Dogecoin Monthly Breakout Nears As Resistance Zone Draws Closer appears on Crypto Front News. Visit our website to read more interesting articles about cryptocurrency, blockchain technology, and digital assets.
