

📊 Analysis of the HUMA/USDT asset
📍 Current status and trend:
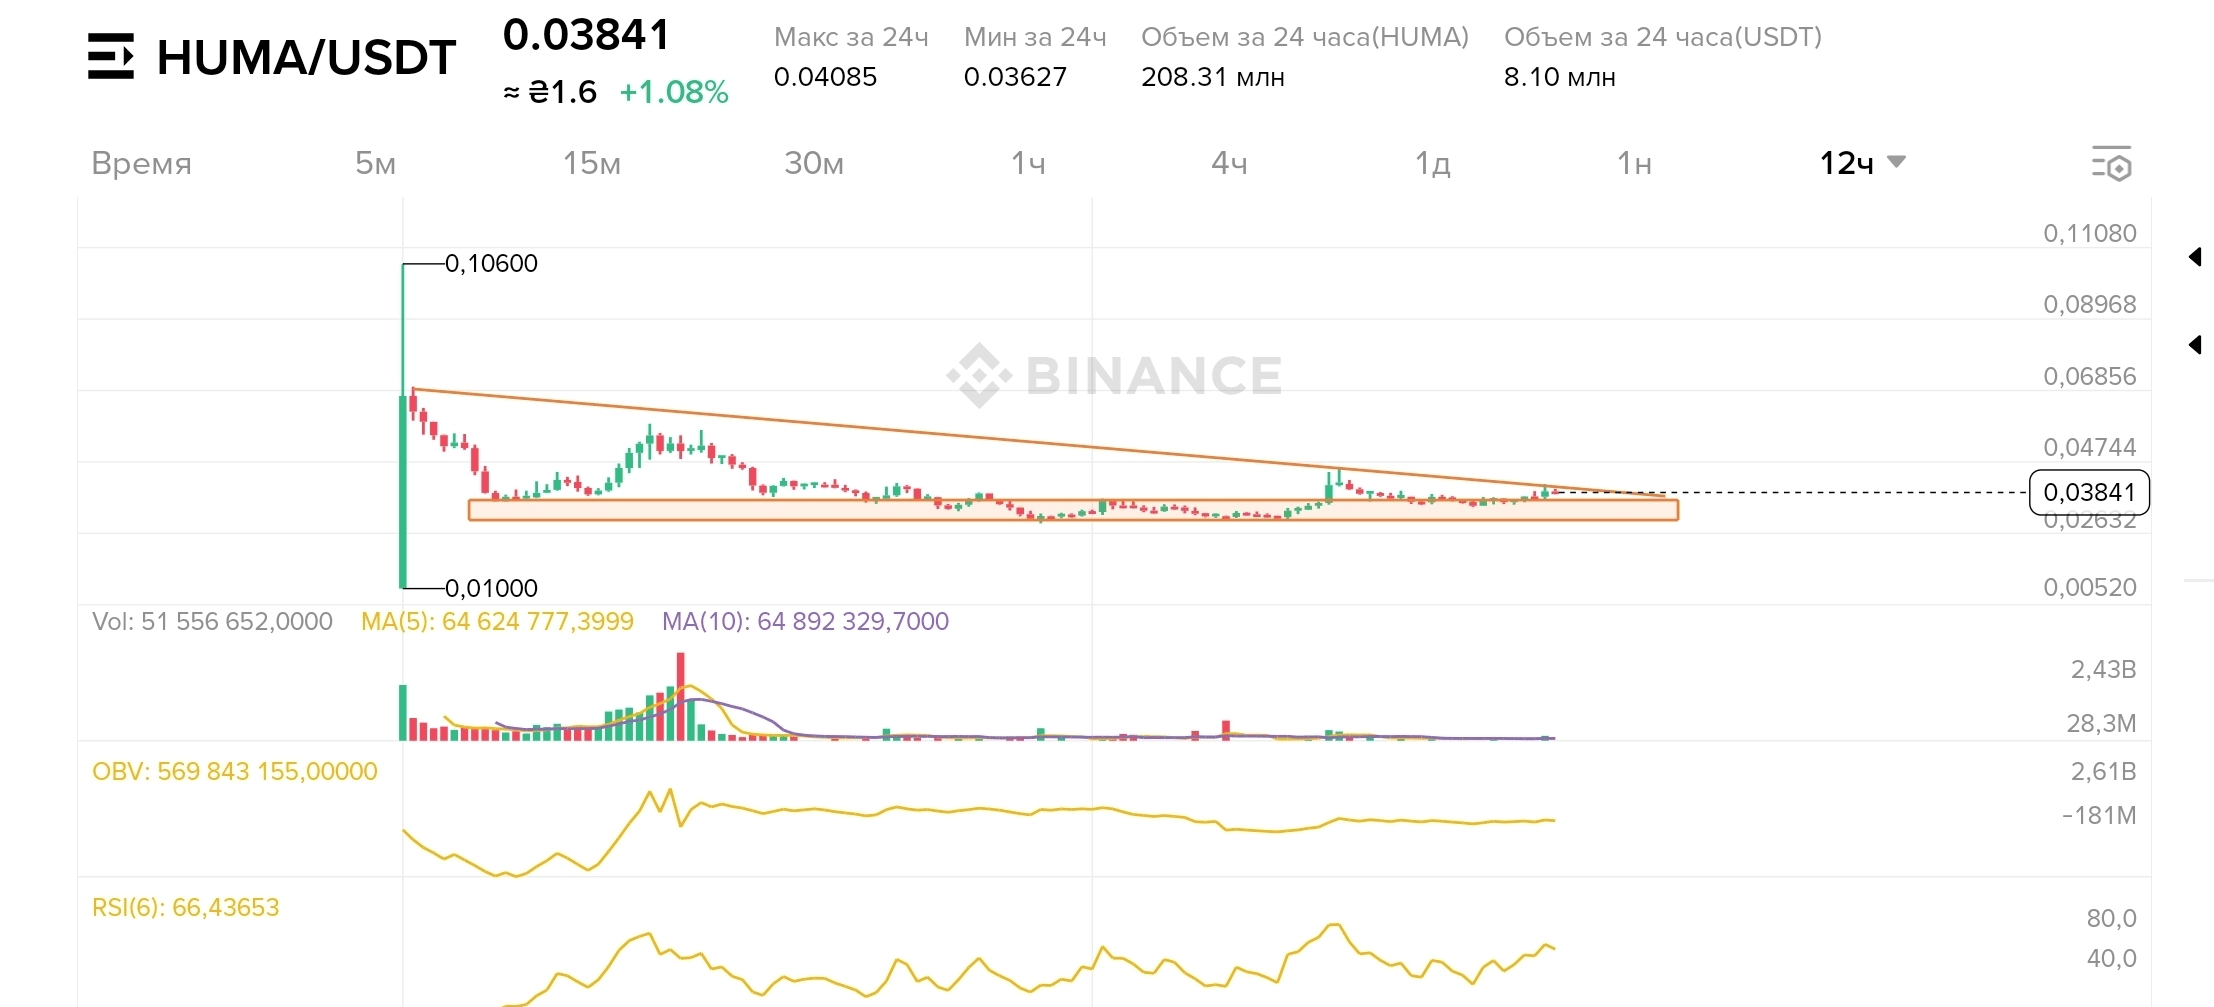
🔹 Price: $0.03841
🔹 Daily change: +1.08%
🔹 24h range: $0.03627 – $0.04085
🔹 Trading volume: 208.31M HUMA (~$8.10M)
📉 Chart analysis:
A descending triangle is forming on the chart — a classic bearish pattern. After a sharp decline, the price consolidates at the lower boundary, signaling possible further movement.
📈 Volume and indicators:
🔸 Volume decreases during consolidation — typical behavior for this pattern.
🔸 RSI(6): 66.43 — zone closer to overbought, but still within an acceptable range.
🔸 OBV remains neutral — weak support for the current rise.
📌 Development scenarios:
🔻 Bearish (more likely):
A break of the 0.035–0.03 USDT level downwards activates the pattern → possible continuation of decline.
🔼 Bullish (less likely):
A breakout through the descending resistance may signal a trend reversal.
‼️ Volume — a key trigger:
Any breakout should be accompanied by a spike in volume; otherwise, a false signal may occur.
🛡 Recommendations (not financial advice):
🔹 Watch the zones 0.035 / 0.041 USDT
🔹 Use stop losses and risk management
🔹 Study the fundamental indicators of the HUMA project

