Whether trading stocks or cryptocurrencies, Bollinger Bands are often used as a technical indicator to determine the 'entry and exit timing' of prices. After incorporating the concepts of average value and standard deviation, they can identify market price breakout points and reversal points, as well as assess conditions of overbought and oversold prices.
1. Application of Bollinger Bands indicator
1. Support and resistance indication: The upper and middle bands of Bollinger Bands exert pressure on the price, while the middle and lower bands support the price. When the price breaches the upper band, a pullback may occur. Recently, the upper and middle bands of Bollinger Bands have been exerting pressure on the price, while the middle and lower bands provide support. When the price breaches the upper band, a pullback may occur; when it drops below the lower band, a rebound may happen, reflecting overbought and oversold conditions. In cryptocurrency trading, for example, when BTC's price fluctuates wildly, touching the upper Bollinger band often leads to profit-taking and subsequent pullback pressure. Conversely, when the Bitcoin price plunges significantly to near the lower Bollinger band, some bottom-fishing capital may enter the market, driving the price up.
2. Trend judgment: Strong cryptocurrencies often trade between the middle and upper bands, while weak cryptocurrencies typically trade below the middle band. When the price line is above the middle Bollinger band, it usually indicates a bullish market, allowing for holding positions or buying; if it is below the middle band, it is generally a bearish market, and caution is advised when buying. The upper and lower bands of the Bollinger Bands represent extremely strong and weak conditions, respectively. For example, during Ethereum's bull market, the price generally remains between the middle and upper Bollinger bands, showing strong upward momentum; during a bear market, the price lingers below the middle band for extended periods, indicating a strong bearish atmosphere.
3. Signals of track changes: The narrowing of the Bollinger upper and lower bands indicates the potential for significant changes, so do not rush to enter trades. When the cryptocurrency price candlestick breaks above the upper band with volume and the channel opens upwards, it signals that the price will enter an ascending channel, prompting a buy. Conversely, if the candlestick breaks below the lower band with the channel opening downwards, it suggests that the price will enter a descending channel, necessitating a sell. For some emerging popular cryptocurrencies, when the initial volatility is small, the Bollinger band tracks may contract, but once there is a volume breakout, it often initiates significant price changes, requiring investors to make timely decisions based on the breakout direction.
4. Candlestick breakout situation: The cryptocurrency's candlestick breaks above the middle Bollinger band from below, indicating strong strength and suggesting a buy. If it breaks above the upper band from above, it shows extreme strength, possibly resulting in a significant short-term increase; hold positions for gains or buy in the short term. Certain less popular but potentially huge cryptocurrencies, when propelled by major positive news, can see the candlestick strongly break above the upper Bollinger band, causing prices to soar in the short term. Investors who can seize this opportunity will reap substantial rewards.
5. Cryptocurrency price movement above the Bollinger band: If the cryptocurrency's candlestick runs above the Bollinger band for a while and then reverses to break below the upper band, it signals the potential end of the short-term bullish trend; short-term sales should be timely, especially for those cryptocurrencies that have seen significant gains in a short time. If it breaks below the middle band, selling should be prioritized. Taking Polkadot as an example, after a rapid surge, the candlestick oscillates at a high position above the Bollinger band, and once it turns down to break below the key band, it often signals a trend reversal. Investors who do not exit in time will see their profits shrink rapidly.
The formula for Bollinger Bands is presented here with the most common parameters:
Middle band: 20 MA
Upper band: 20 MA + 2 times standard deviation
Lower band: 20 MA - 2 times standard deviation
Bandwidth (channel space): (Upper band - Lower band) / Middle band
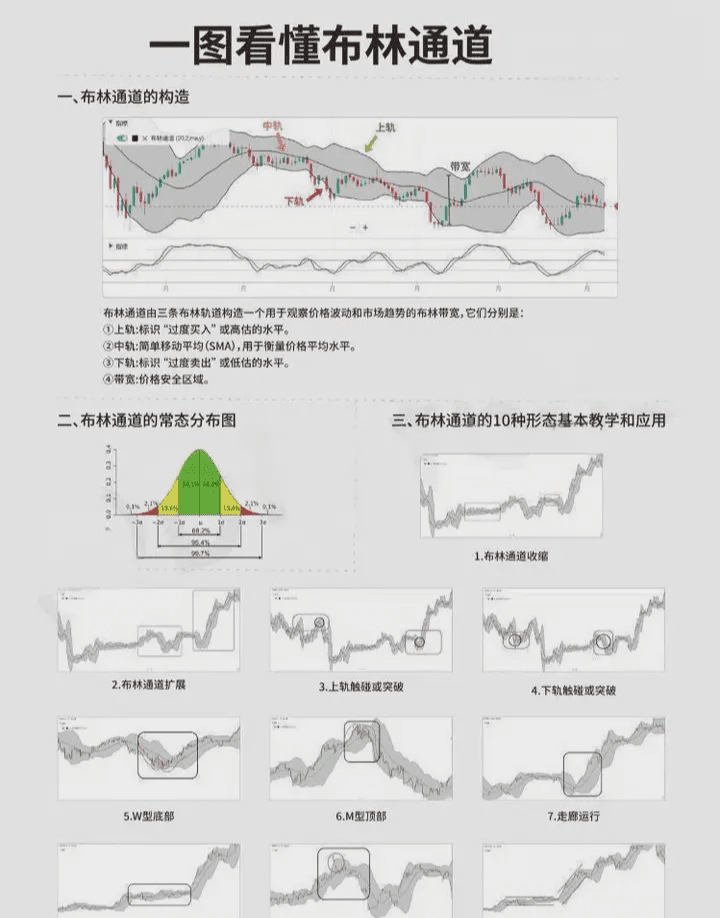
Two. The 10 basic patterns of Bollinger Bands
1. Bollinger Bands contraction
The upper and lower Bollinger bands are close together, indicating reduced market volatility and foreshadowing significant price fluctuations. In the red box of the chart, the channel contraction is often accompanied by price volatility, which investors should pay attention to.
2. Bollinger Bands expansion
The upper and lower bands separate rapidly, resulting in a significant increase in market volatility. Recently, the upper and lower bands have separated quickly, causing a dramatic increase in price fluctuations. The red box on the chart indicates that after expansion, there are significant price changes, and investors must make decisive decisions while managing risk.
3. Touching or breaking the upper band
The candlestick touches or exceeds the upper Bollinger band; the market may be overheated or overbought, but the price does not necessarily fall. High price levels indicate strong warnings, while low price levels may have upward breakout potential. Investors should make judgments based on the region.
4. Touching or breaking the lower band
The candlestick touches or breaks the lower band; the market is too cold or oversold, which does not mean the price will rise immediately. Investors should observe the region and combine indicators to judge the trend and make cautious decisions.
5. W-shaped bottom
A double bottom near the lower Bollinger band, with the second bottom slightly higher, is a bullish pattern that indicates an upward trend. Buying when the price crosses the middle band can reduce risk. The chart has examples marked with a black frame and blue color, providing opportunities for investors.
6. M-shaped top
A double top at the upper Bollinger band, with the second top lower than the first, is a bearish pattern, and the decline may be significant. Investors should be cautious about buying in such situations and consider shorting. The chart has typical examples.
7. Corridor operation
The candlestick runs along the upper or lower Bollinger band; the trend is strong but may reverse at any time. As indicated by the black frame, investors should not be careless and should set proper stop-loss and take-profit levels.
8. Bollinger reversal
The candlestick touches the bands multiple times with no trend, moving sideways within the channel. The market is in a range, and investors can engage in swing trading, buying low and selling high, adjusting strategies once the market shows direction. The chart has examples.
9. False breakout of Bollinger
The candlestick breaks above the upper band and then quickly retracts, creating a confusing illusion for retail investors, rather than a true trend. Traders must analyze multiple indicators to differentiate between 'traps' and 'opportunities'.
10. Contraction breakout
Bollinger bands contract, indicating market consolidation, which is a precursor to significant price movement. The chart shows black frames for consolidation, while red frames indicate breakout, expansion, and rising prices, prompting investors to seize entry opportunities.
Three. How to use Bollinger Bands to capture reversal and trend initiation opportunities
The Bollinger Bands signal trend changes through contraction; when a trend starts, the Bollinger Bands are in a contracted state. How can we track the emergence of a trend? This requires utilizing the opening feature of the Bollinger Bands in conjunction with candlestick patterns to make judgments in both directions. Judging the end or change of a trend is relatively straightforward, but determining the initiation of a trend is more complex.
Let's first learn the first condition: the opening of the Bollinger Bands.
The current market is in consolidation; whether it trends upward into a bull market or downward into a bear market, once the market concludes its current consolidation phase, a Bollinger Bands opening will certainly emerge. The characteristics of a Bollinger Bands opening are very clear: the upper band trends upward, the lower band trends downward, and both are expanding. This distinct characteristic is consistent in both upward and downward trends.
When the Bollinger Bands show an opening, we know that a one-sided trend is likely to arrive. So, how do we determine the direction of the trend? This requires using the second skill: the relationship between the Bollinger Bands and candlesticks. This can be divided into two points:
Firstly, when the bands open, if the candlestick is touching the upper band and moving upward, it indicates the arrival of an upward trend. Conversely, if the candlestick is touching the lower band and moving downward, it suggests the onset of a downward trend.
Secondly, if the candlestick's closing price is above the upper band and the candlestick is bullish, it indicates an ongoing upward trend; if the candlestick is bearish and the closing price is below the lower band, it indicates an ongoing downward trend.
In Chart 14, it can be clearly seen that after a downward trend emerges, the candlestick closes outside the lower Bollinger band and then continues to drop, staying close to the lower band.
Therefore, to timely discover the initiation points of trends using Bollinger Bands, two factors must be considered: firstly, the Bollinger Bands must open; secondly, in an upward trend, the candlestick's closing price will break above the upper band; in a downward trend, the candlestick's closing price will break below the lower band.
After confirming the initiation of a trend with these two points, traders can immediately enter trades in the direction of the price. If it is a downward trend, set stop-loss above the middle band; if it is an upward trend, set the stop-loss below the middle band.
If a downward trend occurs and the price remains close to the lower Bollinger band (refer to the chart), traders can hold short positions until the Bollinger Bands transition from an opening state to a contraction state. Alternatively, a more immediate exit strategy is to close short positions when the price breaks above the middle band. Following this exit strategy, we can see that it captures almost the entire bullish trend; when the price breaks above the middle band, it also signifies a trend reversal.
Although Bollinger Bands are useful, they can vary from person to person due to subjective interpretations, much like a double-edged sword. Therefore, do not rely too heavily on a single indicator. It is advisable to refer to multiple indicators to avoid being misled by one alone. However, as the saying goes, technical indicators are ultimately about 'probability'. There is no absolute certainty; it depends on whether you understand the indicators, whether you can find a way to apply them that suits you, and whether you use them consistently. Over time, you will experience the benefits that indicators can bring.
Lao Bo only engages in real trading; the team has positions available for speed.


