The MACD indicator can be used to measure cryptocurrencies and the stock market. It is an indicator derived from the concept of the moving average. In this article, I will explain the concept and application of MACD, and will also use the actual operation with Binance's tradeview picture, so that investors can refer to MACD to predict cryptocurrency prices in the future.

What is the MACD indicator?
In the previous article, we explained how to use the RSI indicator to determine the balance of long and short forces:
Binance Technical Analysis Tutorial: RSI determines the relative strength of buyers and sellers, and its difference from KD indicator
Today we will introduce the advanced application of moving average: MACD indicator.
MACD is more suitable for medium- and long-term judgment than KD and RSI. It is an indispensable analysis tool for long-term traders!
MACD, whose full Chinese name is "Moving Average Convergence & Divergence", was developed by Gerald Apple in the late 1970s. As the name suggests, MACD is an indicator derived from the concept of moving average.
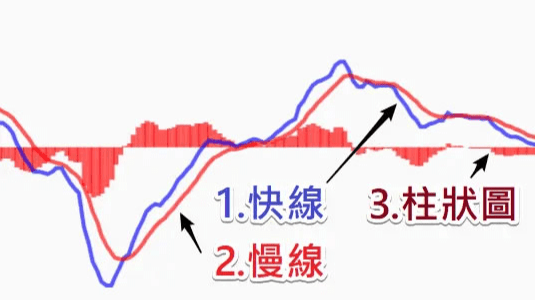
MACD has three important graphics in its settings, consisting of "two lines" + "histogram", which are explained below.
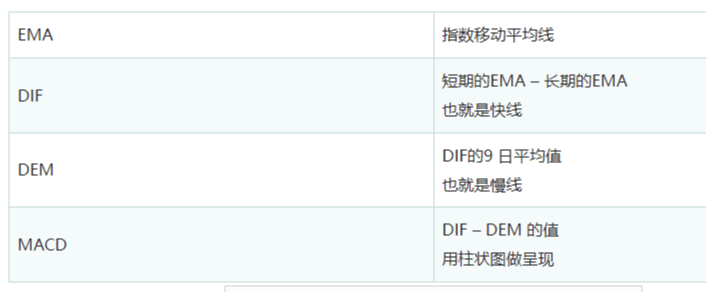
Exponential Moving Average (EMA)
In the past, the moving average we introduced in the article actually refers to the simple moving average SMA, but MACD uses EMA, which is the exponential moving average.
The difference between the two is that the weight of the data taken by the simple moving average every day is the same, but some people think that when using moving average-derived technical indicators, the influence of data closer to the present should be greater than that of data farther away, so the exponential moving average came into being.
In the exponential moving average, the exponent means that the weight decreases exponentially as time goes by, so in EMA, the importance of the data decreases exponentially as time goes by!
Although it seems troublesome, investors do not need to calculate it themselves. Most websites will calculate it for you as long as you enter the value. MACD uses two EMAs, each with a different time length, usually 12 days and 26 days.
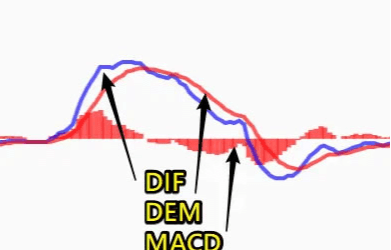
Difference value (DIF value): Fast line
The difference value DIF is calculated by the difference between two EMAs, which means "the degree to which the current short-term EMA deviates from the long-term EMA".
DIF = EMA(fast)-EMA(slow)
Connecting the daily DIF and drawing a line together will become the fast line in the MACD indicator!
Moving average of deviation values (DEM values): slow line
After calculating the DIF, take the average value of the DIF (usually 9 days), which means "the average value of the deviation between the short-term EMA and the long-term EMA."
DEM = 9-day average of DIF
This forms the slow line in the MACD indicator, which is the DEM value!
Histogram (MACD)
The histogram values are obtained by subtracting the DEM from the DIF.
If the day is positive, draw an upward bar; if the day is negative, draw a downward bar.
And these columns will form the bar chart we are familiar with.
MACD =DIF-DEM
The meaning of MACD is "the degree or momentum of recent trend changes". MACD>0 means that the recent momentum is positive and the trend is moving towards higher prices.
Here is a table to summarize the above content:
How to Read MACD
After understanding what MACD is, let us briefly explain how to judge MACD.
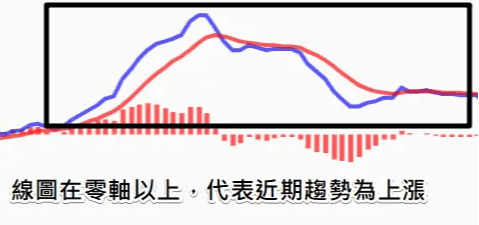
DIF and DEM line charts: used to determine trends, which will reflect prices
The line chart is composed of fast lines and slow lines, both of which represent trends.
When the line chart is above the zero axis, it means the current trend is bullish (stronger than the recent trend)
When the line chart touches the zero axis, it means that the current trend is equal to the recent trend (short-term EMA-long-term EMA=0). When the DIF (slow line) intersects and crosses the zero axis, it means that the trend has changed.
When the line chart is below the zero axis, it means that the current trend is bearish (weaker than the recent trend)
MACD histogram: used to determine momentum, which reflects the trend
The bar chart is the difference between DIF and DEM, representing the degree of recent trend change, sometimes called momentum.
When the histogram is upward, it means that the recent momentum is rising; on the contrary, when the histogram is downward, it means that the recent momentum is falling. When DIF and DEM intersect, the histogram is exactly equal to zero (DIF-DEM=0), which means that the current momentum = 0.
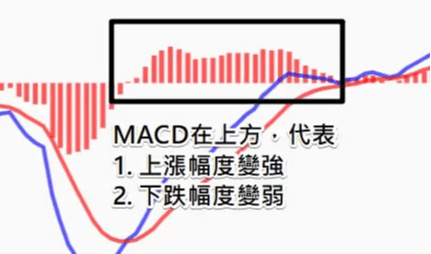
Many people may wonder: Why are the line chart and bar chart on two sides of the zero axis?
Here is my explanation:
The relationship between "line graph and bar graph" is a bit like "speed and acceleration". When the speed is positive, the acceleration may be negative, causing the speed to slow down.
Similarly, when the trend is bullish, momentum may be negative, causing the trend to slow down.
Therefore, when the line chart is at the top, the bar chart may not be at the top as well.
MACD Golden Cross and Death Cross
MACD can use crossover strategy just like KD and RSI.
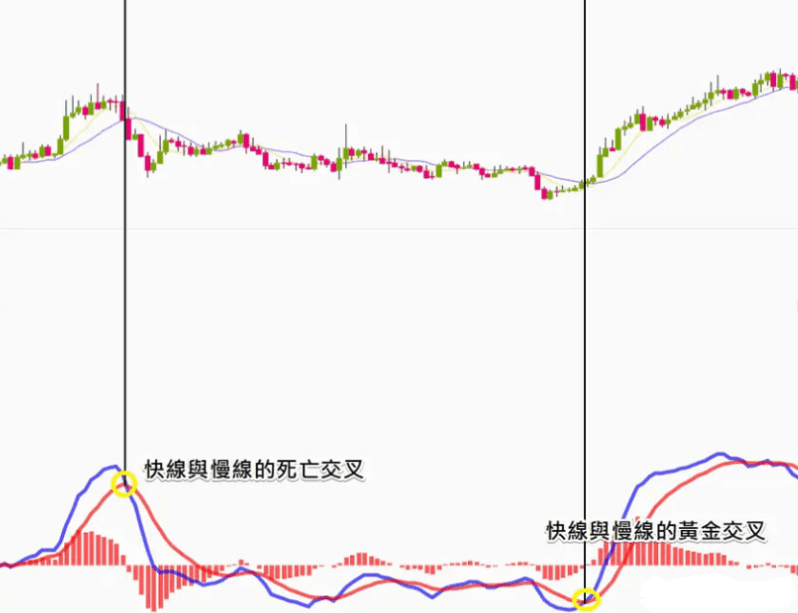
First is the intersection of the slow and fast lines:
When the fast line breaks through the slow line upward, it is a golden cross, which can be regarded as a buy signal;
When the fast line falls below the slow line, it is a death cross, which can be considered a sell signal.
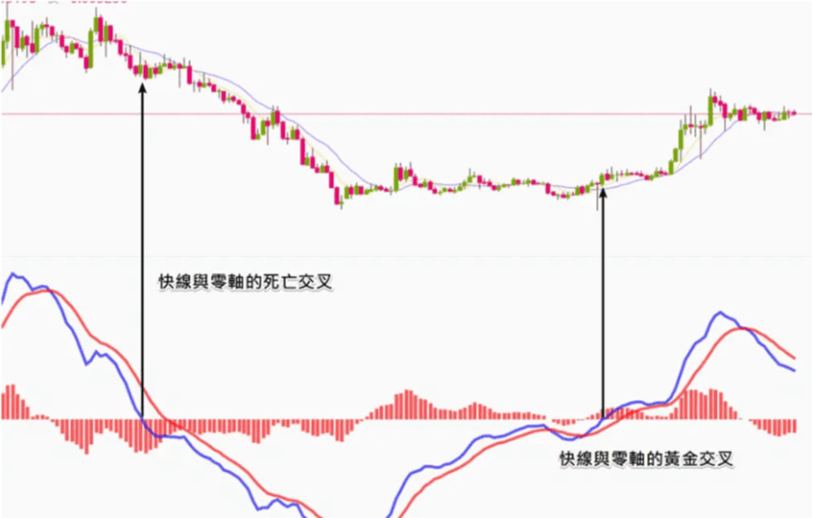
The second is the crossover of the line with the zero axis:
As mentioned earlier, the line chart represents the price trend. When the line chart is above, it means the current trend is strong; when the line chart is below, it means the recent trend is weak.
Therefore, when the line breaks through the zero axis upward, it is a golden cross, which can be regarded as a buy signal; when the line breaks below the zero axis downward, it is a death cross, which can be regarded as a sell signal.
Generally speaking, the crossing of fast and slow lines will occur faster, but it is also prone to blunting problems (signal distortion).
The crossing of the line with the zero axis does not occur often and is more suitable for judging long-term trends.
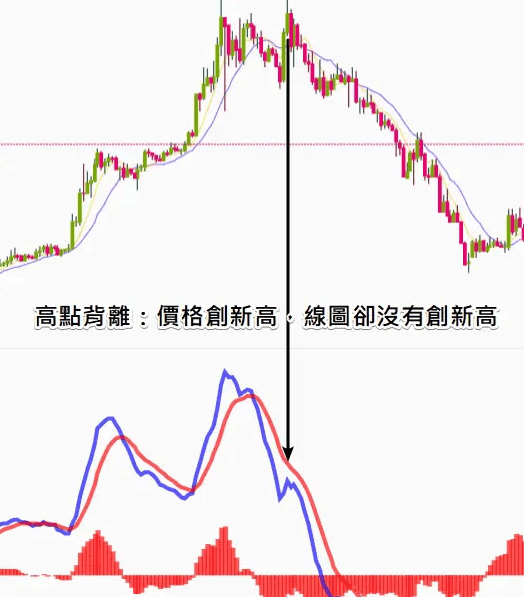
Divergence of MACD
The concept of divergence has been mentioned in technical indicators such as KD/RSI, which are generally divided into two types:
High divergence: the price hits a new high, but the indicator does not hit a new high, or the indicator hits a new high, but the price does not hit a new high; it is a sell signal. Low divergence: the price hits a new low, but the indicator does not hit a new low, or the indicator hits a new low, but the price does not hit a new low; it is a buy signal
 How to use MACD indicator on Binance Trading View?
After entering the Binance exchange, select a trading pair and enter the Trading View interface.
The following will use the BTC / USDT trading pair as an example. Follow the steps below to call out the MACD indicator:
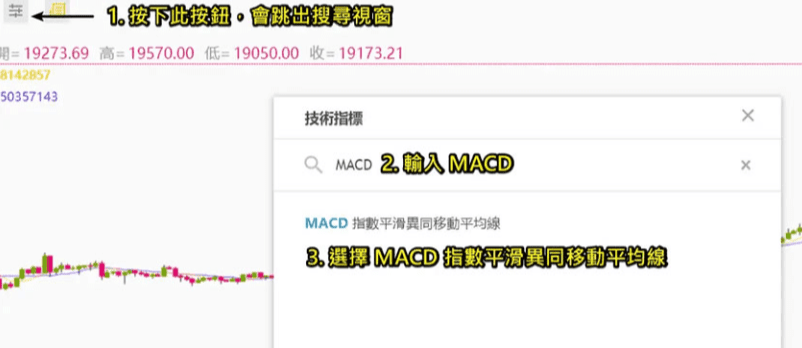
Then the system will pop up "MACD" below. Press the gear icon to set the detailed parameters.
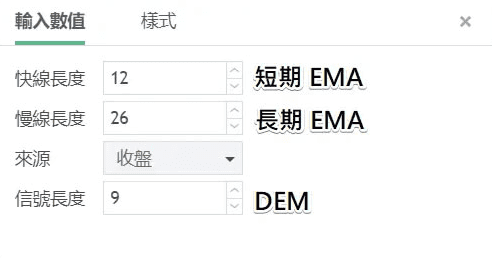
Make settings in "Input Value". Generally, we will follow the settings of the original inventor. For details, please refer to the introduction above.
Fast 12 days: This refers to the short-term EMA
Slow line 26 days: This refers to the long-term EMA
Signal line 9 days: This refers to DEM
Go back to the home page and you can see the set MACD indicator analysis located below the intraday chart.
Moving average: The average of recent prices, representing the average cost of all investors
DIF: Deviation value, which represents the degree of deviation between the recent average price and the long-term average price. When the deviation value > 0, it means that the recent average price is higher than the long-term average price, and the trend is upward; when the deviation value < 0, it means that the recent average price is lower than the long-term average price, and the trend is downward.
DEM: average of recent deviations
MACD: Deviation value - recent average deviation value. When MACD>0, it means that the current deviation is higher than the recent deviation.
MACD is a momentum or trend research indicator. It is smoothed several times based on the moving average and is suitable for medium- and long-term judgments. However, it may give wrong signals when prices fluctuate violently or change greatly. It is recommended that investors make further judgments in combination with the moving average, KD, and RSI taught before to avoid losses due to wrong signals.
Lao Bo only does real trading, the team still has positions to fill in.