A Dogecoin whale boldly bet $21.24 million in leverage after locking in millions of dollars in profit a few days ago. This was exposed by Lookonchain, sparking interest from cryptocurrency investors on the social platform X.
Meanwhile, Dogecoin has performed well over the past seven days, starting to shake off the downward trend of the third quarter.
Interestingly, the timing of this new long position is almost perfect. Lookonchain noted that the position quickly moved in a favorable direction, accumulating an unrealized profit of $1.64 million.
After reclaiming the $0.20 area earlier this month, Dogecoin's price broke through multiple resistance levels today, reaching $0.251. This move marks a significant breakthrough of Dogecoin's downtrend line since November 2024. Bulls are currently trying to stabilize the price above key structural levels.
What is the price of Dogecoin?
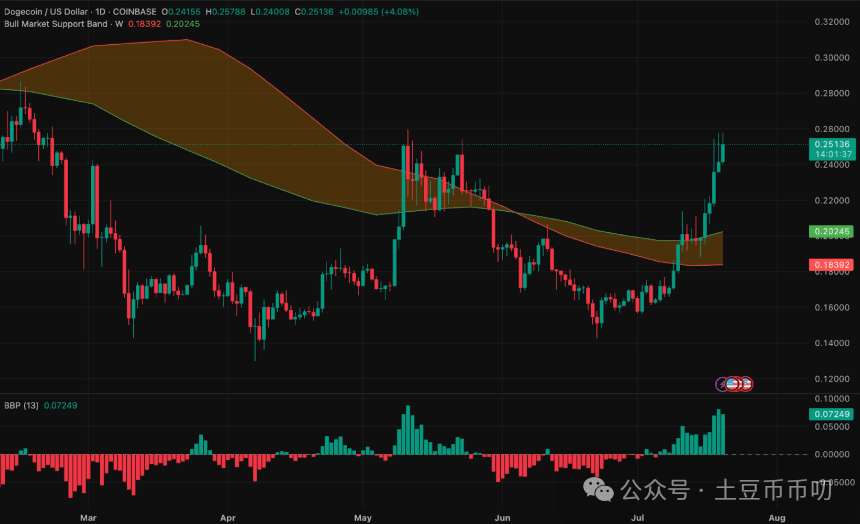
The Dogecoin daily chart shows it has broken above the long-term downtrend line, with the closing price exceeding all major index moving averages, including the 200-day moving average of $0.204. This structural change indicates that the trend has shifted, with the bullish support area from $0.1839 to $0.2024 now becoming a solid foundation.
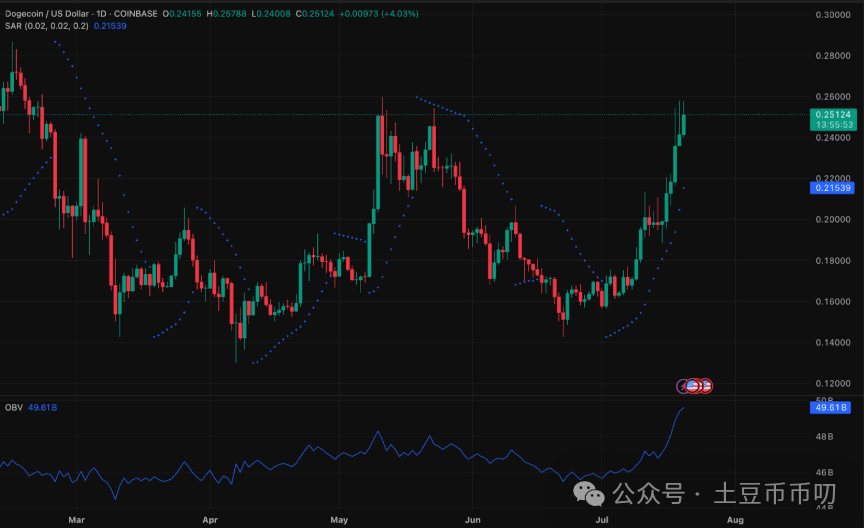
The balance of trading volume has surged to 49.61 billion, indicating strong participation behind the breakout. The parabolic SAR has also turned bullish and remains below the price, further confirming the trend direction.
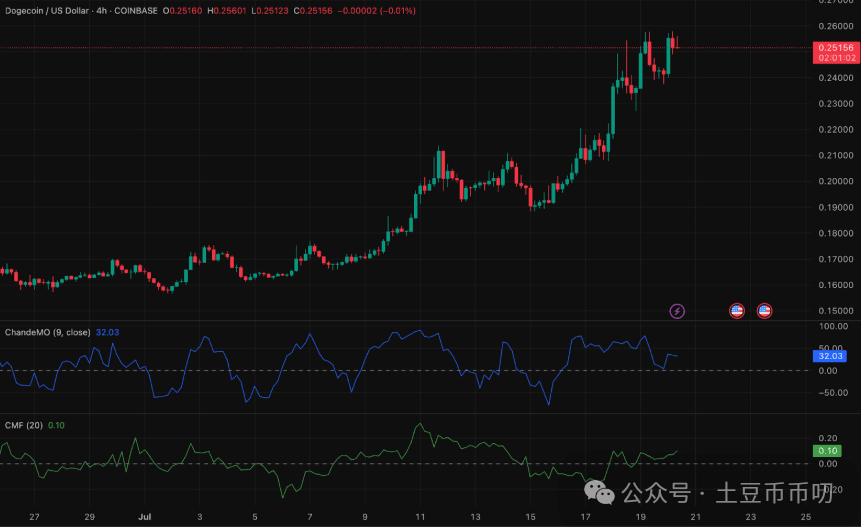
On the 4-hour chart, price movements remain high, showing no signs of a top structure. The Chande momentum oscillation indicator remains around 32, and the CMF indicator is at 0.10, reflecting healthy capital inflow. Both indicators support the continuing strength of gold prices.
Why did Dogecoin's price rise today?
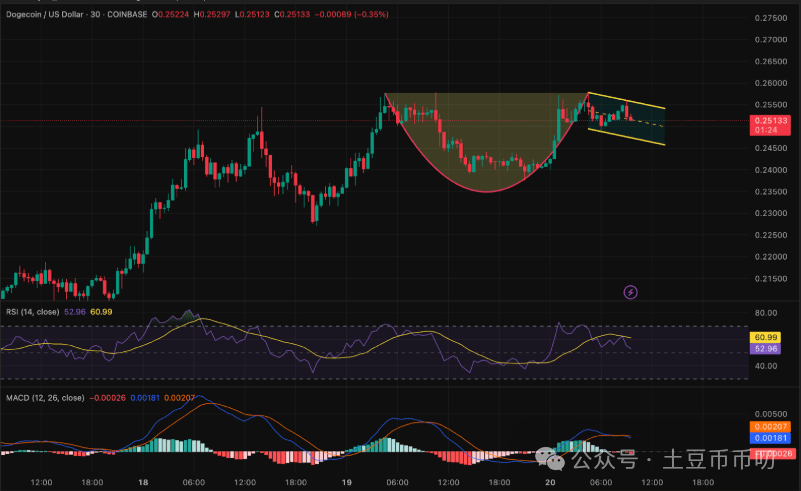
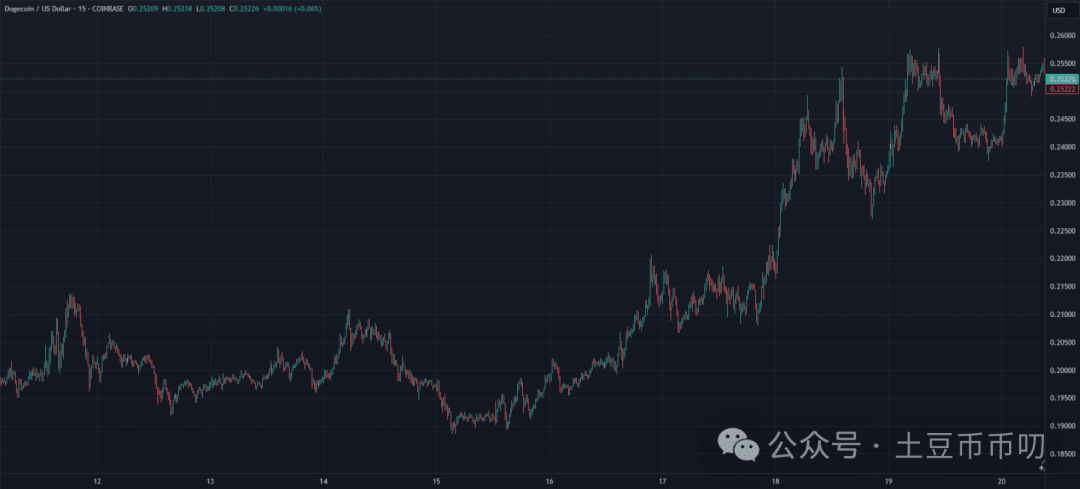
The reason for Dogecoin's price increase today can be traced back to a technical breakout and positive derivative positions. On the 30-minute chart, Dogecoin has completed a cup and handle pattern. The cup and handle is unfolding in a downward channel above the $0.250 neckline, indicating that bulls are attempting to confirm the breakout.
The MACD is flat, while the RSI hovers around 53. The lack of bearish divergence here indicates consolidation rather than reversal.
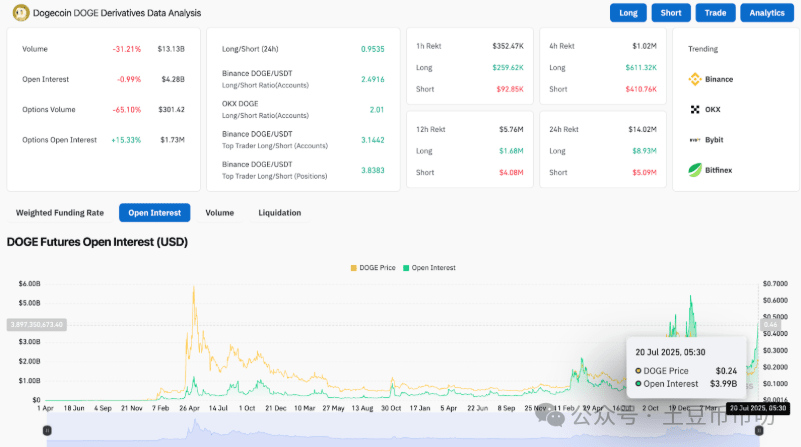
Coinglass data shows that Binance's long-short ratio is heavily tilted towards bulls, with the top traders' long-short ratio at 3.83, and over $8.9 million in long liquidations in the past 24 hours. Despite a 31% drop in trading volume, open interest remains high at $4.28 billion, indicating the commitment of leveraged buyers.
Volatility and momentum indicators support further upward movement
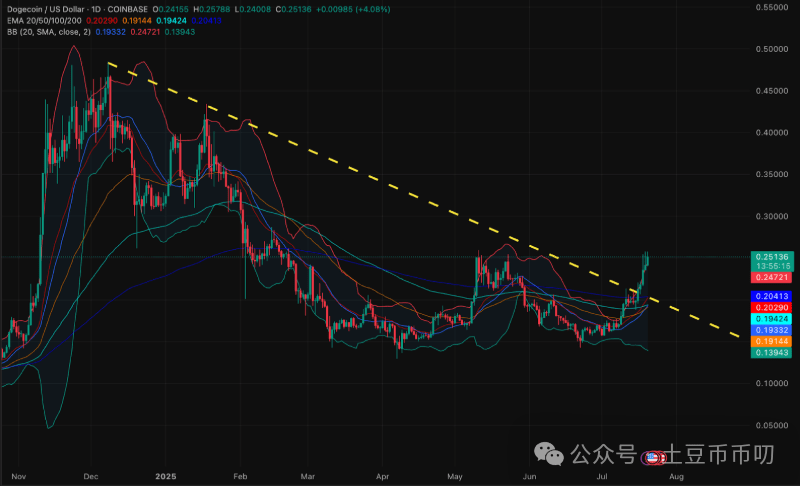
The Bollinger Bands on the Dogecoin daily chart are rapidly expanding, with the price breaking above the upper band at $0.257 and maintaining above the 20-day moving average ($0.204). Breakout volatility usually continues in the same direction, with all four major EMAs below the price and overall sloping upwards, enhancing bullish expectations;
If it remains above $0.245 in the short term, the breakout is valid, and confirming a breakout at the $0.258 resistance level may lead to a move towards the previous high of $0.275. Losing control of the $0.242-$0.245 range could pull back to $0.232, with the 200-day EMA ($0.204) as the last line of defense. The trend on July 21 was supported by trading volume, derivative sentiment, and momentum indicators that leaned positively.


