The cooling of Bitcoin may unexpectedly drive other markets forward.
Recently, Shiba Inu (SHIB) has strongly broken through the 200-day Exponential Moving Average (EMA), marking one of the most structurally significant technical breakouts in recent months. This breakout is not only significant in terms of technical indicators but may also signify a deep change in the market structure of this asset. For long-term holders and experienced traders, this trend has already transcended a mere technical rebound.
For a long time, the 200-day EMA has been regarded as a core indicator for measuring market bullish and bearish trends. Since the beginning of 2024, SHIB has made multiple unsuccessful attempts to break above it and has continued to oscillate below this moving average, making it a major pressure line limiting price rises. However, SHIB has now clearly broken through the range of $0.00001450 to $0.00001500 and is operating steadily above the 200-day EMA, indicating that a new rising phase may be unfolding, presenting significant benefits for the bullish structure.
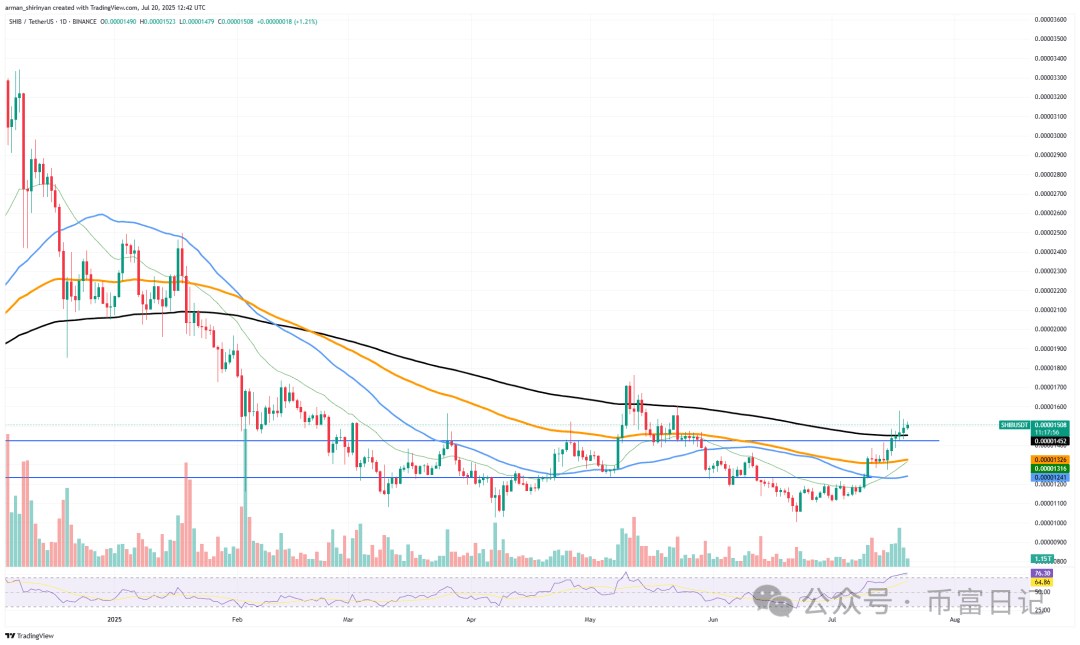
This breakout has received strong support from trading volume, not driven by a lack of liquidity. Daily trading volume has significantly increased, synchronizing with the price rise, providing a solid foundation for this upward movement. Additionally, the RSI has risen above 75, indicating strong market momentum, but there is a possibility of a technical pullback in the short term.
This trend signifies that SHIB has entered a new technical phase. Investors should focus on the two critical support ranges at $0.00001326 and $0.00001452, the latter located at the intersection of previous resistance and short-term moving averages. If SHIB can successfully retest the 200-day EMA and gain support, it is likely to confirm the upward trend and further challenge potential targets of $0.00001650 and above.
It is worth emphasizing that this breakout is not a fleeting speculative surge or emotionally driven hype, but rather a structurally significant change. SHIB has firmly stabilized above the 200-day EMA for the first time since a long-term downtrend, showing that technicals are continuously improving. If the price can stabilize above this key moving average, it may open up a new medium-to-long term bullish cycle rather than a fleeting rebound.
XRP touches the sky.
Now, XRP has officially entered uncharted territory, and the upward momentum remains strong. XRP is currently in an open state with almost no historical resistance levels, having broken through the key resistance level of $2.80 and maintaining above $350. Given the market structure, expanded trading volume, and strong momentum, the $5.00 level is gradually becoming a more realistic short to medium-term target.
Technicals show that XRP price has strongly broken through all key moving averages, currently standing firmly above the 50-day, 100-day, and 200-day averages, highlighting the strength of the ongoing trend. The RSI is currently stable around 85, in the overbought territory, which suggests short-term adjustment risks, but also reflects that strong market momentum continues.
While such a steep rise is uncommon, in the crypto market, especially when there is almost no obvious resistance above, such vertical breakouts are not rare. According to the current price pattern, XRP is in a clear upward channel, oscillating upwards around $3.50. The lack of dense supply pressure, combined with soaring market sentiment and the spread of FOMO effects, means that there is still room for further gains before a substantial pullback occurs.
Volume data further confirms the validity of this rise. The breakout on increased volume demonstrates that real demand exists, and the price increase is not driven by low liquidity. Additionally, XRP's strong performance aligns with the overall strengthening trend of high-market-cap altcoins, indicating that this round of increase has a strong systemic background.
Currently, XRP's biggest advantage lies in its 'absence of an overhead resistance area.' If the current market sentiment persists without encountering negative shocks from the macroeconomic or regulatory fronts, XRP not only hopes to continue rising but the possibility of reaching the $5.00 mark is steadily increasing.
Bitcoin sits down.
The unstoppable rise of Bitcoin has finally paused. After briefly breaking through the $120,000 threshold, Bitcoin has entered a cooling phase, indicating that the market is in urgent need of a breather. Previously, Bitcoin experienced a brief and strong rise, increasing by over 25% within just a few weeks.
The technical resistance level close to $120,000 is not surprising. Such psychological price levels have historically been important resistance points, especially after such a sharp rise. Bitcoin shows a slight pullback candlestick on the daily chart, indicating local weakness. The current price is around $117,500, consolidating above the rapidly fluctuating 9-day moving average, while remaining above the 21-day moving average without dropping.
Overall, Bitcoin bulls still dominate the market, but the upward momentum has clearly slowed down. After the previous strong breakout, trading volume has begun to shrink, indicating a weakening of buying power. The current RSI remains in the overbought territory (around 67); although the trend has not reversed, the market may need a momentum correction to gather strength for another rise.
The key support level is at $113,500, which was previously an important resistance level and has now turned into the first line of defense in the current pullback. If this level is lost, the market may test the 50-day moving average or lower at the $109,000 area. However, this pullback should not be interpreted as a trend reversal but rather as a typical technical correction, a healthy consolidation after a sharp rise.
The overall structure of Bitcoin remains strong, with long-term technical indicators (especially the 200-day moving average) still steadily rising, indicating that the main trend has not changed. The current trend resembles a 'resting period' within the upward cycle— even the strongest rallies need a brief cooling-off to regain strength.
In short, Bitcoin is undergoing a phase of consolidation, and the rebound has not ended; it is just waiting for the next opportunity to hit a high point.


