Bitcoin's correction has ended, but it may push down altcoins

Given the rapid weakening of market momentum, SHIB may face severe downward risks. After briefly breaking through the key resistance level of $0.000015, the price quickly reversed, with a daily decline of more than 5%, indicating that selling pressure is intensifying.
Currently, the most notable aspect is the relationship between SHIB and the 200-day moving average. The price is currently just above this average, and if it continues to decline and breaks below this key long-term technical support, it may trigger panic among bulls, leading to a deeper pullback. Technically, the 200-day moving average is seen as an important watershed for bullish and bearish trends; once breached, it may signal a mid-term trend reversal from bullish to bearish.
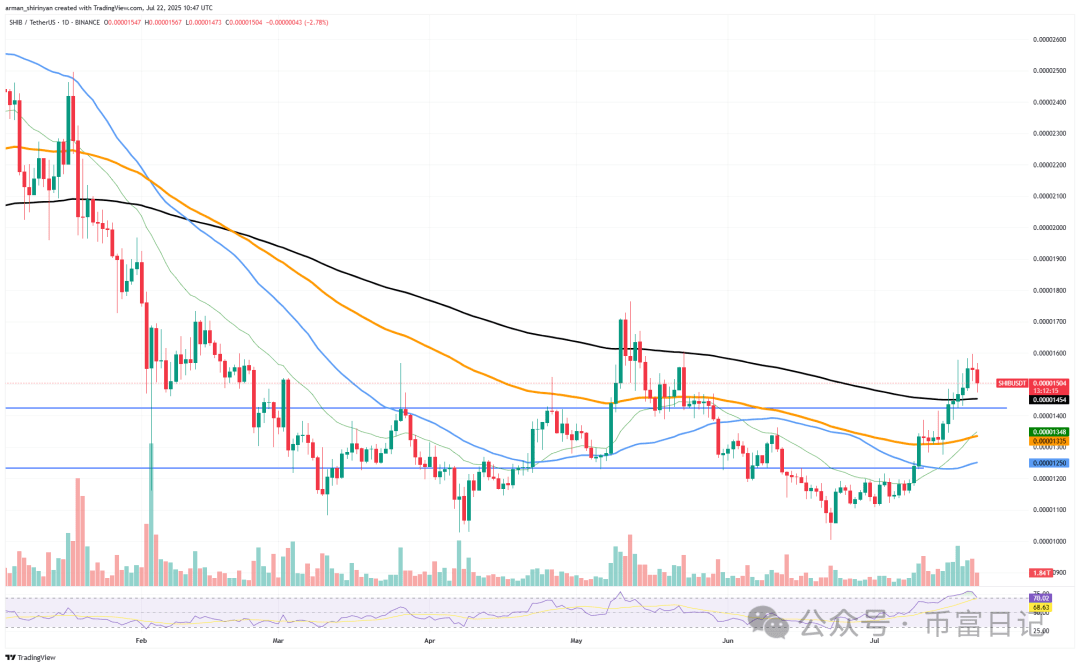
A breach of this price level indicates a bearish reversal, or at most, a prolonged consolidation. Volume data raises more questions. After the initial breakout, bullish volume declined, indicating that buyers are not maintaining consistent interest. Sellers are regaining control without new demand to sustain the upward trend.
Moreover, the RSI indicator shows that the recent upward trend has become overheated, and as the indicator retreats from the overbought area, the risk of further decline is increasing. Technically, the next key support level is around $0.000014, while stronger buying demand is concentrated at $0.0000135, provided that SHIB falls below the 200-day exponential moving average (EMA). Once these key levels are breached, a large number of stop-loss orders in the market may be triggered, exacerbating the selling.
If bulls fail to actively intervene in the short term, defend key moving averages, and reignite upward momentum, the current rebound may abruptly stop. While the upward trend of the past few weeks has been encouraging, a lack of sustained support could quickly erase recent gains. SHIB has little time left for bulls to stabilize the situation.
Ethereum will not give up
Technical signals are starting to flash red, suggesting that Ethereum's recent parabolic rise may be coming to an end. The daily decline for ETH exceeds 2%, and after breaking the $3,900 peak, it is currently experiencing a significant drop. A slight pullback after a surge is normal, but the accompanying drop in trading volume is more concerning. In an uptrend, increasing or at least stable volume usually indicates a healthy upward trend.
However, after Ethereum broke through its highs, the trading volume has continued to decline, indicating that buying momentum is weakening. In the absence of effective trading volume support, even a slight profit-taking could quickly evolve into a deeper pullback. From the chart, ETH may be forming a local top. Recently, multiple candlesticks have shown long upper shadows, which is a typical signal of bulls attempting to push higher but failing.
Combining with the RSI indicator trends, although it is still close to the overbought area, there are obvious signs of a pullback, suggesting that the market may enter an adjustment phase. Looking ahead, $3,000 is a key support level, which was previously a strong resistance; while $3,682 is also an important reference level. A drop below $3,600 could trigger a larger-scale correction.
Although ETH appears stable on the surface, its current technical structure has revealed signs of fatigue. Decreasing volume indicates that market enthusiasm is waning, and price movements reveal a depletion of upward momentum. If bulls fail to regain control in a timely manner, Ethereum's upward trend may end prematurely, with potential declines even matching previous gains.
Bitcoin will not give up
Bitcoin seems poised for a critical breakthrough, which could rewrite the market's short-term expectations for this leading asset. After approaching the $120,000 mark, BTC entered a mild correction phase—some are concerned this move may lead to a deeper pullback.
However, since then, Bitcoin's trend has gradually stabilized and begun to show upward momentum. From the chart structure, it currently presents a typical bullish consolidation pattern, with prices rebounding several times near the short-term support level, while forming a downward trend line near local highs, creating a shape similar to a descending wedge—this structure tends to break upwards in most cases. If this pattern is confirmed, BTC is expected to challenge the key resistance area of $120,000 earlier than the market expects.
Compared to the weakening signs starting to show in Ethereum and other major assets, Bitcoin's adjustment is significantly smaller. Although momentum indicators like the RSI have receded, they have not yet entered a clearly bearish zone, leaving room for subsequent rebounds. Meanwhile, the 21-day moving average continues to provide effective support. Despite a short-term market pullback, overall trading volume remains stable without significant expansion, indicating that bears have not yet taken control, and the market is still in a relatively healthy consolidation phase.
As long as the price remains above the range of $114,000 to $116,000, the bullish structure is valid. If Bitcoin can break through the downward trend line and stabilize above $120,000, it may trigger a new round of FOMO-driven buying.


