1. Basic Composition of Candlesticks
- Core Price:
- Opening Price: The first transaction price at the beginning of the trading day.
- Closing Price: The last transaction price at the end of the trading day.
- Highest Price: The highest transaction price that occurs within the trading day.
- Lowest Price: The lowest transaction price that occurs within the trading day.
- Three Parts of a Candlestick:
- Upper Shadow: Located at the top of the candlestick, it represents the price range between the highest price and the closing price (or opening price, depending on the candlestick's color).
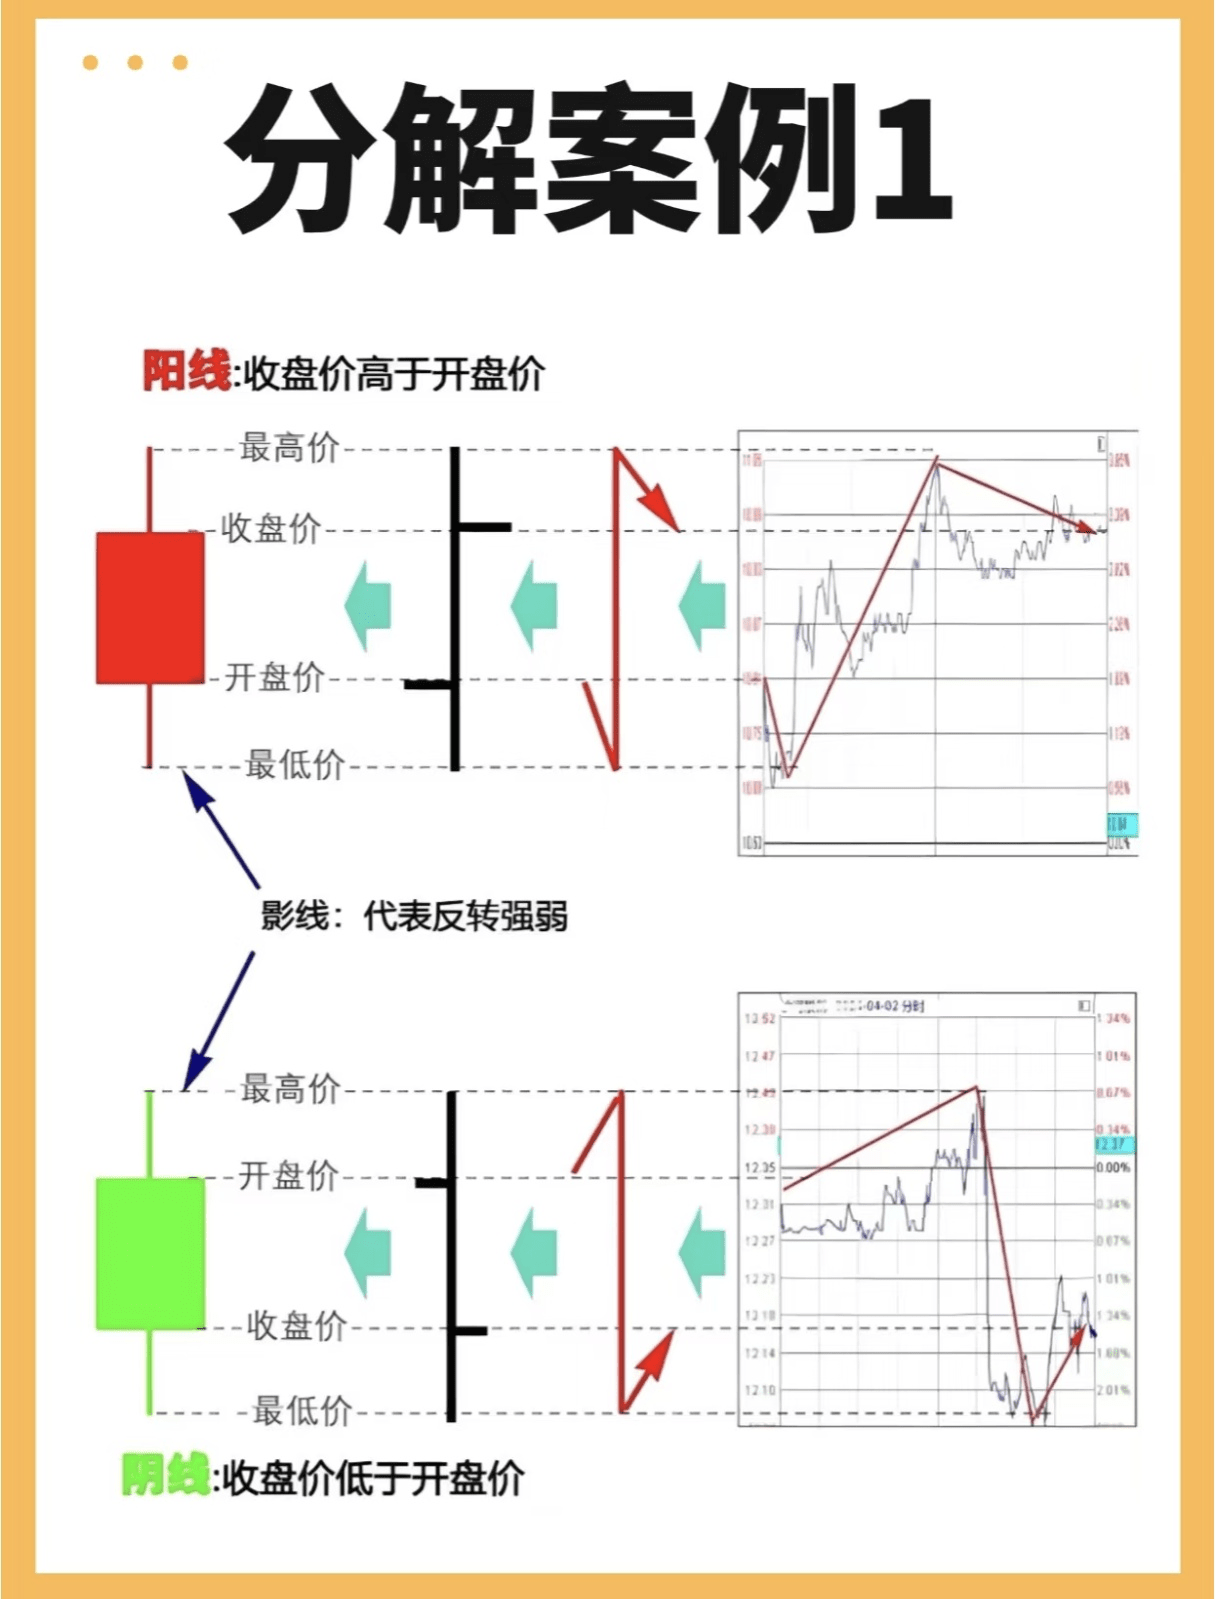
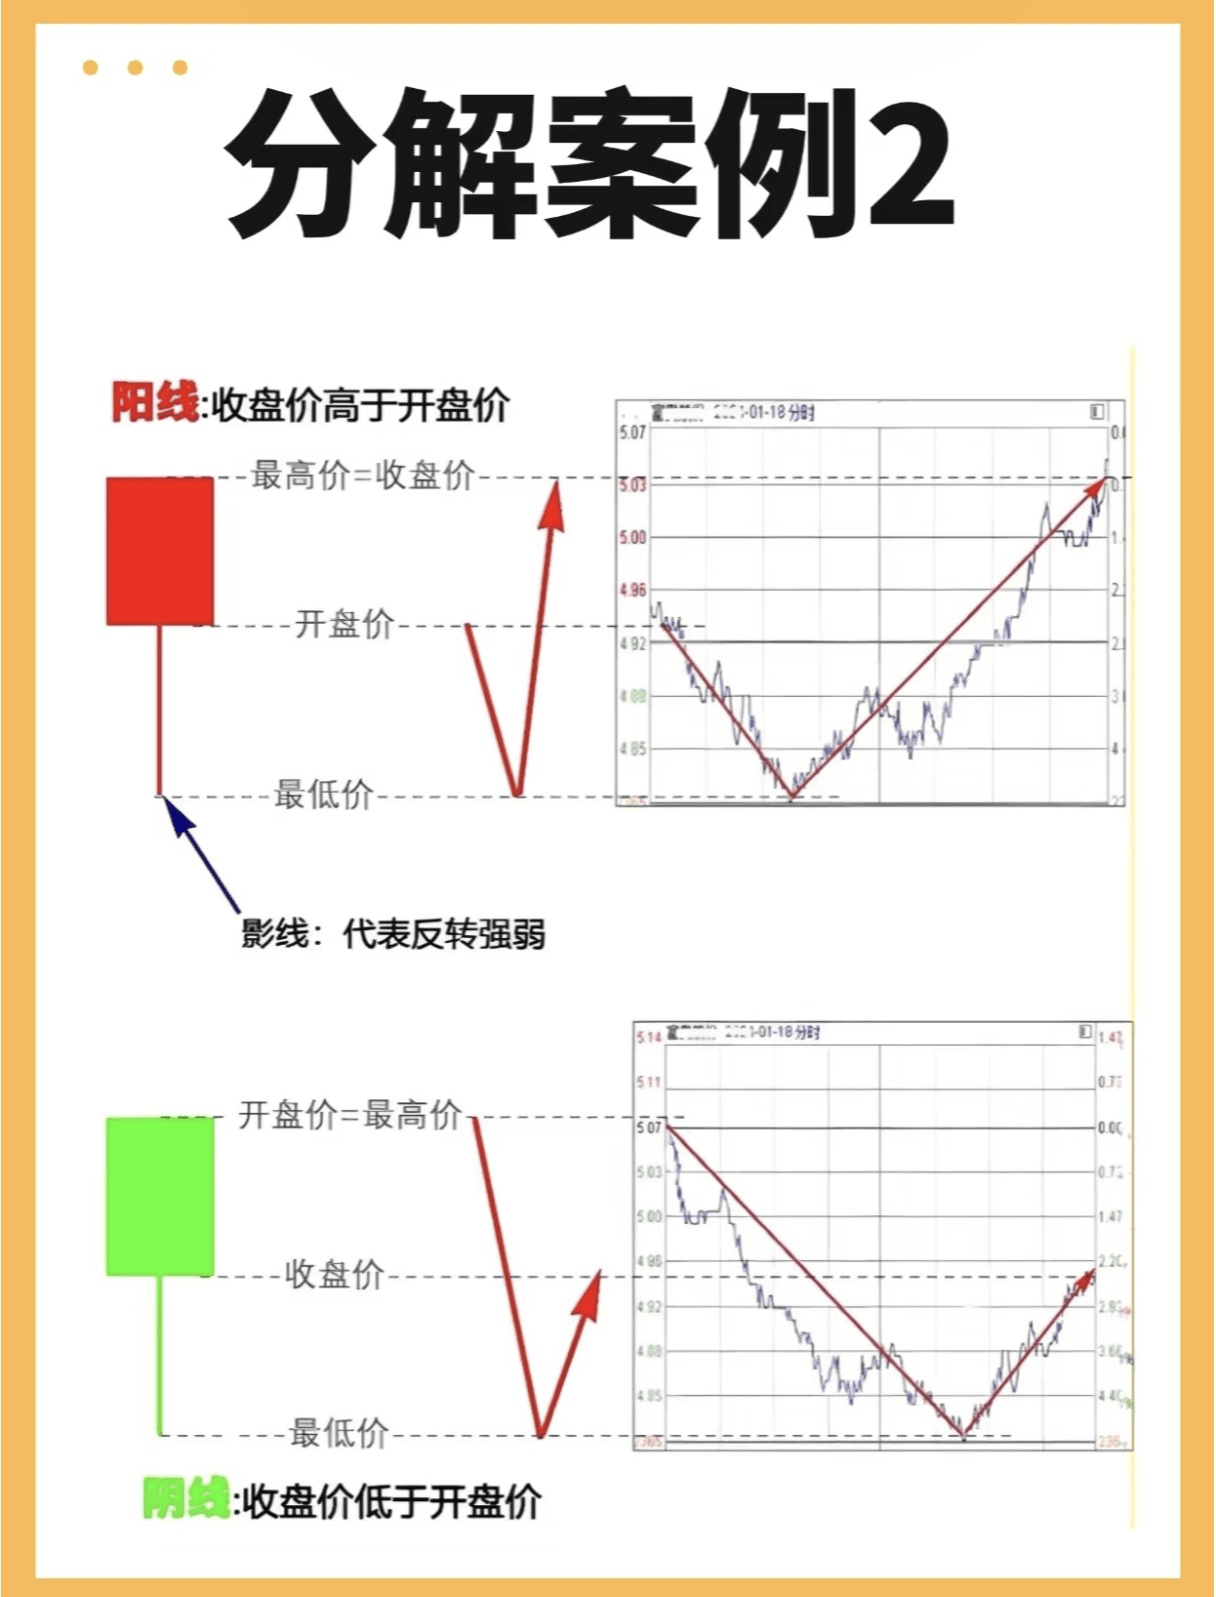
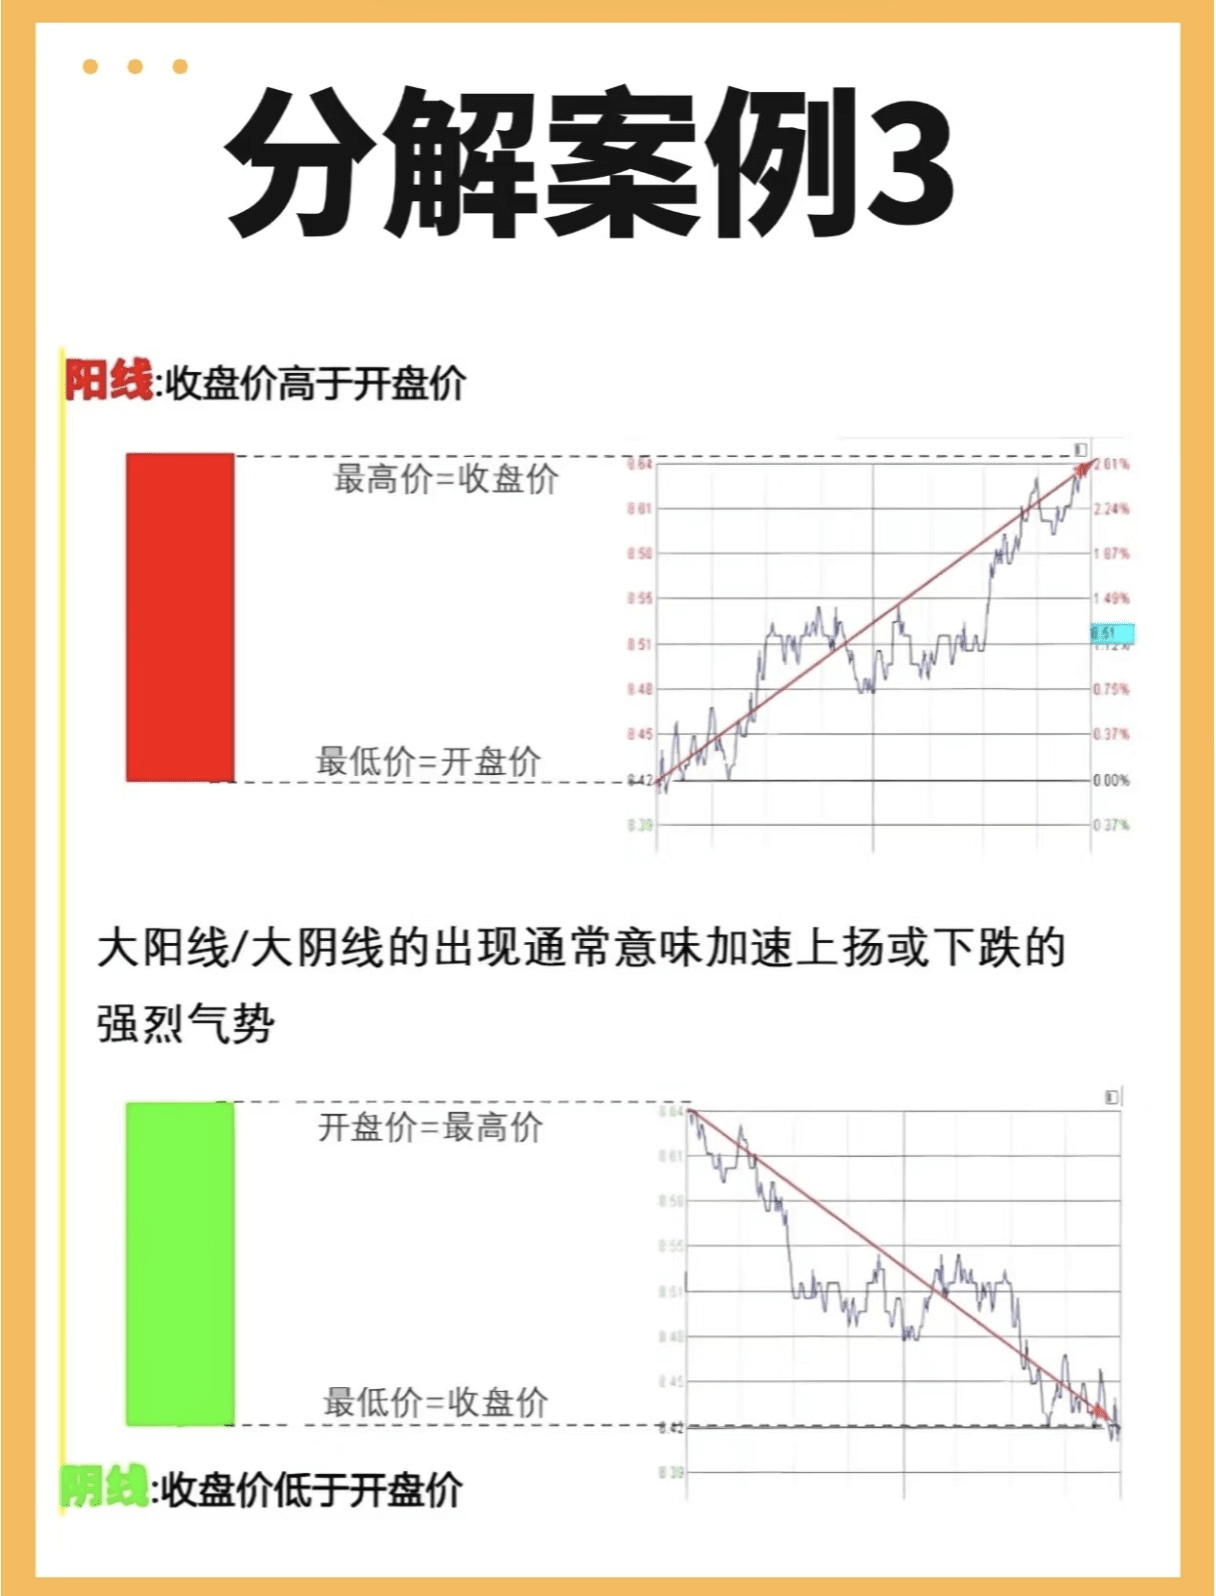
- Body: The bar section connecting the opening price and closing price. A bullish candle (red or white) indicates that the closing price is higher than the opening price, while a bearish candle (green or black) indicates that the closing price is lower than the opening price.
- Lower Shadow: Located at the bottom of the candlestick, it represents the price range between the lowest price and the opening price (or closing price, depending on the candlestick's color).
2. Methods for Interpreting Candlesticks
1. How to interpret a single candlestick?
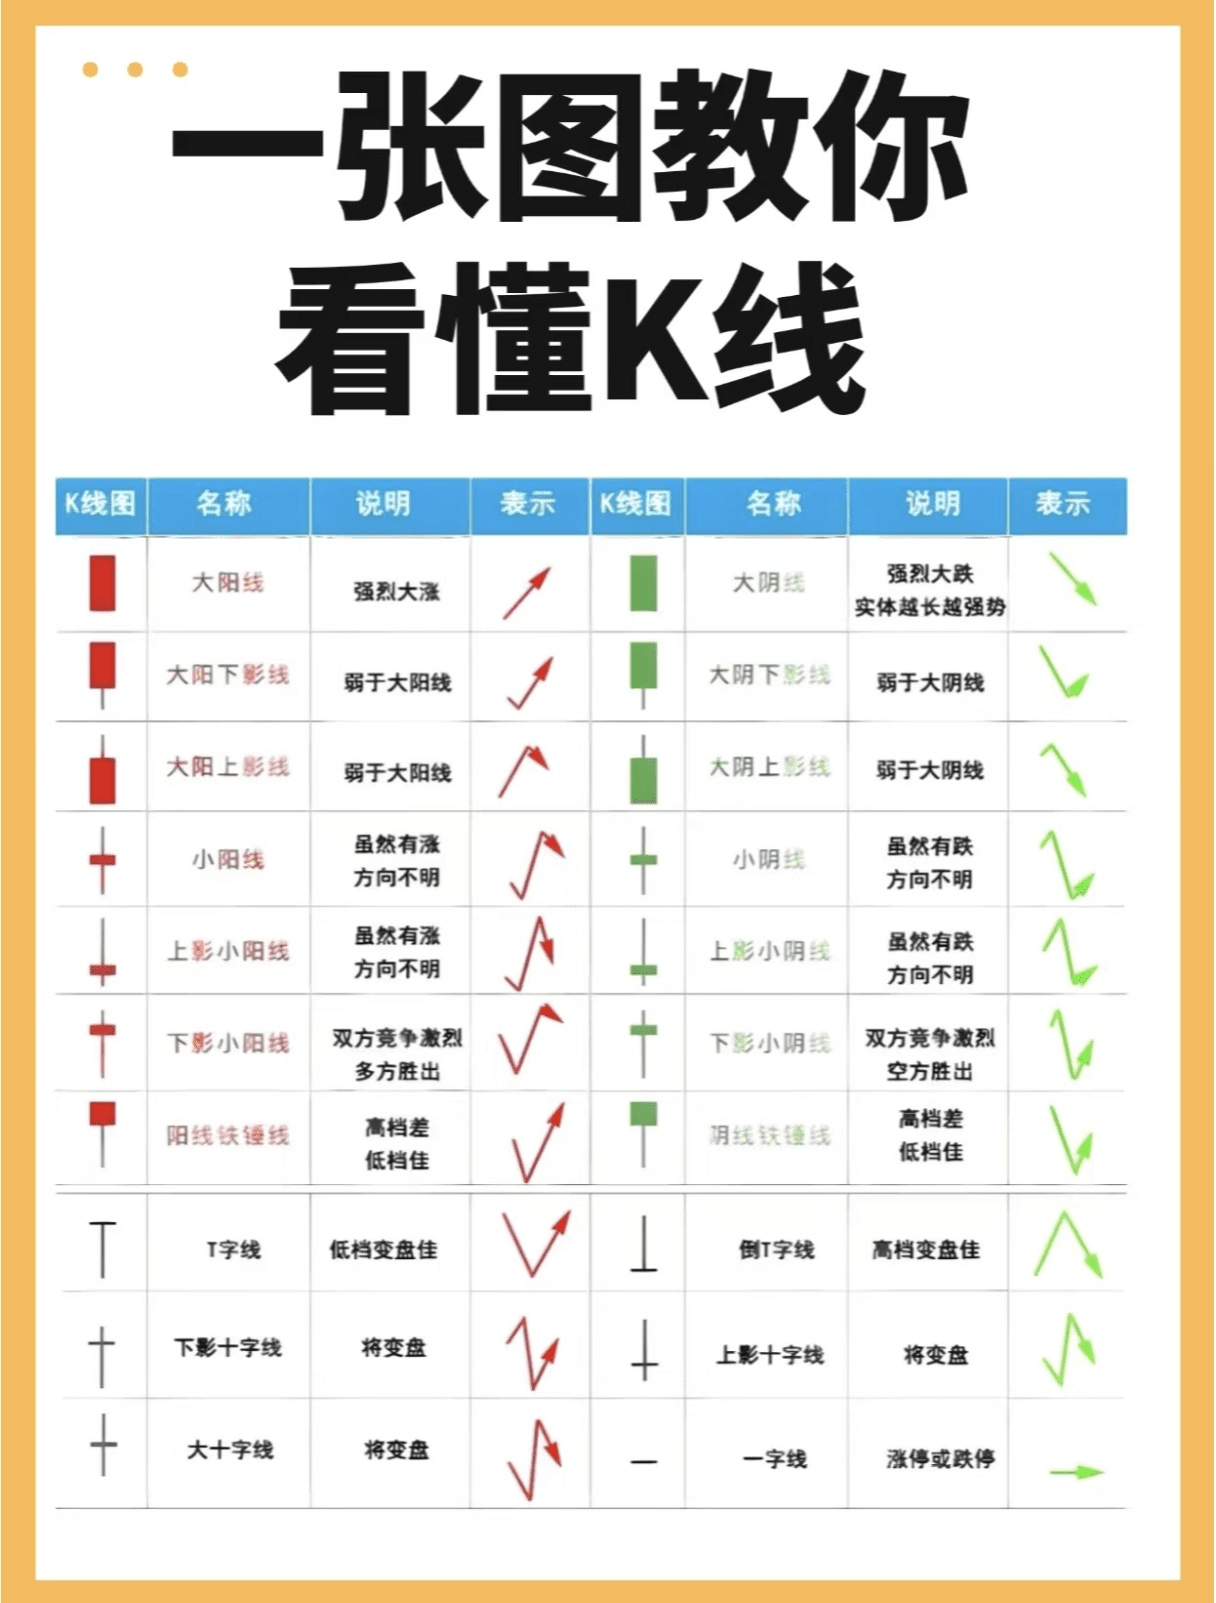
- Bullish and Bearish Candles: Bullish candles represent price increases during this period, while bearish candles represent price decreases.
- Body Size: The longer the body, the stronger the market's 'offensive' strength. A long bullish body indicates ample upward momentum; a long bearish body indicates significant downward momentum.
- Shadow Length: The longer the shadow, the more pronounced the resistance or support in that direction. A long upper shadow indicates significant resistance when rising; a long lower shadow indicates strong support when falling.
2. What signals do candlestick patterns provide?
- Double Bottom and Double Top: A double bottom (W shape) is a signal of a reversal from downward to upward; a double top (M shape) is a signal of a reversal from upward to downward.
- Head and Shoulders Bottom and Head and Shoulders Top: The head and shoulders bottom is a pattern indicating a reversal to an upward trend, while the head and shoulders top is a pattern indicating a reversal to a downward trend.
- Engulfing Candle: Usually suggests that the market may be about to reverse.
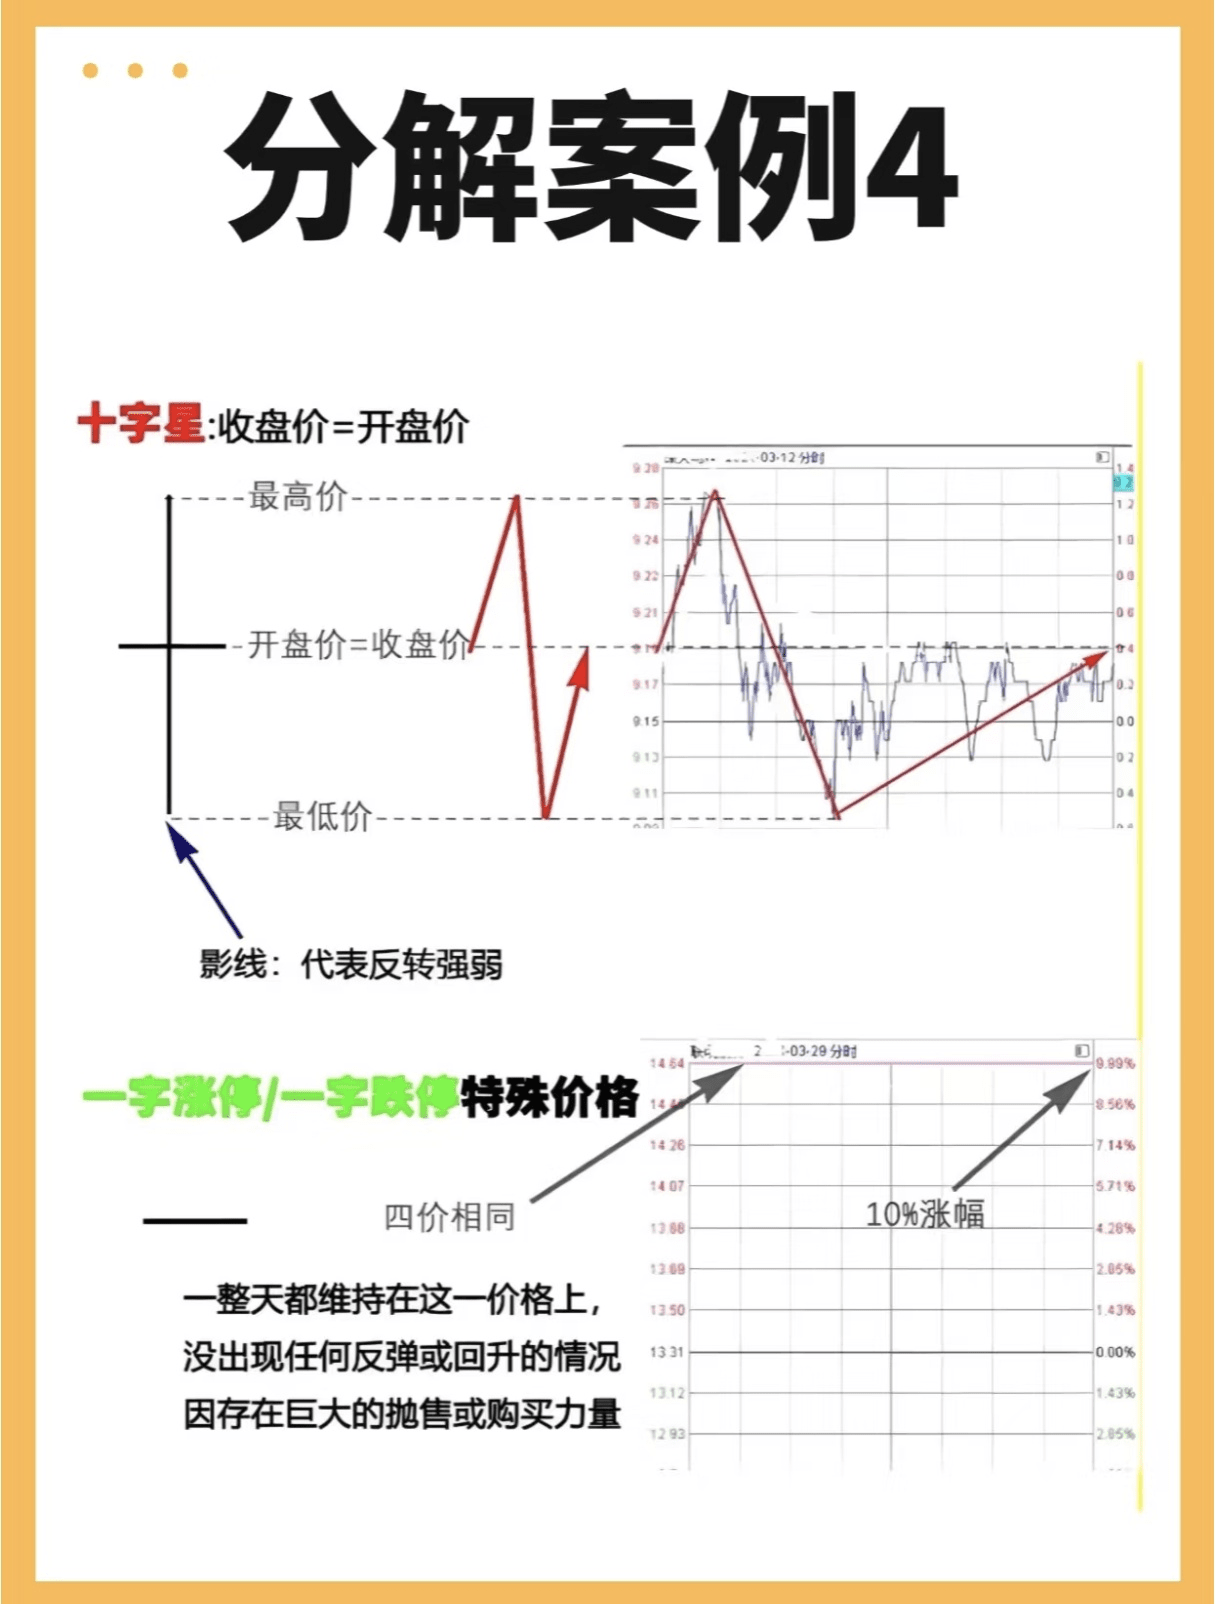
- Doji: The opening price and closing price are almost the same, indicating that both buyers and sellers are evenly matched. A doji appearing at a high level may signal a peak, while one appearing at a low level may signal a bottom.
- Red Three Soldiers and Three Black Crows: Red Three Soldiers are three consecutive bullish candles, representing a strong upward trend; Three Black Crows are three consecutive bearish candles, representing a weak downward trend. However, it is important to note that Three Black Crows during an upward trend may indicate that the bulls are accumulating strength.
3. Combine position and volume for greater accuracy
- Position: The position where the candlestick appears is crucial. For example, a long upper shadow during the early stage of an upward trend may indicate that the main force is 'testing the waters,' while a long upper shadow at the end of an upward trend may signal a peak.
- Volume: Trading volume is an important reference for judging trends. A bullish candle with increased volume often indicates sufficient upward momentum; a bearish candle with increased volume may indicate strong downward momentum.