1D Chart Analysis
Structure & Trend:
Macro Downtrend Broken: A long-standing descending trendline has been broken to the upside, shifting structure to neutral-bullish.
Bullish Divergence: Clear bullish divergence between price (lower lows) and RSI (higher lows), supporting trend reversal.
EMA Resistance Flipped: The price has reclaimed the 20 & 50 EMAs for the first time in weeks — a strong bullish signal.
Current Resistance: Price approaching short-term resistance between 0.00425 - 0.00451; needs a breakout and close above for further upside.
RSI: Sitting at 65.7, showing strong bullish momentum but not yet overbought — still has room to move higher.
Bias: Bullish with caution — strong support below, but needs daily close above 0.00425 to continue trend.
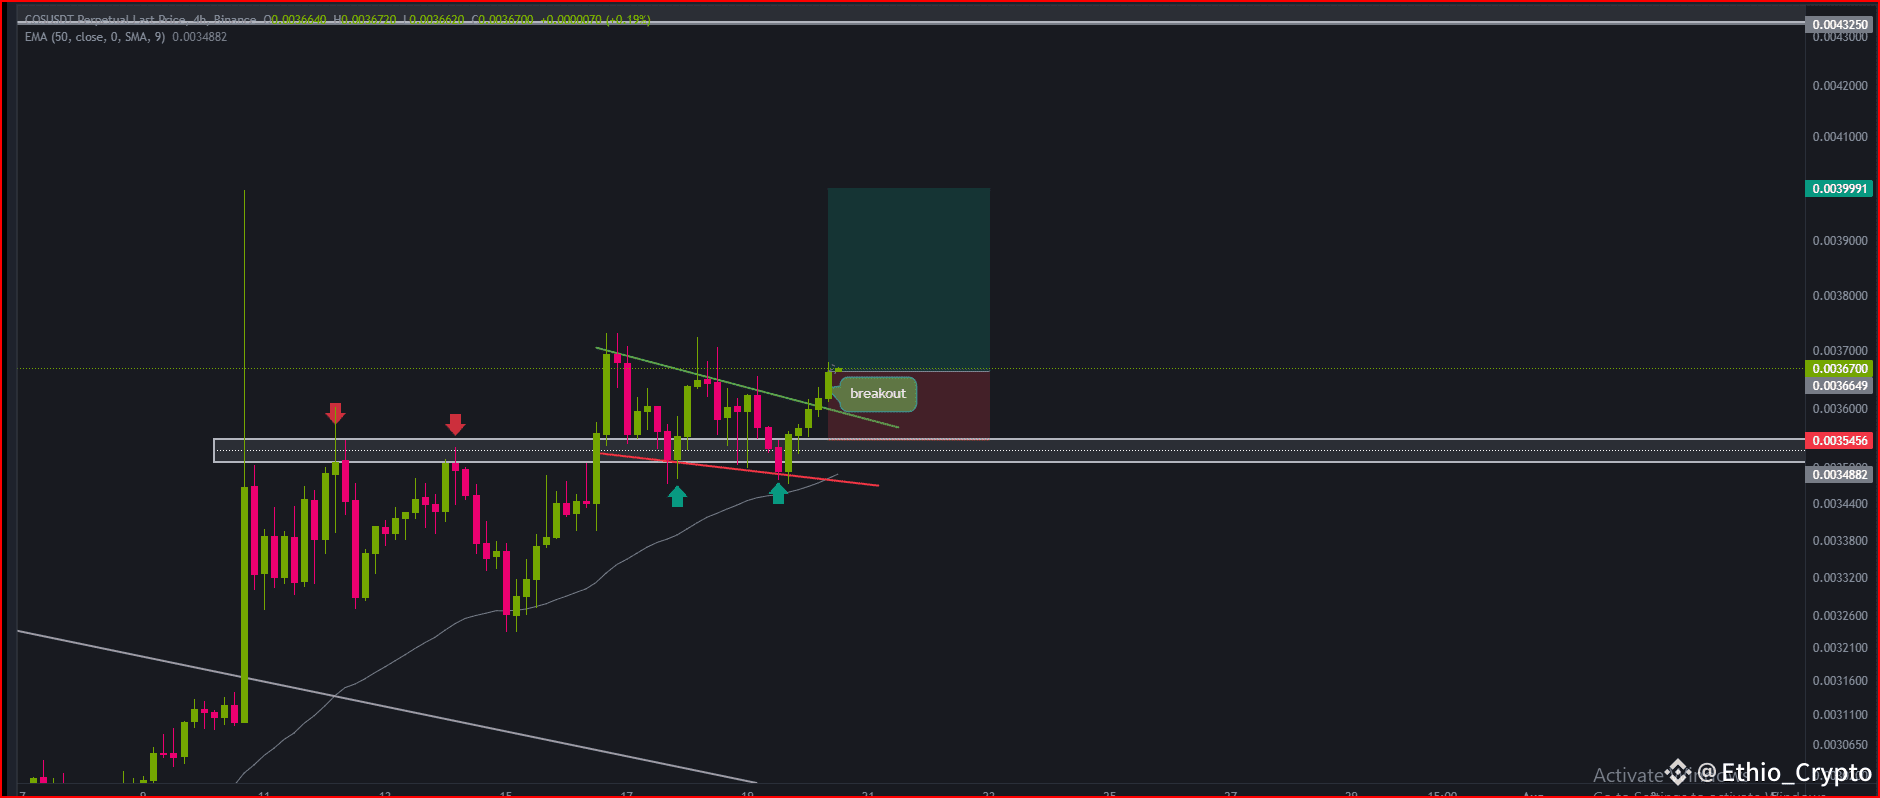
4H Chart Analysis
Key Observations:
Breakout Confirmation: The price broke out of a descending triangle pattern (green trendline resistance), confirming bullish momentum.
Support Zone: Multiple rejections above the 0.00354 - 0.00348 area suggest a strong demand zone, now acting as support.
MA 50 Support: The price is trading above the 50 EMA (currently at ~0.00349), signaling short-term bullish bias.
Volume and Candle Structure: Bullish breakout candle with body close above resistance zone; no major wick = confident breakout.
Target Projection: Bullish target aligns around 0.00399, with potential continuation to 0.00432 (prior resistance).
Risk/Reward Setup: Shown trade suggests 1:3+ RR; entry around 0.00367, stop at 0.00354, target ~0.00432.
Bias: Bullish, as long as price holds above 0.00354.
#CryptoMarket4T #AltcoinSeasonLoading #PowellVsTrump #MyCOSTrade
Let me know your idea in the comment section

