With the rise of cryptocurrencies, there are many types of coins, and many people do not understand them well, making it easy to fall into scam traps.
Today, we will introduce nine common cryptocurrencies in a simple and easy-to-understand way.
Help everyone establish a correct understanding of the crypto circle, avoiding being misled and deceived by unclear investment projects.
1. Bitcoin (BTC)
Bitcoin is the first decentralized digital currency with a fixed total supply of 21 million that will not increase. It is viewed as 'digital gold' used for value storage in the digital world.
2. Ethereum (ETH)
Characteristics: Ethereum is not just a coin; it is also a platform that supports 'smart contracts'. Developers can build decentralized applications (DApp) on it, making blockchain technology more multifunctional.
3. Binance Coin (BNB)
Characteristics: BNB is the token of Binance Exchange, initially used to reduce trading fees. BNB has multiple uses in the Binance ecosystem, supporting trading, payments, etc.
4. Litecoin (LTC)
Characteristics: Litecoin is an 'upgraded version' of Bitcoin, its transaction speed is faster ⚡ suitable for daily transactions and payments, making transfers quicker.
5. Ripple (XRP)
Characteristics: Ripple focuses on global cross-border payments, making fund transfers between banks more efficient and cost-effective.
6. Cardano (ADA)
Characteristics: Cardano is a blockchain platform that supports smart contracts, using an environmentally friendly 'proof of stake' mechanism aimed at enhancing the security and efficiency of blockchain technology.
7. Dogecoin (DOGE)
Characteristics: Dogecoin originated from the internet meme 'Doge', initially created for humor but has passionate community support, becoming a very popular cryptocurrency.
8. PEPE Coin (PEPE)
Characteristics: The PEPE coin is inspired by the internet meme 'PEPE the Frog'. It serves more as a part of social media and internet culture, with a strong community effect.
9. Shiba Inu Coin (SHIB)
Characteristics: Shiba Inu Coin is a meme coin inspired by the Japanese Shiba Inu. It has a massive supply and relies on community power and social media for promotion.
Understanding these common cryptocurrencies can help you better understand the world of cryptocurrencies and enhance your alertness to scams in the crypto space. Do your homework, remain rational, and let us be smarter, more alert, and safer in the crypto circle ⚡

Before a major bull market, representatives of each sector must be clear; if you don't know what to buy, then buy one cryptocurrency from each sector's leader.
DEFI Track: UNI, DYDX, GMX, GNS, VELO, JOE, GRAIL, RDNT, SSV, PENDLE, MCB
AI Track: AGIX, FET, CTXC, RNDR, OCEAN, NMR, AIDOGE
Web3: BAT, MASK, GRT, LPT, ANKR, WAVES, PHA, API3
L2 Public Chains: OP, ARB, MATIC, LRC, CELO, METIS
OP Ecosystem: VELO, SONNE, SNX, PERP
ARB Ecosystem: GMX, GNS, RDNT, MAGIC, VELA, GRAIL, PENDLE, STG
ZK Series: IMX, MINA, DUSK, METIS, CELR, LRC
Underlying Public Chains: ETH, BNB, DOT
Blockchain Games: FLOW, IMX, WAXP, WEMIX, MAGIC, GALA, YGG, MC, GF, GMT, VOXEL, LOKA, DAO, COMBO
Metaverse: HIGH, SAND, MANA, APE, ALICE
NFT Track: BULR, OPUL, BEND, SUDO, RARE, TVK, SUPER
Social Track: RLY, GAL, CYBER, HOOK, ID, MASK
RWA Sector: CFG, MPL, TRU, TRADE, LABS, POLYX, RIO, SNX
Privacy and Anonymity: ZEN, ZEC, KEEP, ARPA
Decentralized Trading: DYDX, UNI, 1INCH, SUSHI
New Public Chains: APT, SUI
MEME Sector: DOGE, SHIB, FLOKI, PEPE, AIDOGE, MEME
POW Sector: KAS, TAO, DNX, SPACE, ZEPH, RVN
Bitcoin Ecosystem: STX, RIF, SPACE, ORDI, SATS, RATS, MUBI, TURT
Storage Sector: AR, BLZ, STORJ
Hong Kong Concept: CFX, ACH, KEY, PPI, C98, MDT, LRC
DWF Concept: ACTION, MC, METIS, AGLD, MAST, VELO, CYBER
Binance IEO: HOOK, GAL, HFT, HIGH, ID, EDU
Staking Sector: LDO, SSV, FXS, FIS, RPL
Methods and underlying logic for screening hundredfold coins:
1. Low Market Cap Preference: The circulating market cap and total market cap should be low, especially for public chains and dapp protocols. Low market cap means more upside potential, avoiding early selling by project parties.
2. High Potential in Selected Tracks: The chosen track should have a high ceiling and significant valuation potential. Refer to successful projects, such as ETH or SOL for public chains, UNI or AAVE for dapps.
3. New Narratives and Value: Preference for projects with new narratives that solve real problems. Long-term value discovery is better than short-term speculation, focusing on hot topics like AI GPU computing power and secure public chains.
4. The concealment of dark horse coins: Hundreds of times dark horse coins are often hidden in areas not attracting public attention. Avoid well-known high-opening or normally valued coins.
5. Liquidity Challenges for Early Coins: The liquidity of early hundredfold coins is often poor and mainly found in small exchanges or on-chain. Crossing these thresholds is essential for value discovery.
6. Launch Time and Market Cycle: The best time for a token to launch is at the end of a bull market or the beginning of a bear market, with a washout period of 6-12 months for best results and high circulation rates.
7. Affordable Pricing: Low price, many zeros after the decimal point are more appealing to investors, especially during a bull market, low-priced coins are favored by newcomers.
8. Public Chains and Top Protocols First: Public chains and top protocols on public chains have the greatest profit potential due to their long lifecycle and continuous ecological development.
9. Team and Institutional Endorsements: The founder, team background, investment institutions, and financing amounts must be reliable. Participation of well-known teams and institutions increases the project's credibility.
10. Avoid Value Investment Traps: Do not participate in projects that violate the logic of value investing, such as deflationary tokens, as these projects often carry high risks.
11. Consider Old Coins with New Narratives: If old coins have a very strong new narrative that aligns with current market hotspots, consider participating, such as old coins related to AI, the metaverse, etc.
12. Prioritize Track Leaders: In the selected track, prioritize leading projects, as they typically have stronger ecological influence and value potential.
Remember, the above rules are guiding principles for screening new coins, but investment always carries risks and must be taken seriously.

Having traded cryptocurrencies for over 10 years, I am currently experiencing the fourth bull-bear cycle. The time when you really earn big money is in a bull market. If you do a good job of quietly positioning mainstream altcoins, making ten times or even a hundred times is not a big problem after a round of bull market!
Adding this fourth round of bull market, I have been doing spot trading continuously and have already had three small suns. Waiting for this fourth round, aiming for ten small suns!
There is a dumbest way to trade cryptocurrencies that allows you to maintain 'ever-prospering'.
At the end of last year, I played with 200,000, and now it's 20 million, easily achieving a hundredfold profit. I still use this method (suitable for everyone) and it's highly stable.
Everyone need not worry about whether you can learn; I can seize this opportunity, and so can you. I am not a god, just an ordinary person. The difference between others and me is that others ignore this method. If you can learn this method and value it in future trading processes, it can help you earn an additional 3 to 10 points of profit daily.
First, work hard for two months to bring your principal up to around 10,000.
Second, buy coins when Bitcoin's weekly price is above ma20; buy two to three, must be new coins, hot coins in a bear market, like APT before it rose, it came out of a bear market. As long as Bitcoin rises a little, it can take off, like OP. Just remember to have heat and a story to tell.
Third, if Bitcoin falls below ma20, stop-loss, buy or continue to earn during the waiting period, giving yourself two to three chances of failure. If you have 20,000 in savings, invest 10,000, and you can afford to fail three times.
Four, if you buy coins like APT, aim for about 4-5 times profit. Continuously execute the strategy, remember you are dealing with small funds, you must buy new coins, do not buy ETH or BTC. Their price increases cannot support your dreams.
Five, if you hold through the bear market to the bull market, achieving three times 5 times would be about 125 times. This period can range from one year to three years.
You have three chances to fail. If you fail all three times, it means you do not have the ability; stay away from this circle, stay away from investing, and do not get caught up in contracts.
Invest your energy into work, cultivate your hobbies, improve your skills, make money in work, live well, and when you are more mature and stable, around your 30s, when you encounter a bear market like 2022 again, take out another 20,000 and try again using the methods above. If you still don't succeed, then work steadily and stay away from the crypto circle.
The most important thing about the above methods is to have patience. If you don't have patience, and the situation gets chaotic, exit as soon as possible, and don't get into contracts.
In short, remember to enter when it's time, stop-loss when it's time, be patient, the martial arts secrets have been given to you. Whether you can become famous in the world depends on yourself. The market never lacks opportunities; the question is whether you can seize them. Following experienced and right people, we can earn more.
Fans went from 100,000 USDT to liquidation to 5,000 USDT, how did I teach them to use the 'Devil's Rolling Warehouse Technique' to kill back to six figures!
1. Nightmare Start: How 100,000 USDT vanished into thin air in the last bull market, fans rushed into the futures market with 100,000 USDT, thinking 'Bull markets make money regardless of the position', but reality slapped me hard!
High-frequency trading is overwhelming: trading dozens of orders in a day, and transaction fees eat into the principal!
Stubbornly holding on to the end, exploding cleanly: continuously averaging down during major declines, mentally chanting 'the bull will return quickly', only to end up with zero.
FOMO all in, only to be harvested: Seeing others flaunt hundredfold returns from altcoins, impulsively diving into meme coins, only to wake up and find the account has only 5,000 USDT...
During that time, fans lost sleep all night, smoked until their throats were hoarse, staring blankly at the candlestick chart, feeling like a gambler mocked by the market.
From now on, I only let him do these few things!!!
(1) Only engage in deterministic markets, refuse to operate frequently, don't blindly fiddle with 1-minute candlesticks, only wait for large-level breakouts; it's better to miss than to make a mistake!
(2) Win more and lose less, increase positions like a sniper; the first order should never exceed 10% (500 USDT), only gradually increase positions after making a profit! For example, if you earn 20%, immediately take half profit, and set a trailing stop for the remaining profit to run.
(3) Stop-loss is the lifeline; never gamble, every order must have a stop-loss, cut losses at 5% directly, never hold on! If you have two consecutive stop-losses, stop trading for the day to prevent emotional loss of control.
Advice for all brothers losing money
"Want to turn the tables? First learn to survive!"—Before losing all your capital, practice stop-loss.
Record every transaction, understand losses, and maximize gains.
Discipline is above all; 99% of people are liquidated because of the lucky mentality of 'just hold on a bit longer to break even.'
I am a full-time Bitcoin trader with assets in the millions, withdrawing 100,000 from the crypto circle each month, feeling no impact, living leisurely and freely, without deceit or intrigue, living the life I want.
Trading cryptocurrencies, the mean reversion strategy has always been my first choice. Using this method, I turned 500,000 into 10 million in a year. If you also like doubling coins and want to engage in the main rising wave, you must read this article carefully!
In articles from 'Trader Says', the term 'mean reversion' is often mentioned, but many novice traders find it unfamiliar and somewhat confusing. So, what exactly is mean reversion? Today, we will explore the basic concepts of mean reversion and how to use mean reversion strategies for trading.
Mean reversion is a trading strategy based on the principle that prices and markets tend to revert to their average over time. This strategy believes that extreme price fluctuations, whether up or down, are temporary, and that ultimately prices will return to their average level.
This article will explore the concept of mean reversion trading and delve into the basic principles of mean reversion strategies.
Understanding Mean Reversion
The core idea of mean reversion is that prices fluctuate around a long-term average. In other words, when prices significantly deviate from their mean, there is a high probability of a reverse price correction, bringing them back to the mean. This concept is based on the assumption that the market is driven by emotions, which often leads to overreactions or exaggerated fluctuations.
The mean reversion phenomenon can be seen in various financial markets, including stocks, forex, commodities, and indices. As a widely studied phenomenon, it has become the foundation of many successful trading strategies.
"Mean Reversion" is essentially a statistical phenomenon, widely known through the research of British statistician Francis Galton (Charles Darwin's younger cousin).
Basic Knowledge of Mean Reversion Strategy
Mean reversion strategies involve identifying when prices significantly deviate from their mean and establishing positions in anticipation of price reversion. Traders using this strategy typically employ a variety of technical indicators, statistical tools, and chart patterns to look for potential mean reversion opportunities.
The key elements of the following mean reversion strategy:
Identifying Overextended Price Trends
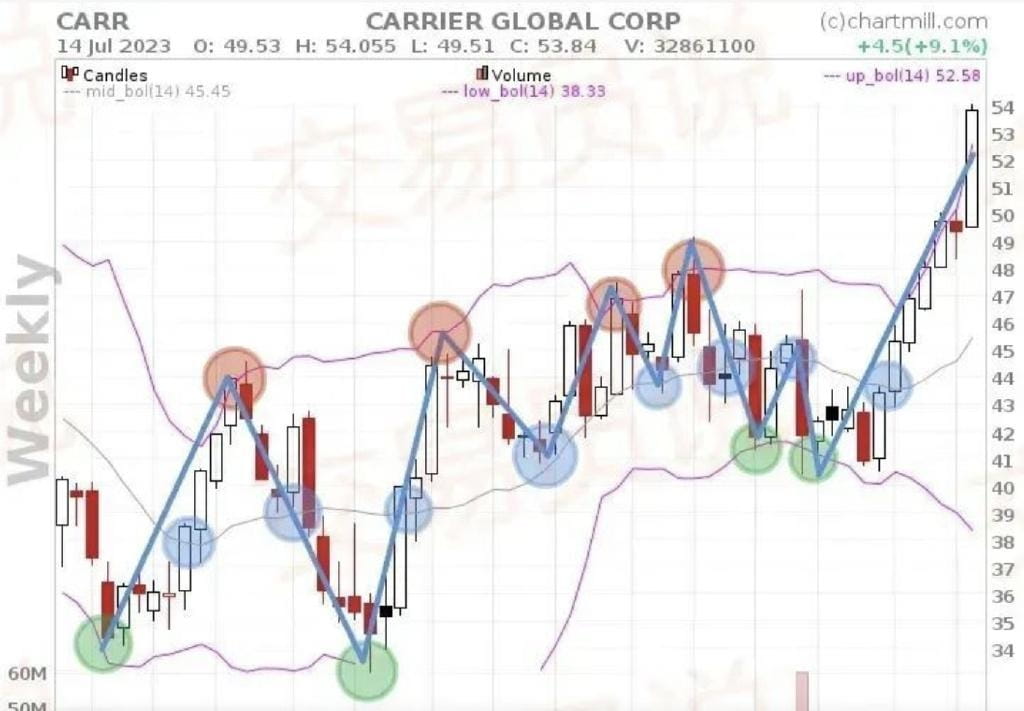
Traders will look for price trends significantly deviating from the mean (the red and green circles in the chart); these situations may indicate that prices have experienced excessive expansion (extension).
This process can be accomplished using indicators like Bollinger Bands, which can measure market volatility and highlight price levels that exceed normal ranges.
Confirmation Signals
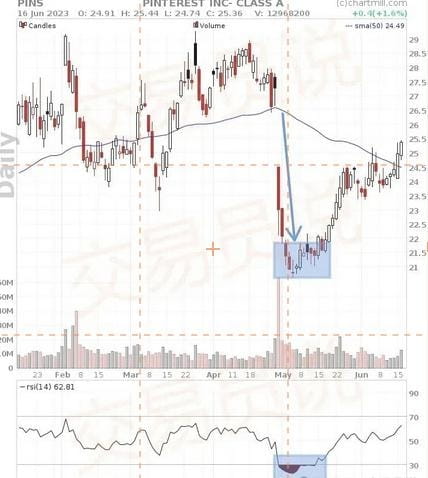
Traders need to confirm signals to verify potential mean reversion trading opportunities.
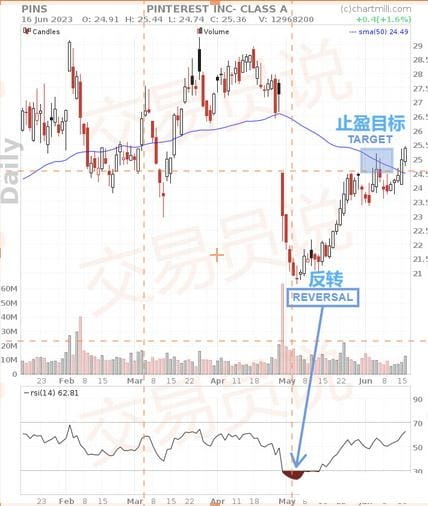
This usually includes using relative strength index (RSI) or stochastic oscillator indicators to identify overbought or oversold conditions, indicating that the market may reverse.
Entry and Exit Points
Traders determine entry and exit points based on their analysis of mean reversion. They may enter when prices reach extreme levels and show signs of reversal.
Exit points are usually set at a predetermined target price or when the price starts to revert to the mean.
Look for low-risk trading opportunities
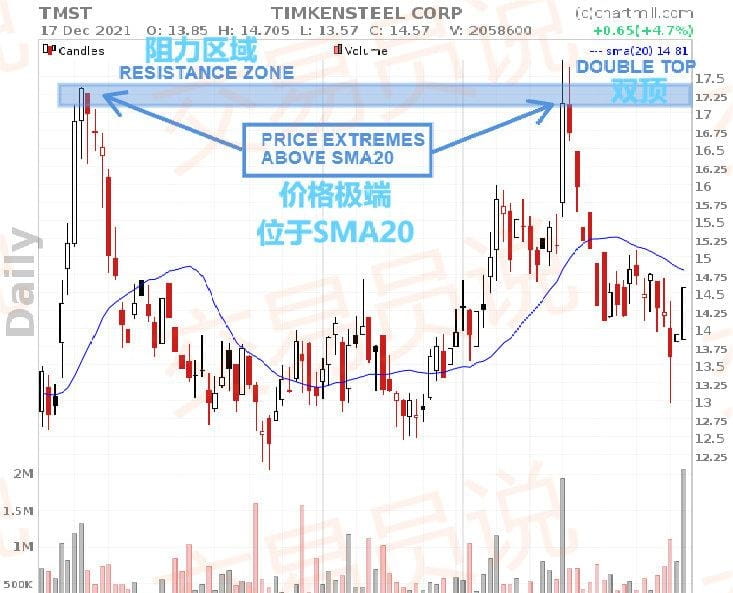
For example, if the price forms a double top at extreme levels, it may provide a low-risk shorting opportunity.
This strategy is particularly attractive to day traders and swing traders. The key is to find the stocks that deviate most significantly from the mean, especially when these extreme deviations coincide with important support or resistance areas.
In this way, you can find some interesting low-risk entry opportunities.
Risk Management
Like all trading strategies, mean reversion trading must strictly manage risks. Traders need to set stop-losses to limit potential losses from reversals while also considering position size and a reasonable risk-reward ratio.
Monitoring Fundamental Factors
Although the mean reversion strategy mainly relies on technical analysis, it is still important to pay attention to key fundamental factors that may affect prices, including: 1) macroeconomic news; 2) earnings reports; 3) changes in market sentiment.
Analysis of the Advantages and Disadvantages of Mean Reversion Strategies
The mean reversion strategy offers the following potential advantages to traders:
1. Profit Potential: By capturing price corrections towards mean reversion, traders are expected to achieve profits.
2. Clear Trading Signals: Entry and exit rules based on technical indicators make trading execution more actionable.
3. Risk Control Space: Through stop-loss settings and strict risk management, potential losses can be effectively controlled.
But it is necessary to be aware of the inherent risks of this strategy:
1. Trend Continuation Risk: Prices do not necessarily revert to the mean and may continue to follow the original trend, leading to trading losses.
2. Expansion Bias: Prices may remain in a state of excessive expansion for longer than expected, resulting in missed trading opportunities or further losses.
3. False Reversal: Sometimes, what appears to be a mean reversion opportunity may actually be a false reversal. Entering trades too early may lead to losses.
In summary, the mean reversion strategy is a popular method in trading, with the core idea that prices tend to revert to their average level over time. By identifying excessively expanded price fluctuations and anticipating a return to the mean, traders can profit from price corrections.
Mean Reversion Strategy for Day Trading and Swing Trading
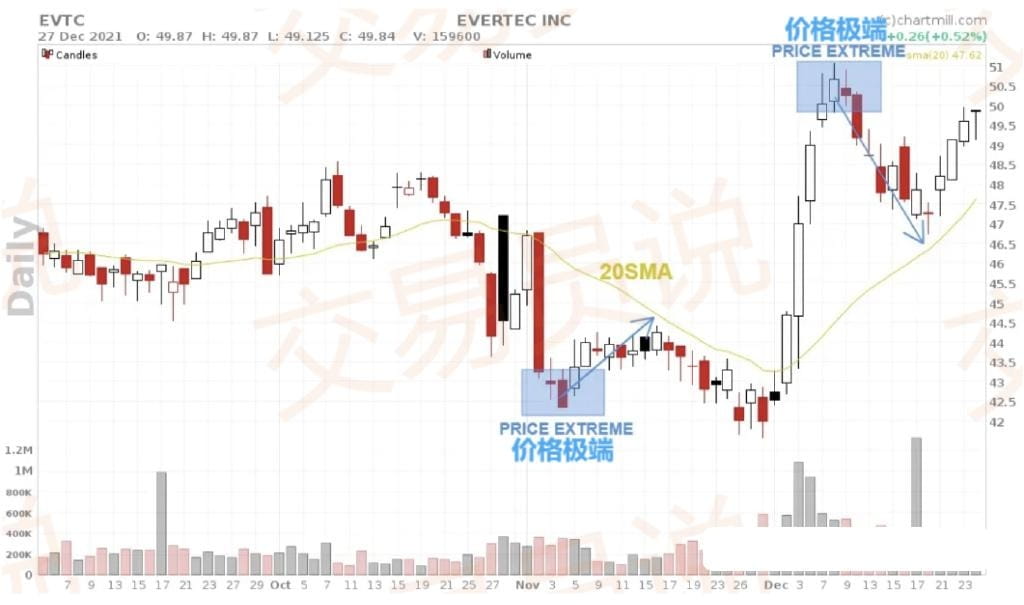
Extreme price fluctuations (covering both upward and downward trends, usually accompanied by high volatility and lasting for a short time) can profit from capturing momentum exhaustion and timing price reversion to the mean. The 'Red Dog Reversal Strategy' is designed to identify targets at such price extremes, setting precise entry points and clear stop-loss levels once the target is confirmed. This strategy is initially positioned as pure day trading—because we are always fighting against the current trend. However, depending on intra-day trends, partial positions may be retained to gamble on overnight reverse trends.
Risk Warning!
Special warning for overnight holders: The stop-loss range adopted by this day trading strategy is very short (sometimes even extremely short). This means that when the trend continues for several days, profits may accumulate significantly, but potential losses will also be magnified! For example, if a certain long position has an initial stop-loss set at only $0.20, and the next day the opening price drops sharply by $1, this would severely impact your portfolio!
How to objectively determine if the target is in a price extreme state?
Price and SMA
Using moving averages (like SMA20) to view stock prices is the most intuitive method of judgment.
Sudden sharp rises and falls create a significant gap between price and SMA 20.
Oscillator Indicators (Stochastic, RSI)
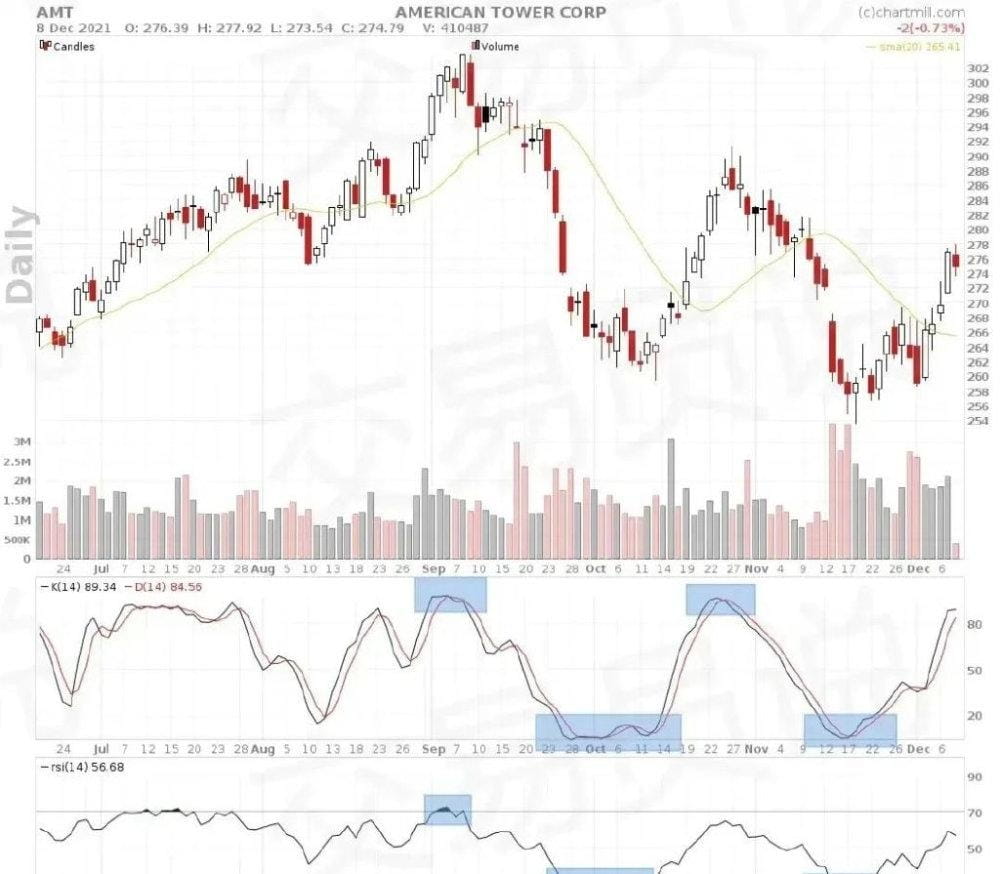
Oscillator indicators such as Stochastics and Relative Strength Index (RSI) can effectively identify price extremes in charts and show oversold or overbought levels. These indicators align closely with the aforementioned SMA 20 intuitive judgment method.
Red Dog Reversal Strategy
Since we have learned how to objectively define price extremes, let’s move to the core part of the strategy.
Reversal Signals
Since we are discussing mean reversion strategies, we need to look for reversal signals and establish positions in the opposite direction of the current trend.
Buying Conditions:
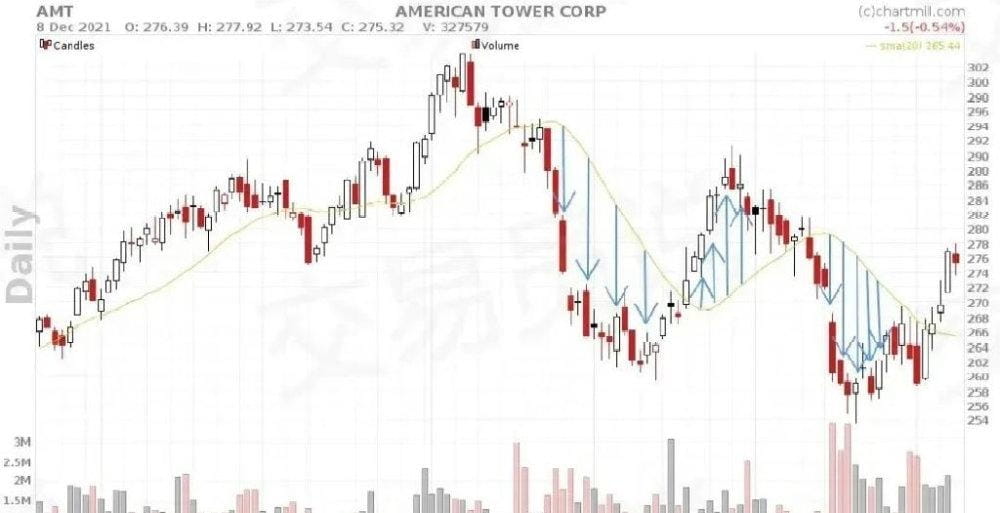
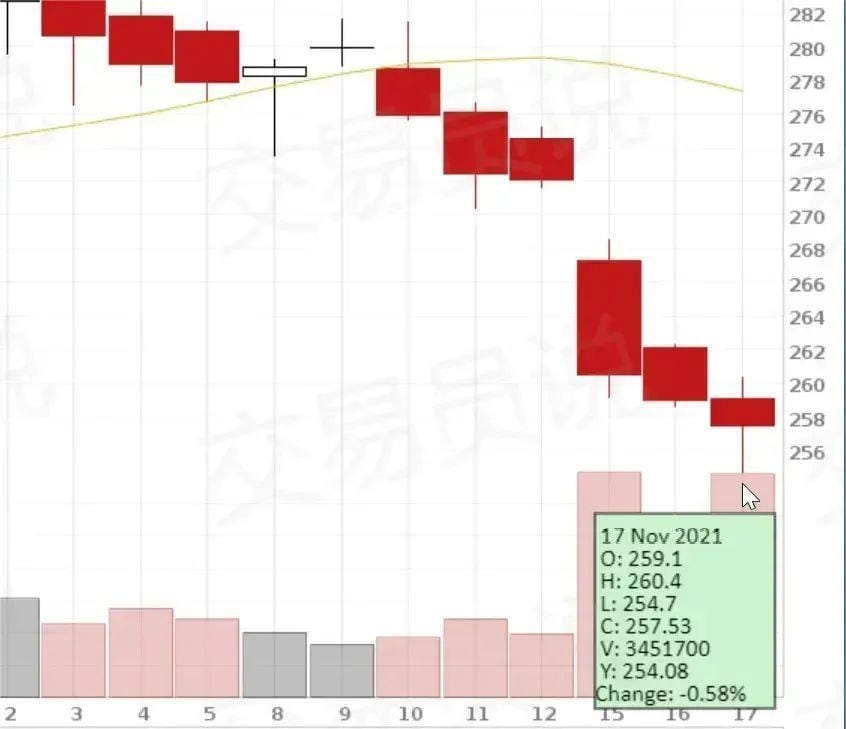
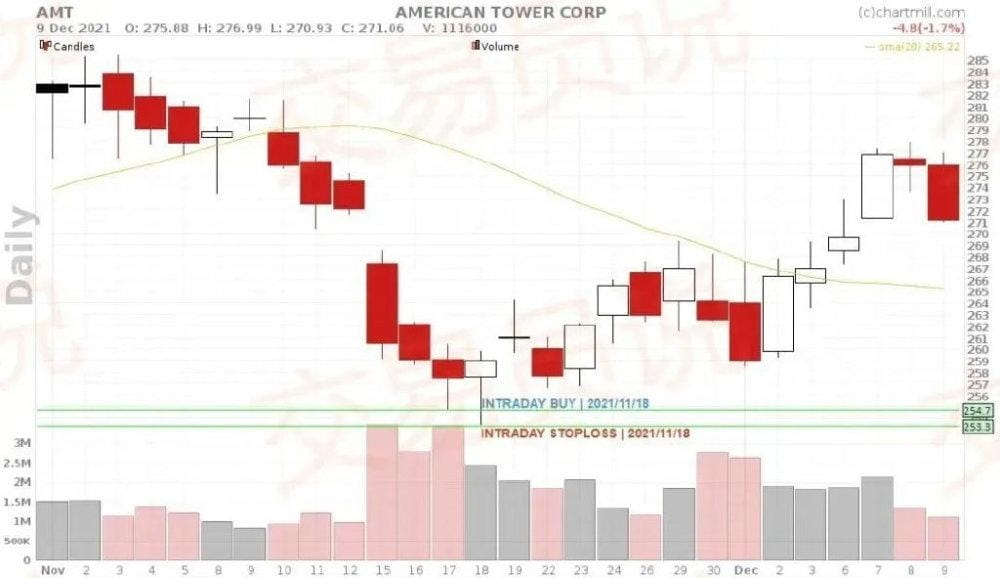
● The stock must show price extremes, meaning the price is relatively far from SMA 20, and the stochastic indicator is < 20 or RSI is < 30. The following graph shows the AMT stock trend on November 17, 2021: the stock fell significantly on that day accompanied by a large volume of selling, causing the price to fall far below SMA 20. Meanwhile, the slow stochastic indicator also touched a low, and the price was at a support level.
● After determining the above conditions, it is necessary to observe the opening situation of the stock on the next trading day. The opening price determines whether the strategy can be activated. The price should be above the lowest point of the previous candlestick. In the case of AMT, this means the opening price needs to be above $254.7 (the lowest point of 2021/11/17).
Next, let's look at the 2-minute chart from November 18, 2021:
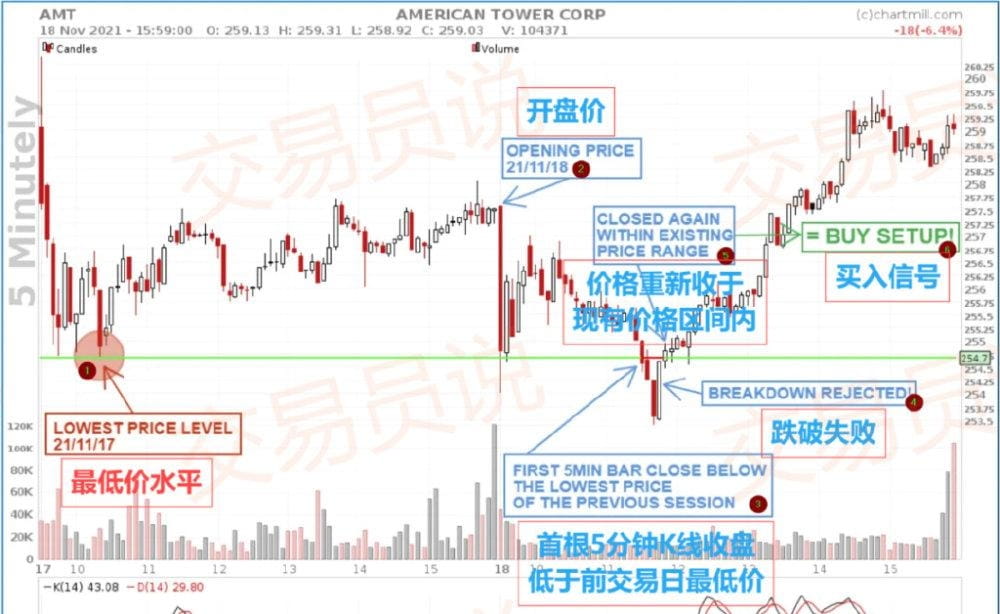
Trading Signal Analysis:
1. The lowest price on 2021/11/17
2. The opening price is higher than the previous trading day's lowest point.
3. At 11:35 AM, the first red candlestick closed below the lowest point of the previous day. The next two candlesticks also showed lower prices, indicating that the existing downtrend may continue.
4. However, a long white candlestick appears afterwards (following five consecutive red candlesticks), and the price begins to rebound. The buying volume is significantly higher than the selling volume, indicating that the market rejected the breakthrough decline.
5. The next candlestick closes again above the lowest point of the previous day.
6. This series of movements forms an actual buying signal.
Actual Positioning Rules
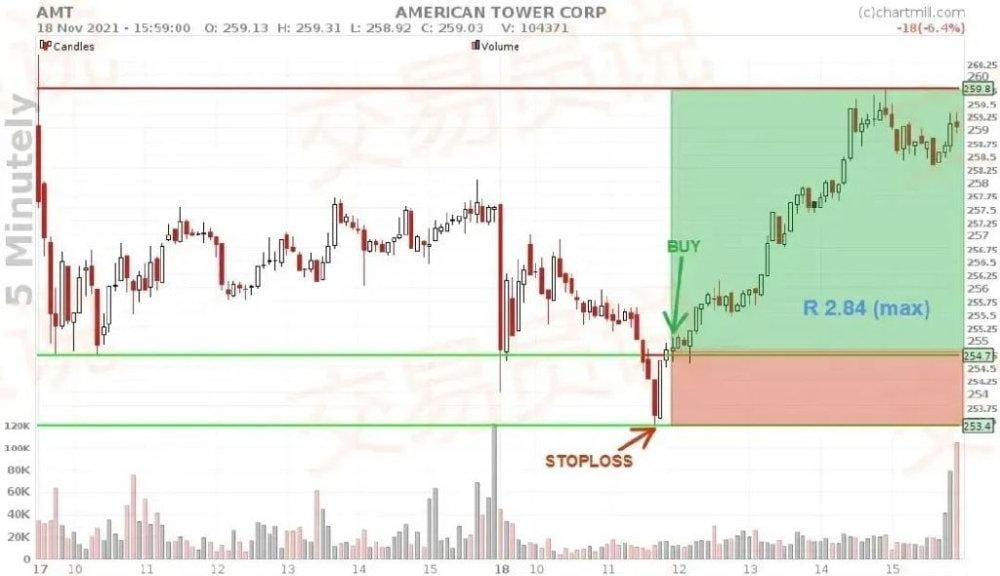
● After the first candlestick closes above the lowest point of the previous day, stocks are bought at the opening of the next candlestick.
● Stop-loss set below the day's lowest point.
In this case, the long position was never at risk. The price ended the day with a profit, exceeding 2.5 times the initial risk.
Below is the chart from 2021/12/10:
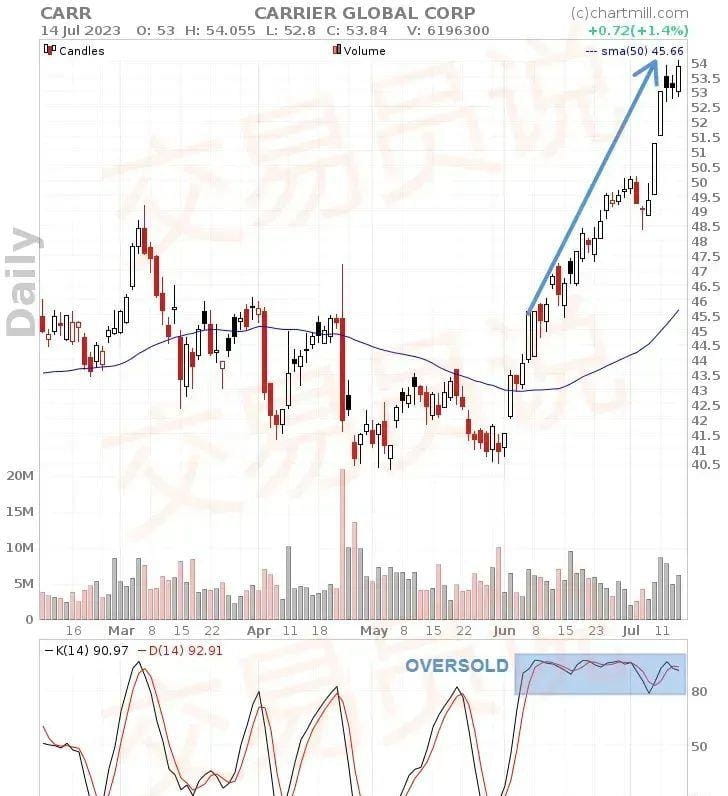
Traders holding some long positions can profit from the continuous rise. For example, SMA 20 is a good target point for this trading setup.
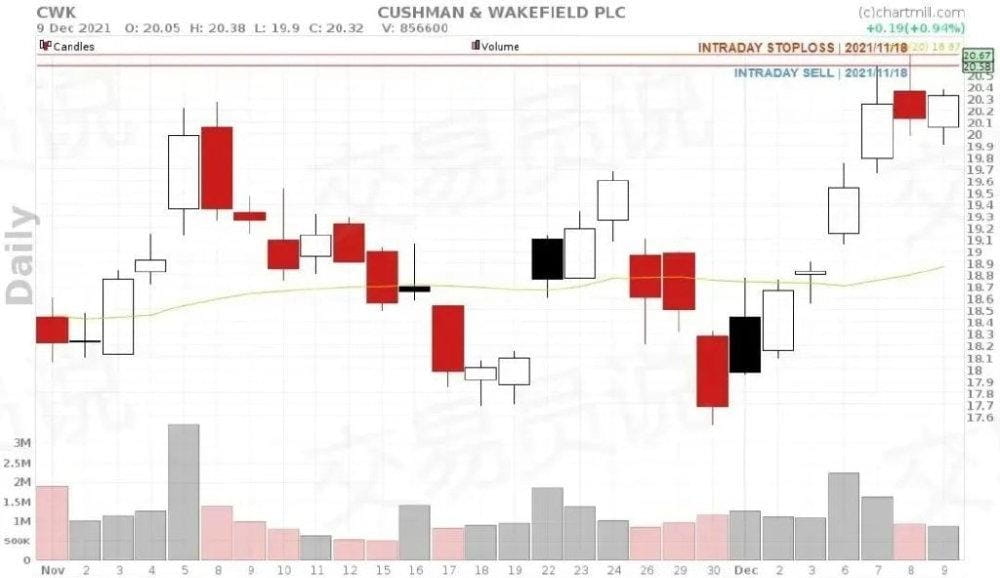
Short Position Setup Example
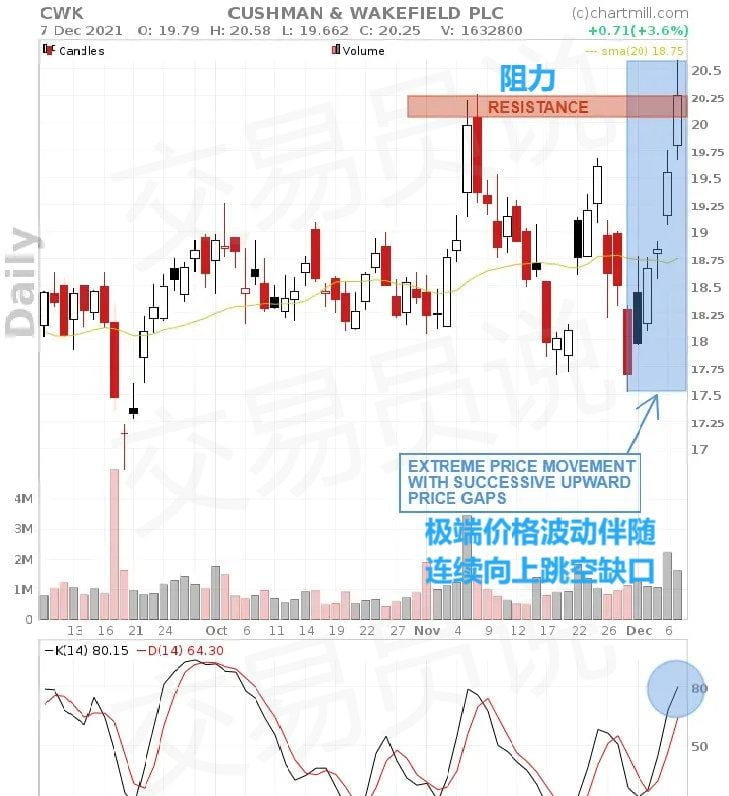
● The chart of stock CWK shows obvious price extremes. After hitting a low of $17.5, the price rose to above $20.5 within just 5 days, an increase of over 17%. The current price is far above SMA 20.
● On the previous trading day, the price rose and touched an existing resistance area.
● Additionally, the stochastic indicator rises strongly above 80 (overbought area).
On the next trading day, the first thing we need to focus on is whether the opening price is below the highest point of the last candlestick. Below is the 5-minute chart of CWK.
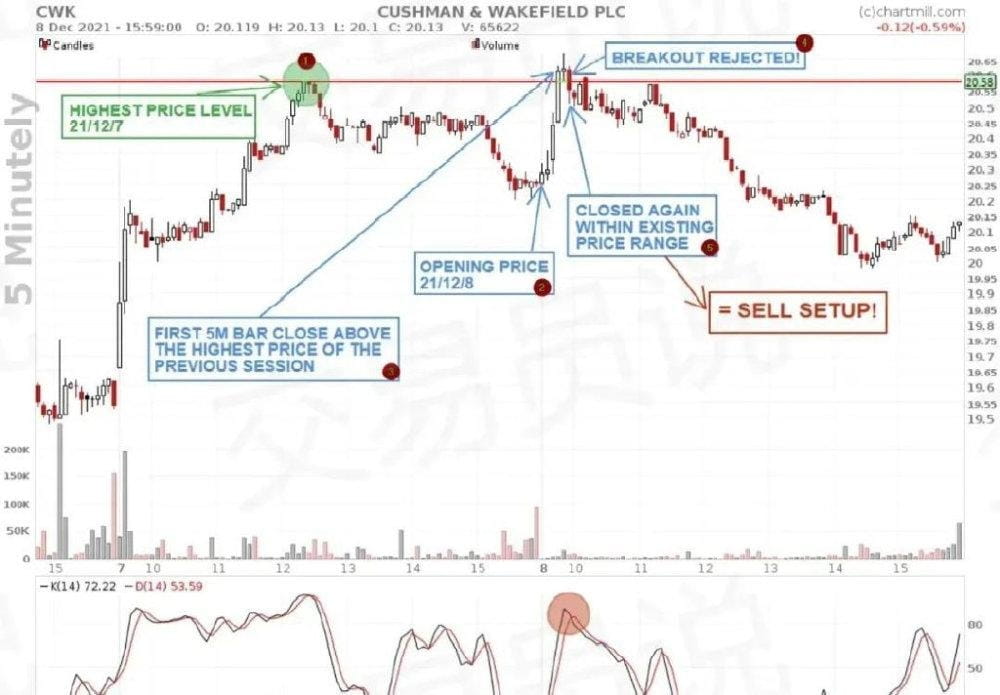
1. The peak on 2021/12/7
2. The opening price is below the previous trading day's highest point.
3. The price then immediately continued to rise strongly, and at 09:50 the first long white candlestick appeared, closing above the previous day's highest point. This indicates that the upward trend seems to continue.
4. However, the price then fell below yesterday's lowest point, which may indicate that we are facing a false breakout.
5. A red candlestick effectively closes below the previous day's lowest point, and this signal is confirmed, providing a potential short setup.
Actual Trading Setup
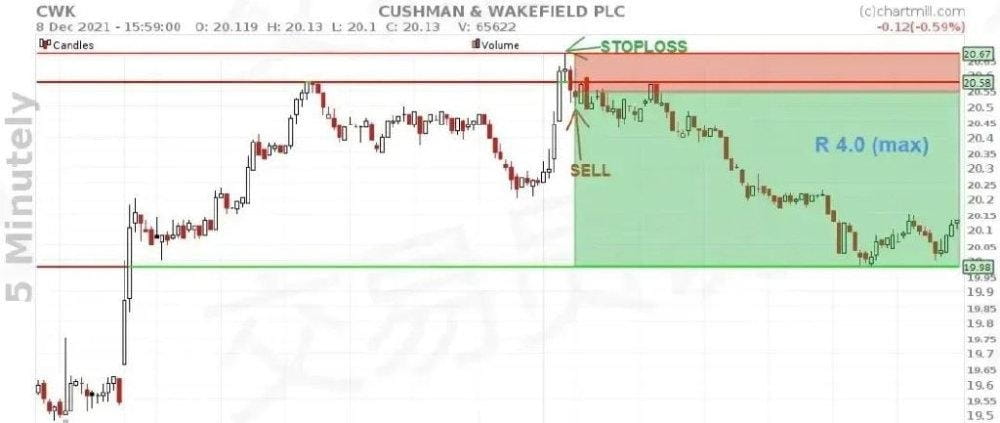
● After the candlestick closes below the highest point of the previous trading day, establish a short position at the opening of the next candlestick.
● Stop-loss is set above the day's highest price.
It turns out that in this case, this was also a perfect entry point. For traders who close positions before the trading day ends, potential profits could reach up to four times the initial risk.
The chart date below is 2021/12/10:
Summary
This strategy is completely opposite to trend strategies because it operates against the trend, speculating based on reverse fluctuations within the current trend. Such strategies are typically used for swing trading. However, it should be noted that even if prices revert significantly, the original trend may still persist. Therefore, when adopting such strategies, the trading time frame is usually short, and the trading style is more aggressive.
Remember that it is crucial to combine the mean reversion strategy with appropriate risk management and related fundamental analysis. Like any trading strategy, it is advisable to thoroughly test these techniques before actual trading.
Continuous Attention$BTC $ETH $XRP
#山寨季何时到来? #上市公司加密储备战略 #ETH突破3600 #山寨币突破


