Hello, loyal Binance Square readers! Let's dive into the report on crypto price movements for the period from July 12 to July 19, 2025, with a special focus on the 1-hour Timeframe (TF) using Smart Money (SMC) concepts. This report not only provides you with understanding but also potential signals for your trading strategies.
Last Week's Macro Market Conditions: Bullish Wave and Regulatory Clarity
Last week (July 12-19, 2025) was a very bullish and dynamic period for the crypto market as a whole. Strong positive sentiment pushed Bitcoin ($BTC ) to new highs above $110,000, even touching $122,379 on July 14. Ethereum ($ETH ) also showed resilience, holding around $3,540-$3,670. The total crypto market capitalization surpassed $4 trillion on July 18, driven by significant gains in altcoins such as XRP ($XRP ) and Uniswap (UNI).
The main driver of this bullish sentiment is strong institutional demand through Exchange-Traded Funds (ETFs), with Bitcoin ETF inflows exceeding $4 billion throughout July. The successful launch of several spot Ethereum ETFs also sparked new institutional interest.
The most significant macroeconomic and crypto news is the signing of the GENIUS Act by President Trump on July 18, 2025. This legislation provides regulatory clarity for stablecoins, seen as a "transformative moment for the crypto industry." However, Basel Medical halted their Bitcoin strategy due to "ongoing regulatory uncertainty in the US," indicating that regulatory clarity still has nuances.
Despite the overall bullish trend, the market shows "sharp volatility" across various segments, including Ethereum experiencing "higher volatility and deeper drawdowns" compared to its peers. This indicates that while institutional money provides fundamental stability, certain altcoins remain vulnerable to more volatile smart money movements.
Cryptocurrency Assets to be Discussed: PAXG
In this 1-hour TF analysis, we will focus on PAX Gold (PAXG). Why PAXG? Although it is a gold-backed token, PAXG shows highly dynamic price movements and becomes a typical target for smart money maneuvers in the crypto market. This makes it an interesting case study for the application of SMC concepts.
Data & Observations PAXG (1 Hour TF)
In-depth analysis of the PAXG chart 1 hour TF for the period July 12-19, 2025 reveals several key observations based on Smart Money concepts:
A. Market Structure & Trend (SMC)
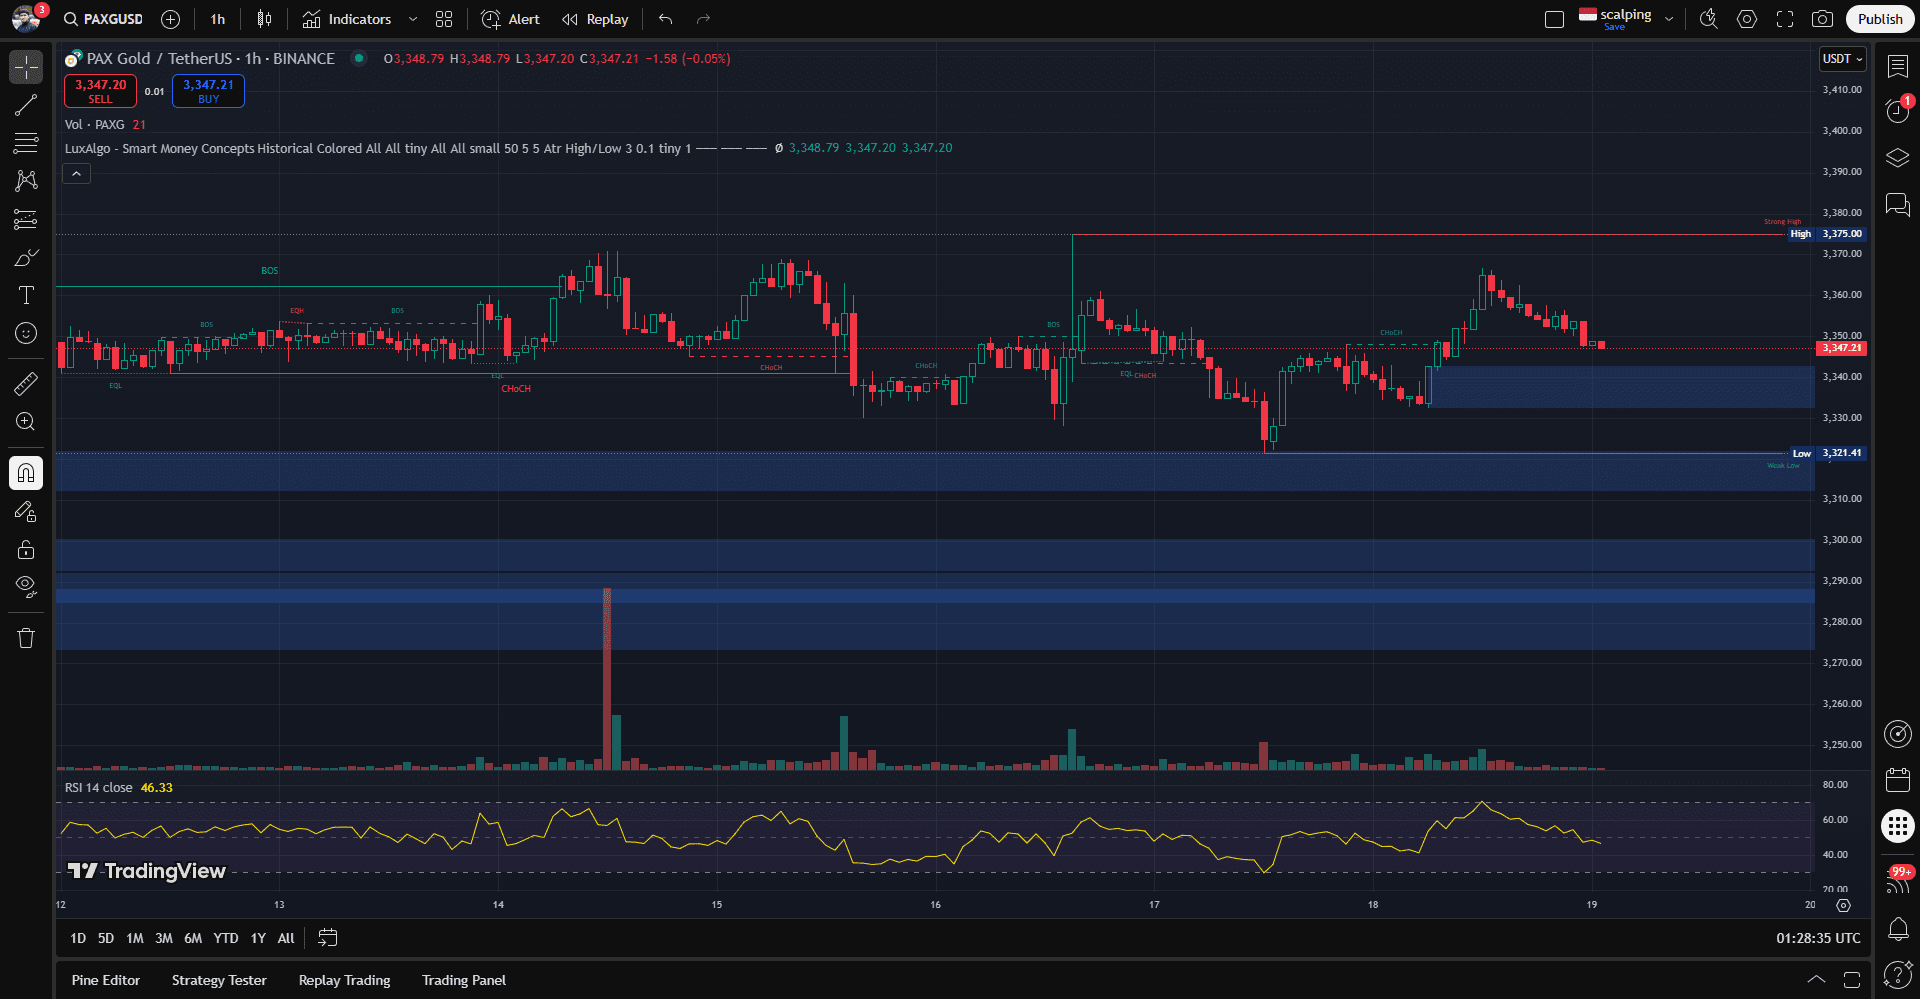
PAXG starts this week with a relatively tight consolidation phase, oscillating mainly between $2.330 and $2.350 from around July 12 until early July 13.
A clear bullish Break of Structure (BOS) was observed around July 13, at 08:00 UTC, as the price decisively broke above $2.345, confirming the shift to a bullish market structure.
After reaching a "Strong High" around $2.370 on July 15, PAXG showed significant Change of Character (CHoCH) around July 15, at 14:00 UTC, when the price broke below the last significant higher low (around $2.340), signaling a momentum shift from bullish to bearish.
Towards the end of the period, a subtle bullish CHoCH may form around July 18, at 16:00 UTC, as the price breaks the minor bearish structure, indicating potential short-term reversal or re-accumulation phase.
B. Key Levels & SMC Zones
Order Block (OB):
Bullish Order Block (OB1, July 13, ~$2.320 - $2.325): This area is a significant Bullish OB that initiated a strong upward movement. It was tested and held on July 13.
Bullish Order Block (OB2, July 17, ~$2.330 - $2.335): Potential Bullish OB formed after the bearish retracement. The price reacted positively to this zone on July 17-18.
Bearish Order Block (OB3, July 15, ~$2.360 - $2.365): This area is a Bearish OB that initiated significant downward movement after the liquidity sweep.
Fair Value Gap (FVG) / Imbalance:
FVG1 (Bullish, July 13, ~$2.345 - $2.355): A large FVG formed during bullish expansion and partially mitigated.
FVG3 (Bullish, July 18, ~$2.350 - $2.355): A new FVG formed during the recent bullish bounce and has not been fully mitigated, potentially acting as a "price magnet."
Premium/Discount Area:
For the swing from the low on July 13 (~$2.320) to the high on July 15 (~$2.370), the Equilibrium (EQ) is around $2.345. The price traded in the Premium Zone (above $2.345) from July 14 to July 15. After CHoCH, the price dropped to the Discount Zone (below $2.345) on July 16-17.
Liquidity Pool:
A significant liquidity sweep occurred above the "Strong High" ($2.370) around July 15, at 14:00 UTC, before a sharp reversal and bearish CHoCH.
Liquidity below the "Weak Low" ($2.320) was also swept around July 17, at 10:00 UTC, preceding the recent bounce.
C. Volume Analysis
The bullish BOS on July 13 was accompanied by a significant spike in trading volume, confirming the strength behind the breakout.
Bearish CHoCH and liquidity sweep on July 15 also showed a significant volume spike, validating the market momentum shift.
Overall volume was moderate during consolidation and surged during impulsive movements and key structural breaks, consistent with SMC principles.
D. Supporting Traditional Technical Patterns
The liquidity sweep above the "Strong High" on July 15, followed by a sharp reversal, is a classic "Fakeout" or "Bull Trap" in traditional technical analysis, perfectly aligning with the SMC liquidity hunting concept.
The subsequent price action after CHoCH (July 15-17) shows a series of lower highs and lower lows, forming a downtrend channel, reinforcing the bearish structure identified by SMC.
Potential Opportunities/Signals (SMC-based for PAXG)
From this 1-hour SMC analysis, here are some "signals" that can be acted upon:
Entry Opportunity at Bullish Order Block (OB2): Watch for entry opportunities at the Bullish Order Block around $2.330 - $2.335 (OB2) after confirming the minor bullish CHoCH that occurred on July 18. The first target is the mitigation of FVG at $2.350 - $2.355 (FVG3), with potential continuation towards the untested Bearish Order Block at $2.360 - $2.365 (OB3).
Potential Decline After Liquidity Sweep (Reversal Setup): If a clear liquidity sweep occurs above the $2.370 level (Strong High) or previous high area that has not been swept, watch for significant bearish CHoCH potential. If confirmed, the potential decline back to the discount zone or bullish Order Block that has not been mitigated below, for example, $2.330 (OB2).
Reversal from Liquidity Sweep (Bounce Play): After a liquidity sweep below $2.320 (Weak Low on July 17), as has occurred, watch for potential upward reversal. The nearest target is the unmitigated FVG above, such as $2.350 (FVG3), and then the potential retest to the Bearish Order Block at $2.360 - $2.365 (OB3).
FVG as Price Magnet (Target Identification): A large FVG has formed above $2.350 (FVG3, formed July 18) which has not been fully mitigated. This FVG has the potential to become a strong price magnet target if bullish momentum returns.
Price Reaction at Bearish Order Block (Short Opportunity): Watch the price reaction around the Bearish Order Block formed on July 15 at $2.360 - $2.365 (OB3). If the price returns to this zone with low volume or shows strong rejection, this could be a short opportunity towards liquidity at $2.320 (Weak Low) or the Bullish Order Block at $2.330 (OB2).
Conclusion & Outlook
Last week's PAXG price action was characterized by short-term structural shifts and volatility, occurring amid a highly bullish crypto market. Integrating macro analysis (institutional inflows, pro-crypto regulations) with micro SMC analysis (BOS, CHoCH, liquidity sweep) is key to understanding this dynamic. Despite the internal bearish shift, overall market strength likely prevented deeper declines, leading to faster recoveries. PAXG, with its unique position as a gold-backed crypto asset, is likely to continue showing price action dictated by overall crypto market sentiment and its own internal Smart Money concepts.
Don't miss out on other analyses every week! Click the widget below to see PAXG charts in real-time and discover your trading opportunities. Also share in the comments: what is your favorite SMC setup this week?
#PAXG #CryptoAnalysis #WEEKLY_ANALYSIS
Disclaimer: This analysis is informative and not financial advice. Trading crypto assets carries high risk. Always do your own research.
