Hello crypto warriors, whether you are just starting out or have begun to explore! Have you ever wondered how the "experienced" traders can see potential price movements before they actually happen? One of their secrets lies in something called Depth of Market (DoM), or often referred to as the Order Book.
Don't panic at its technical-sounding name! Think of this DoM as a "window" displaying the buying and selling intentions of all market participants in real-time. If you've ever been to a traditional market, imagine it like seeing all the shopping lists and goods that will be sold, complete with quantities and prices. Interesting, right? Let's break it down slowly!
Why is DoM Important for Beginners? 🤔
You might be thinking, "But there are price charts, isn't that enough?" True, price charts show what has already happened. But DoM? It shows what is being prepared!
By understanding DoM, you can:
See Real Support and Resistance: Technical indicators are indeed important, but DoM shows the real "walls" of buy (bid) or sell (ask) orders in large quantities. This can be a strong support (price floor) or resistance (price ceiling) level.
Peek at Buyer and Seller Strength: Are more people wanting to buy or sell at a certain price? DoM will display the "strength" on both sides.
Understand Market Liquidity: How easily can you buy or sell crypto without causing the price to spike or plummet drastically? DoM shows how deep the market is. The more orders at various prices, the more liquid the market.
Unpacking the Contents of Your "Window" of DoM 🔍
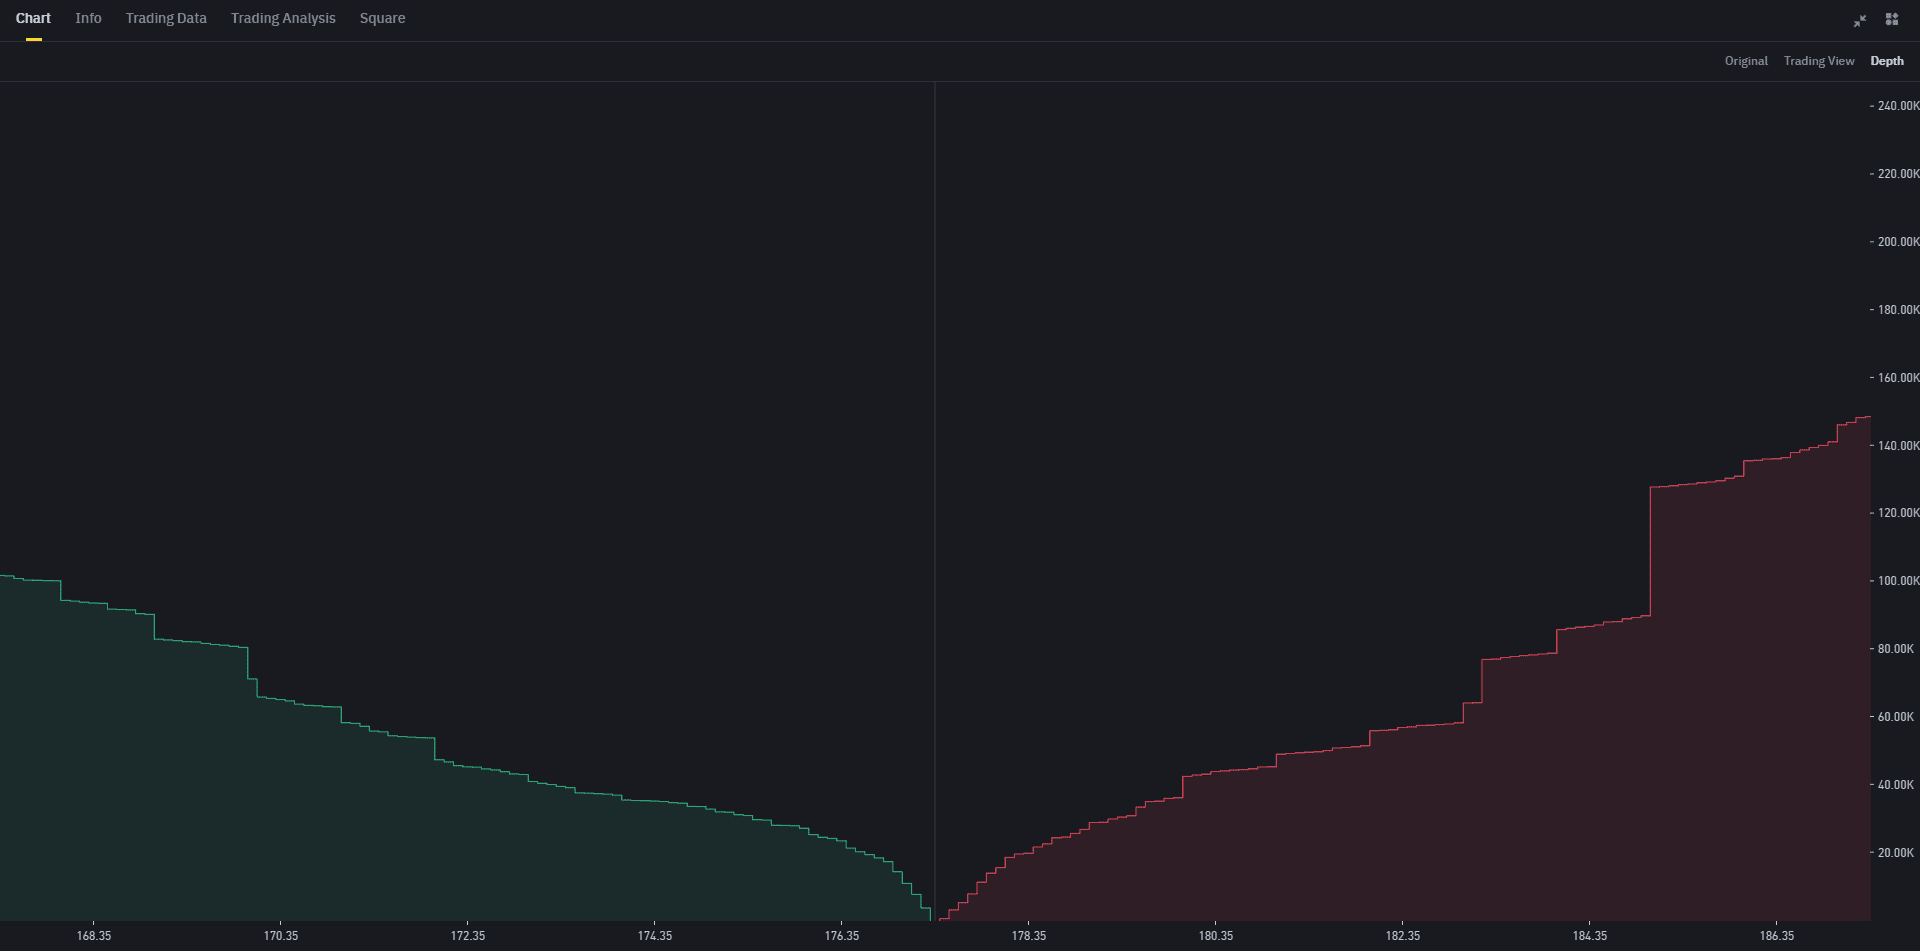
When you open the Depth of Market section on Binance (or another exchange), you will see two main columns:
Left Side (Green): Buy Orders (Bids) 🟢
This is a list of orders from people who want to BUY crypto assets at a certain price. The number above (close to the market price) is the highest price that buyers are willing to pay. The further down you go, the lower the price they are offering. The amount next to the price shows how many assets they want to buy at that price.Right Side (Red): Sell Orders (Asks) 🔴
This is a list of orders from people who want to SELL crypto assets at a certain price. The number above (close to the market price) is the lowest price that sellers are willing to accept. The further up you go, the higher the price they want. The amount next to the price shows how many assets they want to sell at that price.Middle: Last Price (Spread) ⚖️
Between the buy and sell orders, you will see the last price where trading occurred. The distance between the highest buy price and the lowest sell price is called the spread. The smaller the spread, the more liquid the market.
How to Read Signals from DoM? 🚦
Okay, now for the exciting part! Let's try to read some simple "signals" from DoM:
"Order Wall":
If you see a large stack of buy orders (big green numbers) at a certain price below the current price, it could be a strong support zone. The market may find it difficult to break below that level.
On the contrary, if there is a large stack of sell orders (big red numbers) at a certain price above the current price, it could be a strong resistance zone. The market may find it difficult to break above that level.
Example: Imagine the current price of BTC is $65,000. Suddenly you see there are 100 BTC ready to be bought at $64,500. This is a fairly large "wall" and could serve as temporary support.
Supply & Demand Balance:
Pay attention to whether the total number of buy orders is much larger than sell orders, or vice versa. This can give a rough picture of the overall market sentiment. If the buy side is "thicker", there is potential for the price to rise (because many want to buy).
However, be careful! This is not an absolute benchmark. Orders can be "fake" or canceled at any time.
Important Limitations and Warnings! ⚠️
Like other analytical tools, DoM also has limitations:
Manipulation (Spoofing): Some large traders can place large orders just to scare or bait other traders, then cancel them at the last minute. Don't fully trust the "walls" of orders that suddenly appear and disappear.
Only Intent, Not Action: DoM only shows the intent to buy or sell. Actual transactions only occur when those orders are filled (executed).
Quickly Changes: The crypto market moves very fast. DoM can change in seconds.
Your Real Action Now! 💪
Don't be afraid to start looking at the Depth of Market on Binance. You can search for popular coins like BTC, ETH, or SOL and try to observe the Order Book.
Start by observing:
Where is the largest stack of orders?
How does the strength comparison between the buy and sell sides look?
Remember, this is a complementary tool. Always combine DoM analysis with price chart (technical) analysis and news (fundamental) analysis for a more complete picture.
Important Disclaimer: This content is purely educational and should not be considered as investment advice. The crypto market is very volatile, and you are fully responsible for your investment decisions. Always conduct Your Own Research (DYOR) before making trading decisions.
What do you think, does this Depth of Market make you interested in learning more? Share your thoughts in the comments! 👇
#CryptoTrading #MarketAnalysis #DepthOfMarket #OrderBookAnalysis #BinanceSquare