This week, Bitcoin surged over 300% from its lowest point, reaching $122,000. However, as large whale activities triggered a wave of selling pressure, the initial excitement quickly gave way to caution. On the daily chart, Bitcoin strongly broke through the resistance level between $112,000 and $114,000, driven by volume.
All major moving averages, including the 50-day moving average at $107,800 and the 200-day moving average at $97,000, are significantly above the price. After this typical breakout, a strong bullish momentum should have emerged. However, it is now facing fundamental resistance. In particular, the notorious whale responsible for the 80,000 BTC wallet has begun transferring funds to the over-the-counter trading platform Galaxy Digital.
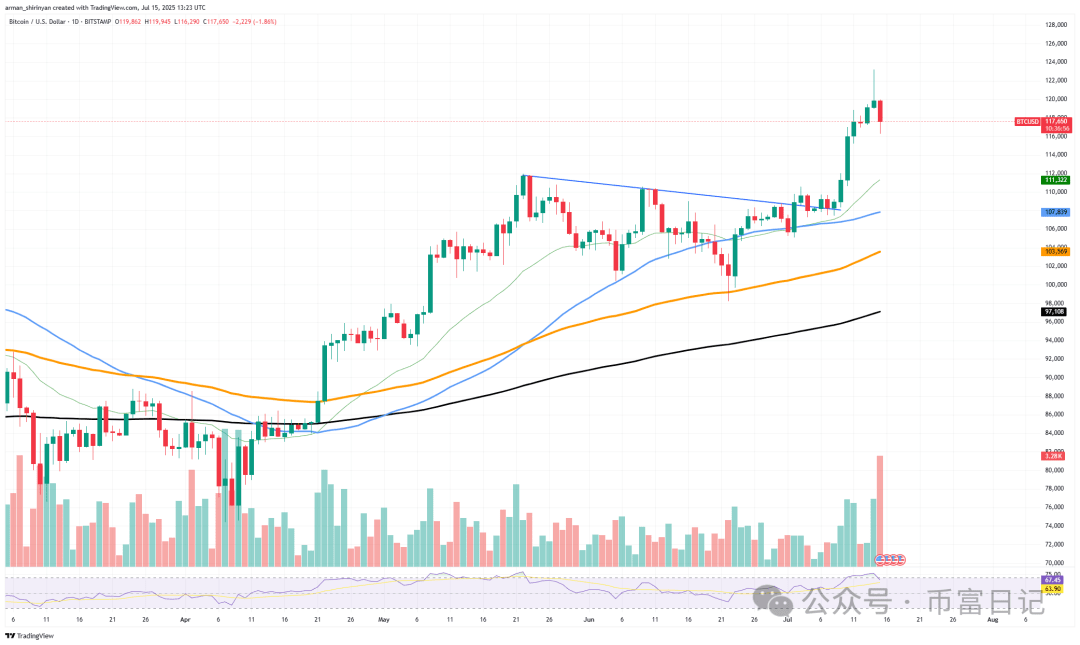
Currently, there are 16,843 Bitcoins (approximately $2 billion) ready for sale. Even before most of this liquidity has entered the market, the mere act of transferring Bitcoin triggered a strong reaction: a wave of defensive selling appeared on the spot exchanges, causing the price of Bitcoin to drop instantly by over $6,000 each. This is precisely the issue with Bitcoin's low circulation rebound mechanism: when large holders choose to cash out, volatility intensifies, and liquidity quickly evaporates.
Due to the anticipated selling by whales, panic selling led to a 300% surge in Bitcoin's daily trading volume. From a technical perspective, Bitcoin is still above the short-term support level, with a daily trading volume of approximately $111,000. However, as indicated by the reversal around $122,000, buyers are withdrawing in real-time. If Galaxy Digital begins executing the full sell-off, the subsequent decline may test the range of $107,000 to $110,000.
Although Bitcoin's long-term upward trend remains intact, the possibility of a quick reversal is still high, and weeks of continued accumulation may be replaced by a large seller. As the market processes this $2 billion liquidation, traders should closely monitor the further movements of whales and prepare for more explosive volatility.
Ethereum is being suppressed.
Although Ethereum's breakthrough of $3,000 in paper price seems exciting, the actual trend is not optimistic. Less than 24 hours after breaking this key psychological barrier, ETH fell below it, currently trading around $2,980. The bulls have not broken through $3,000, and this rapid reversal is evidence of that. The situation on the daily chart is clear: after a significant rise from the $2,600 to $2,800 range, ETH produced several candles under high trading volume before facing immediate selling pressure. The inability to maintain high levels and the appearance of rejections indicate that traders are eager to lock in profits, and their buying impulse has faded. The broader market environment exacerbates this issue. When Ethereum attempted to break through, Bitcoin dropped several thousand dollars, indicating that its volatility has been affecting Ethereum's market popularity. This correlation drag and overbought condition (RSI close to 70) intensified every intraday drop.
As the technical aspects of ETH remain above all major moving averages, its long-term structure still exists. The 200-day moving average ($2,474) and the 50-day moving average ($2,587) are both significantly below the current price and can serve as buffers for a larger pullback. However, the failure of ETH to hold the $3,000 support level is a warning signal; if buyers do not quickly reorganize, momentum may retreat to the $2,800 consolidation area.
Ethereum must retest and close above $3,000 with high trading volume to maintain its upward trend, which it failed to do on its first attempt.
Shiba Inu Denial.
The Shiba Inu Index (SHIBA INU) experienced one of the most absurd false breakouts in recent trading history, leading traders to wonder whether its price movement is genuinely occurring or deliberately orchestrated to attract later buyers. In the past week, SHIB's breakout attempt seemed promising but ultimately rebounded close to the key resistance area near the 200-day moving average (the black line on the chart).
However, the rebound almost immediately stalled, rather than confirming a trend reversal. From a technical perspective, an important warning signal is the inability to close above the 200-day moving average. Since the beginning of January, this level has consistently acted as a ceiling, preventing all attempts to rebound and pulling bullish sentiment back to square one.
In this recent attempt, the price briefly broke through the $0.000013 area, but with the rise in volume, the price quickly reversed, which is a typical distribution signal rather than an accumulation signal. There is a clear pattern here. For weeks, SHIB has been consolidating in a narrow range between $0.000011 and $0.0000125.
The unexpected surge attracted those who were previously on the sidelines, believing that a larger breakout was imminent. It now appears that this move was suspiciously aimed at increasing liquidity extraction from large holders exiting, as there was no follow-up buying, and it was immediately rejected. The result is evident: a loss of confidence in a sustained reversal, and momentum is destroyed.
As the RSI indicator has retreated from the overbought zone, the price is hovering again near the previous support level. If SHIB fails to maintain above $0.0000122 in the coming days, it may further retrace to $0.000011 or even worse. In other words, without confirmation of a breakout and staying above the 200-day moving average, there is no reason to believe this is just a timely false breakout. Unless actual buying volume sees an unexpected surge, the likelihood of a significant reversal for Shiba Inu is minimal.


