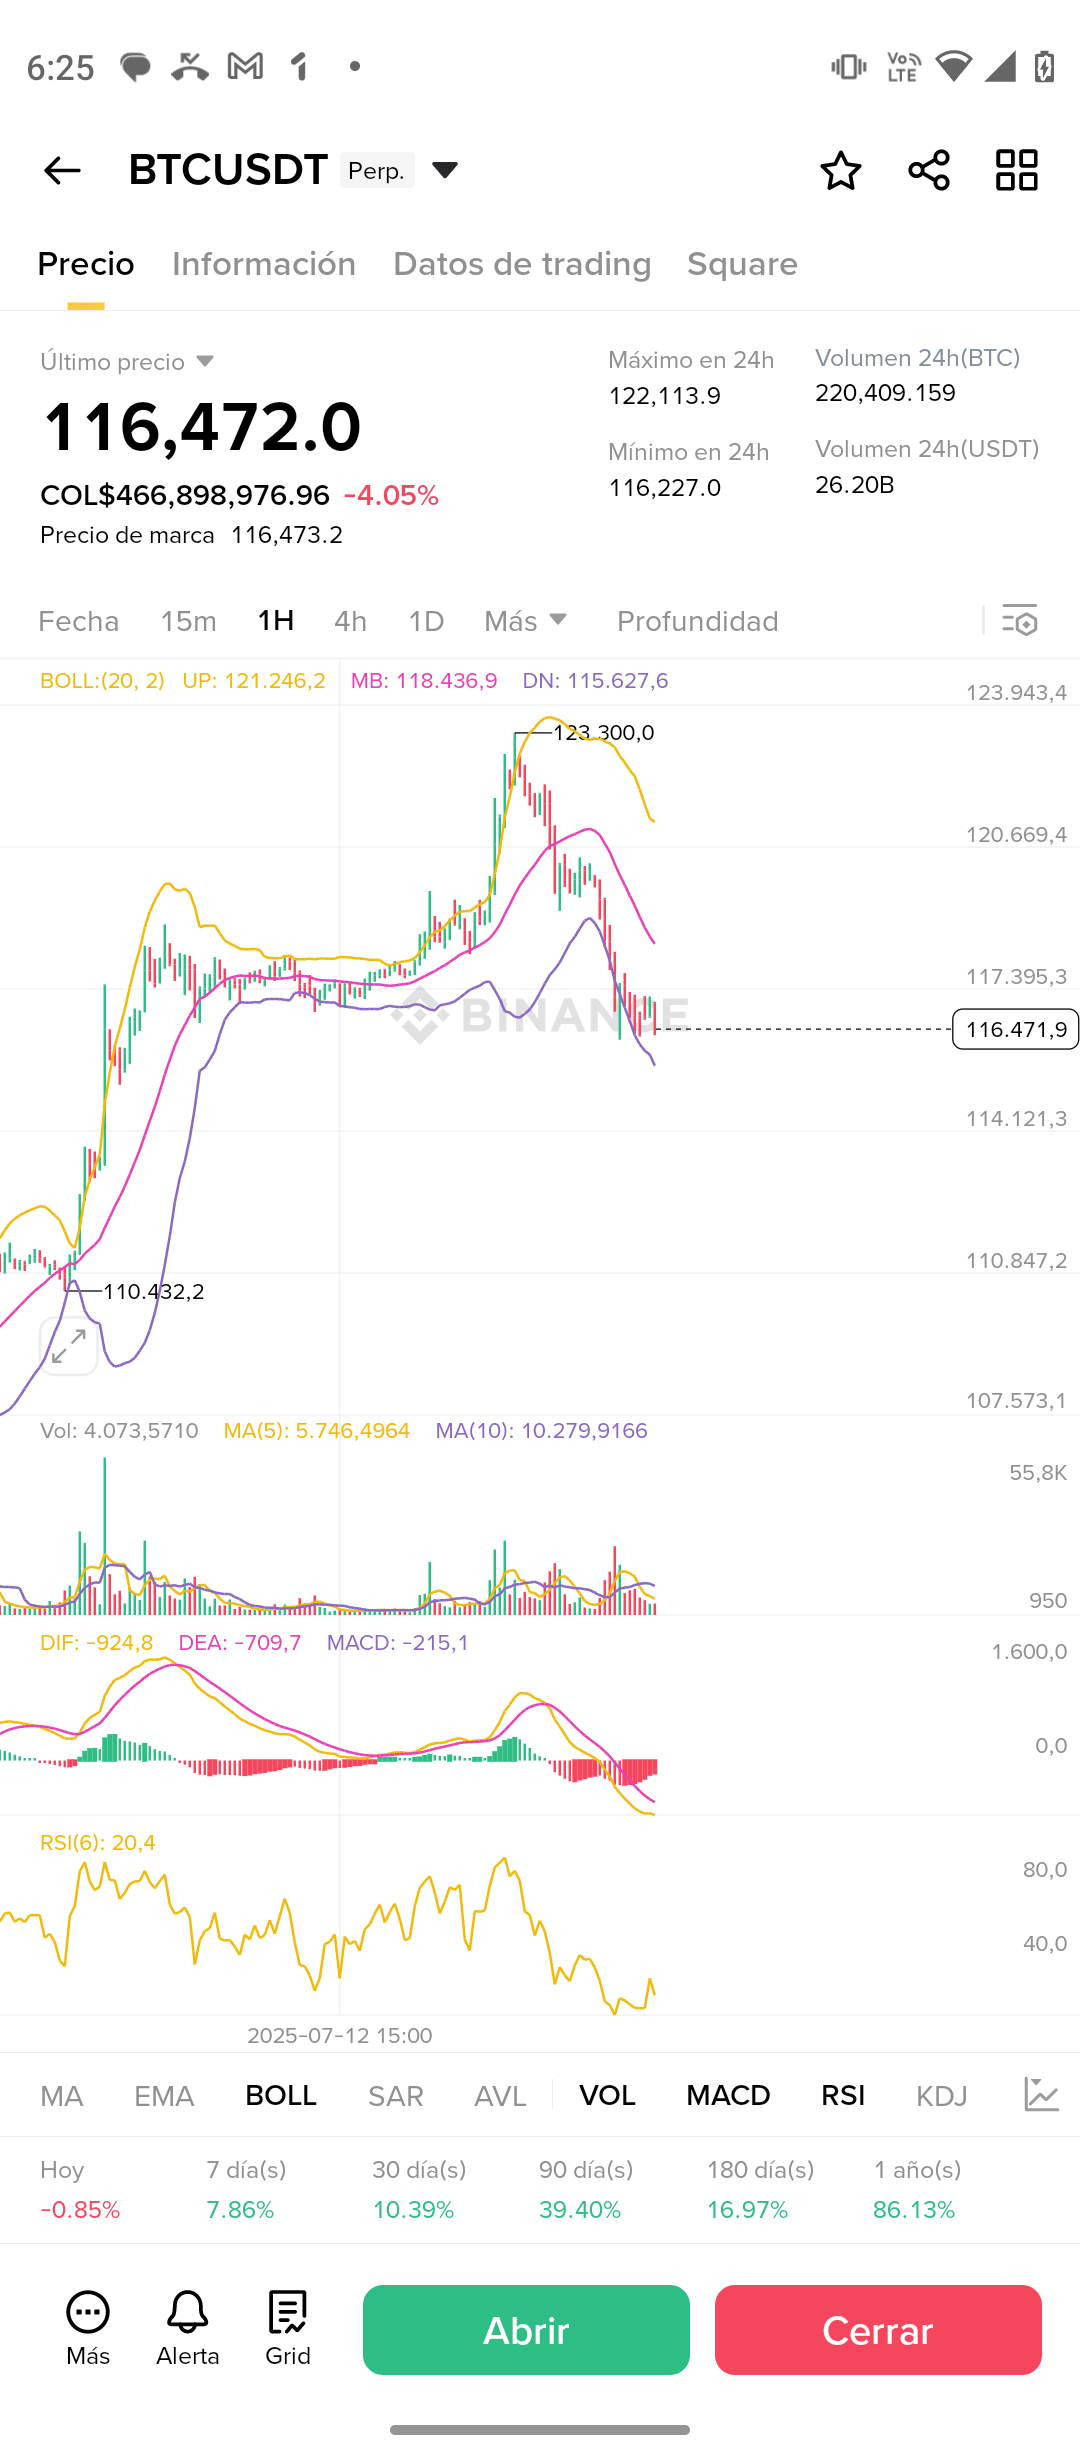
$BTC shows resistance: despite a 4.05% drop from the record of $123k, it remains above $116k. This behavior reflects that the current correction may be temporary, with key support levels at $102–101k that TelChain and RLinda highlight as fundamental for the bullish rally to continue.
🧠 Quick technical analysis
Bollinger Bands: with tight bands after the surge to the upper ceiling ($121k–123k), $BTC enters a daily consolidation phase observed in the image.
MACD and RSI: the MACD is heading towards the zero line; RSI in neutral zone (~58). Mixed signals suggest waiting for clear confirmation before trading futures.
🌍 Current related news
During the start of Crypto Week in the U.S., the price of Bitcoin fell by 5% due to profit-taking after the all-time highs. Meanwhile, lawmakers are debating three key bills (#CLARITY, #Anti‑CBDC, #GENIUS), which, if passed, would strengthen institutional capital and regulated adoption.
✅ What can you do?
1. Enter in isolated margin, maximum leverage 3×, with stop loss below $102k.
2. If $BTC rebounds consistently at $101–102k, you could start a short or long position depending on your strategy.
3. Manage risk, take advantage of spreads, and act when there is confirmation: push upward with a daily close above $119k.
📌 Secure invitation
Discover my daily analyses, red envelopes with free cryptocurrencies, and the NómadaCripto profile on Binance Square:
👉 Square Profile: https://app.binance.com/uni-qr/cpro/nomadacripto?l=en-US&r=12765915&uc=app_square_share_link&us=copylink
🎁 Claim your red envelopes, they are now available!
➡️ If you haven't followed me yet, do so now to receive my daily trading strategy and not miss any opportunity.
