Hello friends, is the market making you excited lately? 🎉#BTC再创新高
That's right, Bitcoin (#BTC ) surged to an all-time high of $123,218 on July 14, with a market cap exceeding $2.4 trillion, causing a stir in the entire crypto sphere!#ETH突破3000
But just as everyone is shouting for "13,000" and targeting "15,000," on-chain data, whale movements, and the price differences between futures and spot, along with several sudden liquidation waves, have subtly changed the market's tone.
Today, we will comprehensively analyze the potential risks and opportunities behind this wave of BTC's rise, to see whether it is a "temporary cooling off" or a "new round of accumulation"? 📊
Whether you are holding and observing or gearing up to bottom-fish, reading this will give you insight into the upcoming trend.
📈 After the ATH, inflows to exchanges surged: are short-term chips being realized?
After Bitcoin broke through $123,000, CryptoQuant data shows that the amount of BTC flowing into exchanges suddenly surged, especially into centralized spot exchanges.
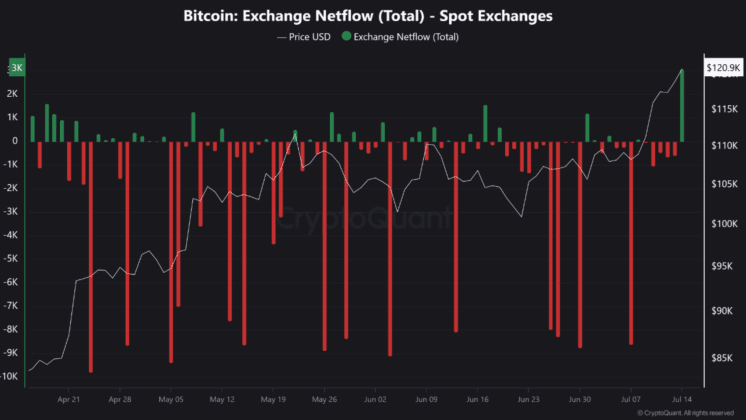
What does this mean?
👉 It is likely that some short-term holders, and even some whales, have begun to realize profits at high levels.
According to analyst Tarekonchain, this on-chain capital flow pattern is a common "profit-taking + healthy pullback" signal after significant rises in Bitcoin's history.
In previous upward trends, similar situations have also occurred near the peaks: a wave of increases, some funds secure profits, and prices enter a consolidation zone or gently drop.
He pointed out:
"This does not mean a trend reversal, but it does mark the beginning of a short-term 'cooling off.' Especially for those with swing capital, they are more likely to exit first."
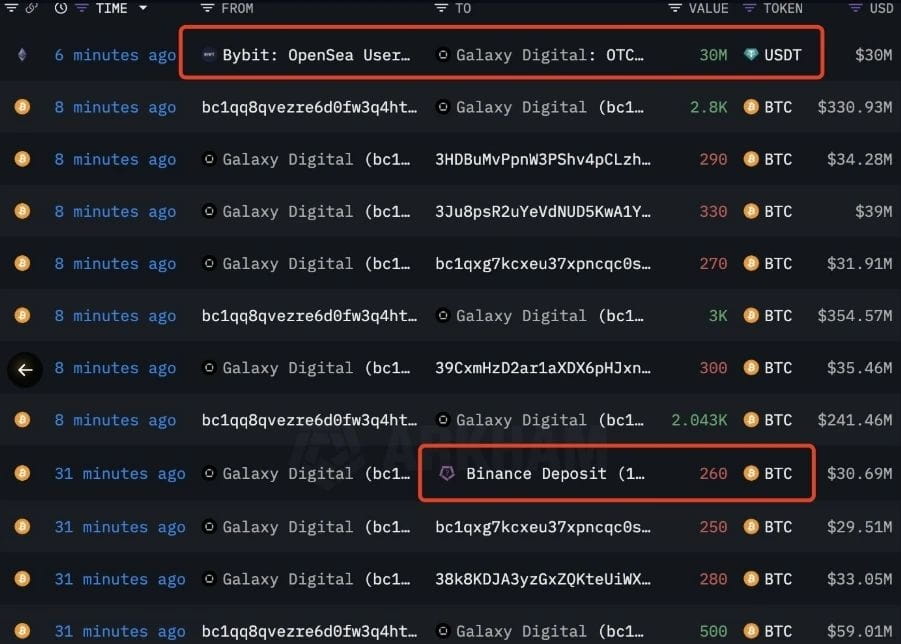
🐋 Whales are moving: Binance received 1,800 BTC; what does it imply?
On the other hand, whales have also started to make frequent moves. CryptoQuant contributor Crazzyblockk pointed out:
Recent whale deposit activities on Binance have surged.
Single-day inflows reached 1,800 BTC.
Over 35% of the transfer values exceeded $1 million.
Why are whales transferring coins to exchanges?
This usually indicates two scenarios:
Preparing to sell—having likely made a substantial profit, it is time to lock in gains.
Strategic hedging/new positions—using Binance's liquidity for hedging and opening leverage to prepare for the upcoming volatile market.
Regardless of the type, whale actions on-chain are worth noting because:
Their actions often precede market trends
Emotional changes can trigger a herd effect
So, beneath this wave of increases, the surface appears optimistic, but deep waters are already adjusting their positions.
⚠️ Liquidation data surged: Long positions were liquidated for over $34 million.
On July 15, Bitcoin experienced a sharp short-term plunge. Within just one hour, Coinglass data showed:
The total market saw approximately $89.61 million liquidated.
Among them, BTC longs were liquidated for over $34 million.
This wave of declines directly "ignited" the market's high leverage risk, especially the sudden sell-off by long-term holders known as "ancient whales," which was the trigger.

👉 What does long liquidation indicate?
Leverage is too heavy.
The market's chasing sentiment is overheated.
Old players are starting to "throw bombs," testing the market's absorption capacity.
These rapid liquidations have a significant impact on short-term sentiment, but are not necessarily bad for long-term trends—because each such fluctuation washes away weak hands, making the future market healthier.
🧠 Looking at chip distribution to find potential support: key zones have emerged.
Let's take a look at the underlying data—Bitcoin's chip distribution at different price levels, which can tell us where support and resistance lie.
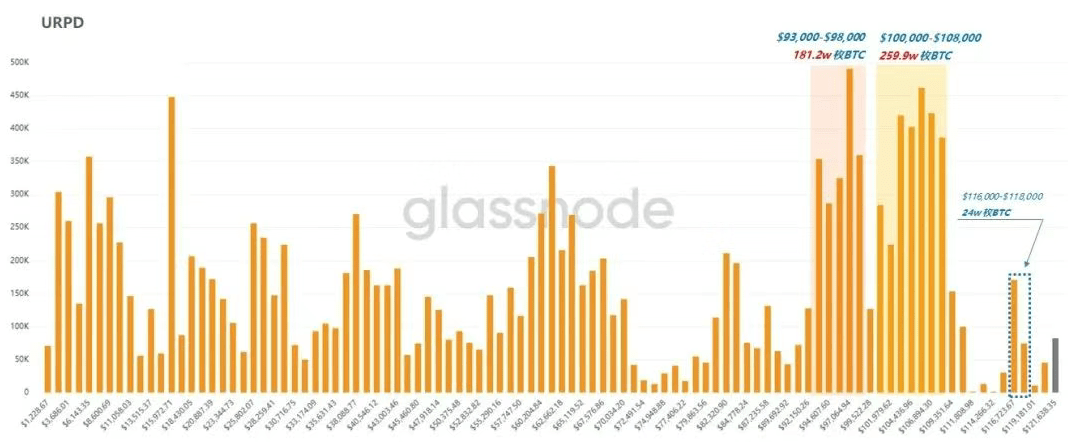
Latest data reveals:
In the $116,000 - $118,000 range: a turnover of 240,000 BTC occurred, indicating that many players chose to "sell here."
But more importantly:
In the range of $93,000 - $108,000, there are still over 4.4 million BTC untouched.
Accounting for as much as 22% of the total circulating supply.
This area forms a super dense chip zone, which can also be seen as the market's ironclad support zone.
Two possible paths:
Quickly breaking above the dense chip zone
→ The market enters a new phase, with less resistance for further increases.Consolidation or fluctuations stalling in this range for too long
→ Chips loosen, making the market prone to repeated fluctuations, even retracements.
Currently, the market leans more towards the former, but whether there is enough buying support still depends on the continued inflow of capital.
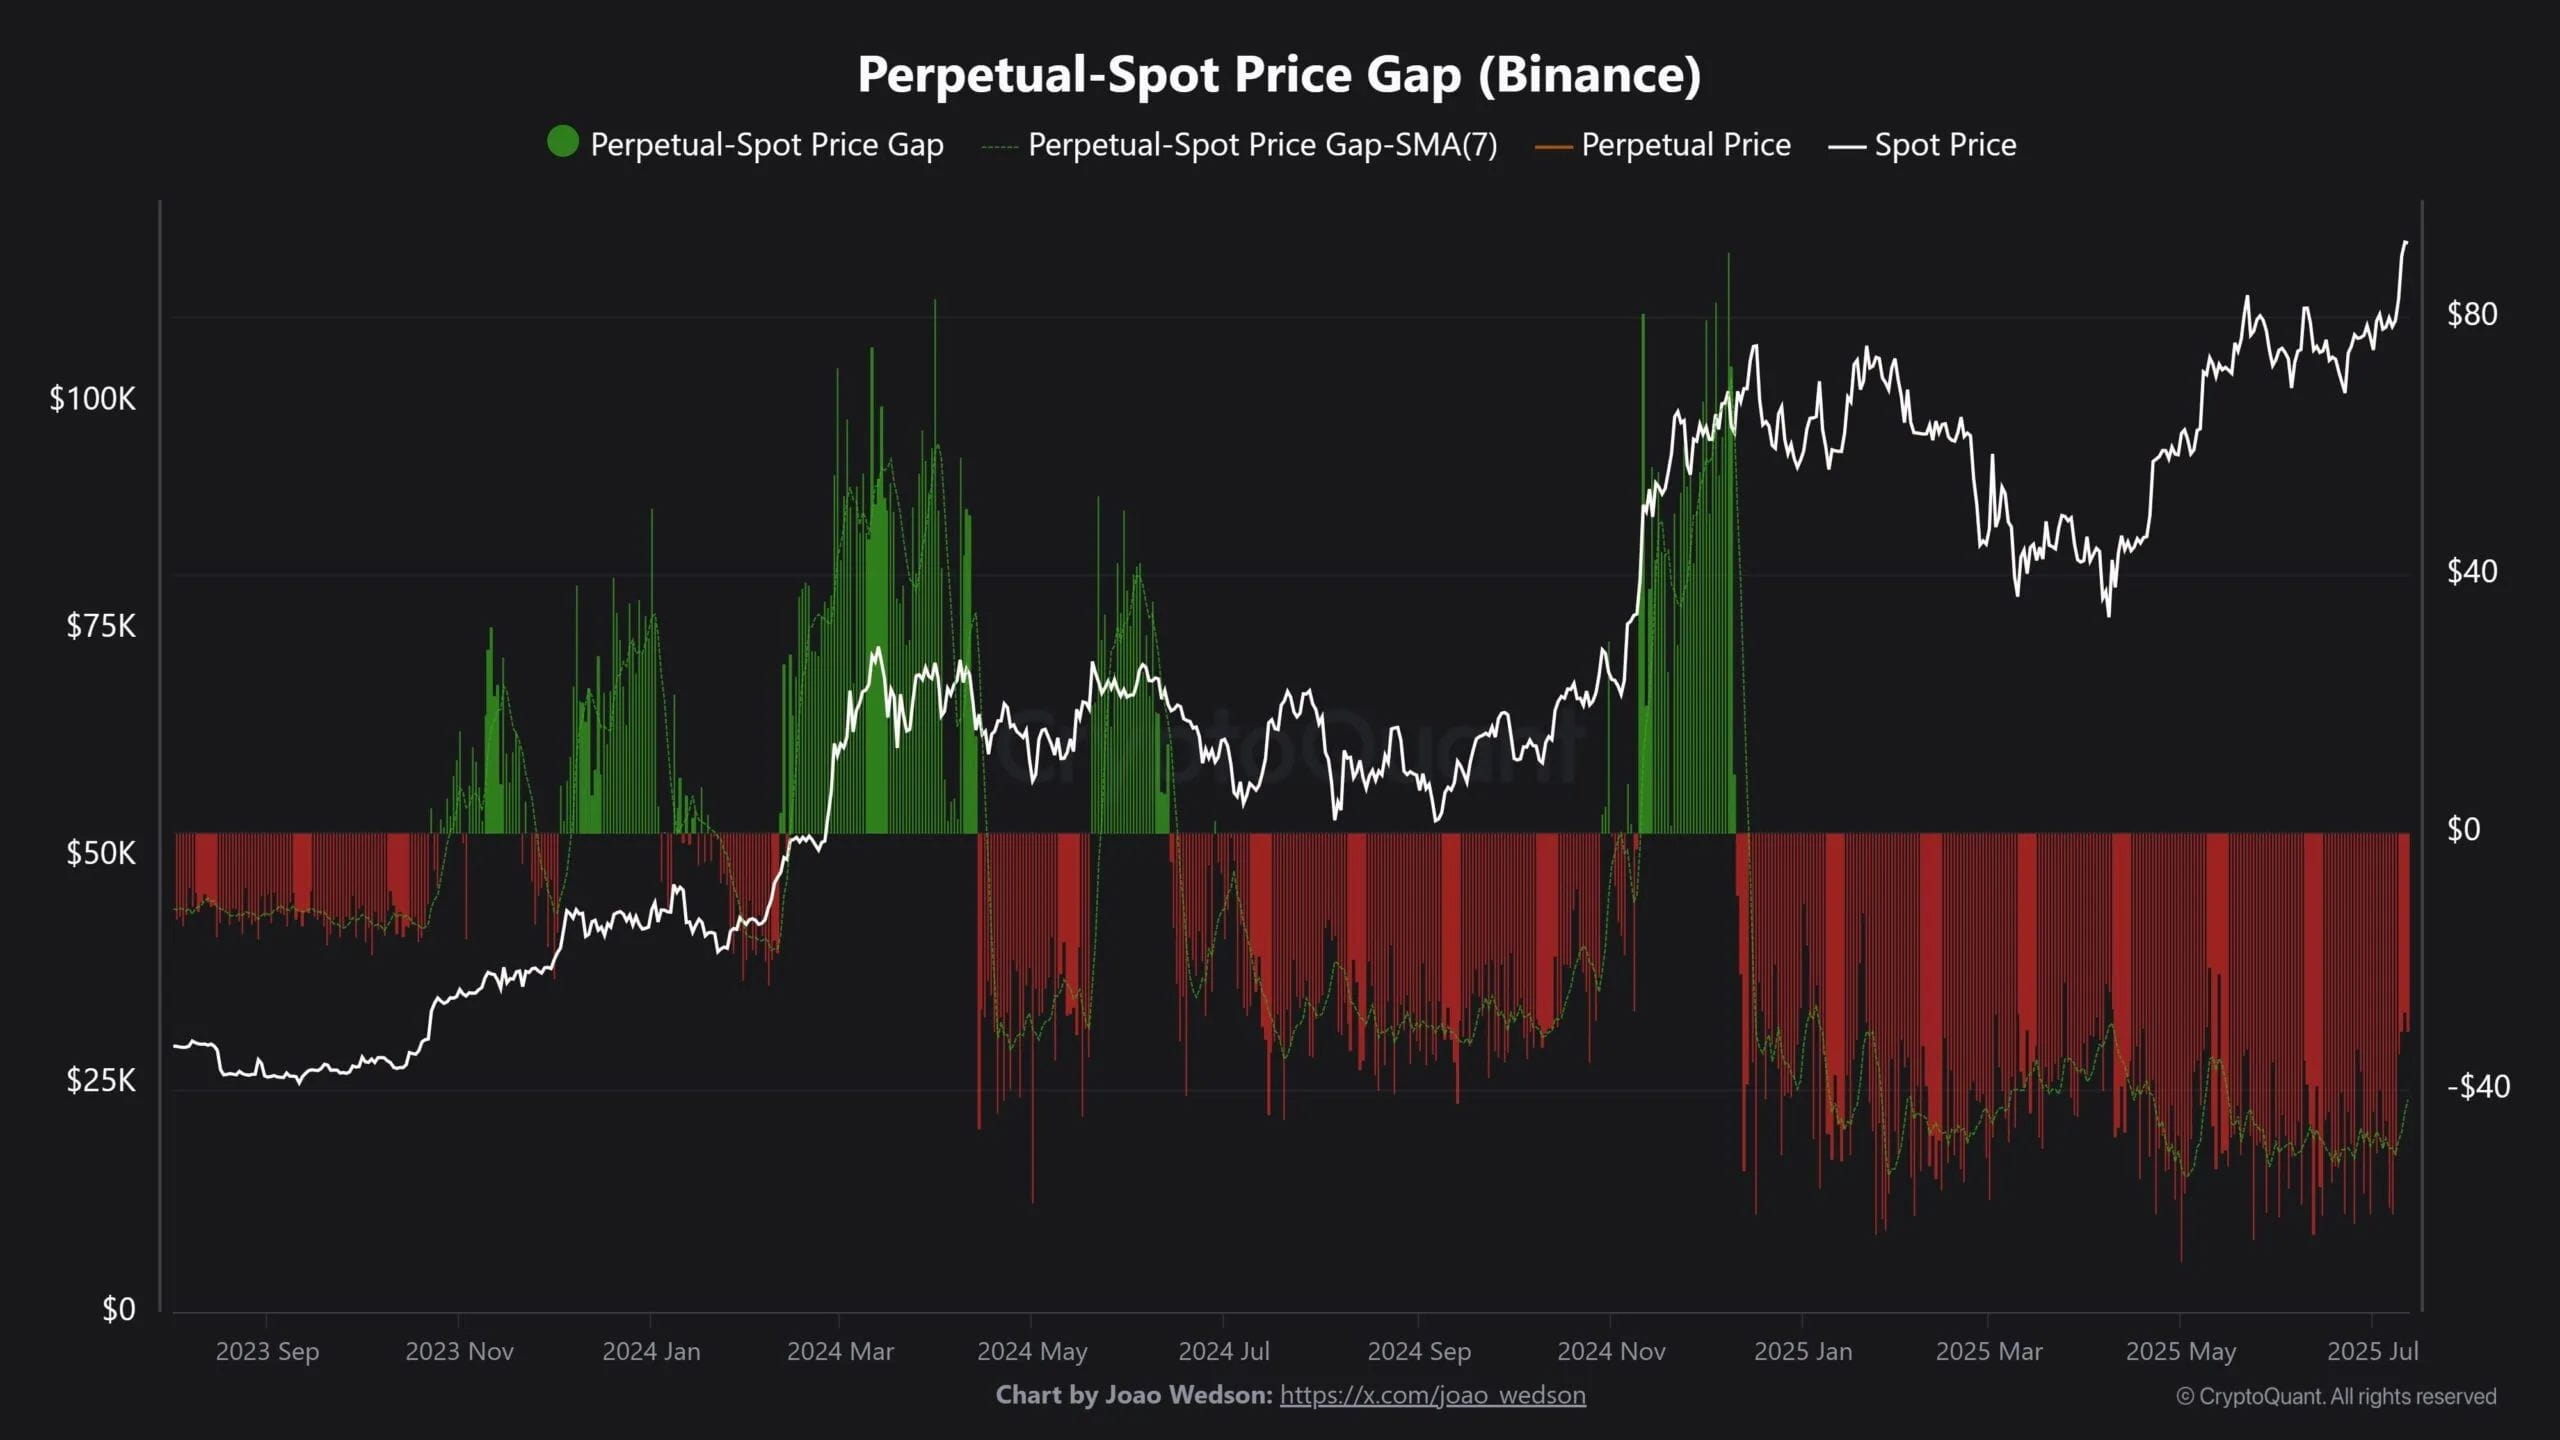
💡 Spot ETFs attract capital, and the changes in the spot-futures price difference provide clues.
Don't forget the ETF inflows—during the week ending July 11, the inflow for spot Bitcoin ETFs reached $2.72 billion, indicating that institutional interest has not waned.
And the derivatives market is also starting to show "warming up" signals.
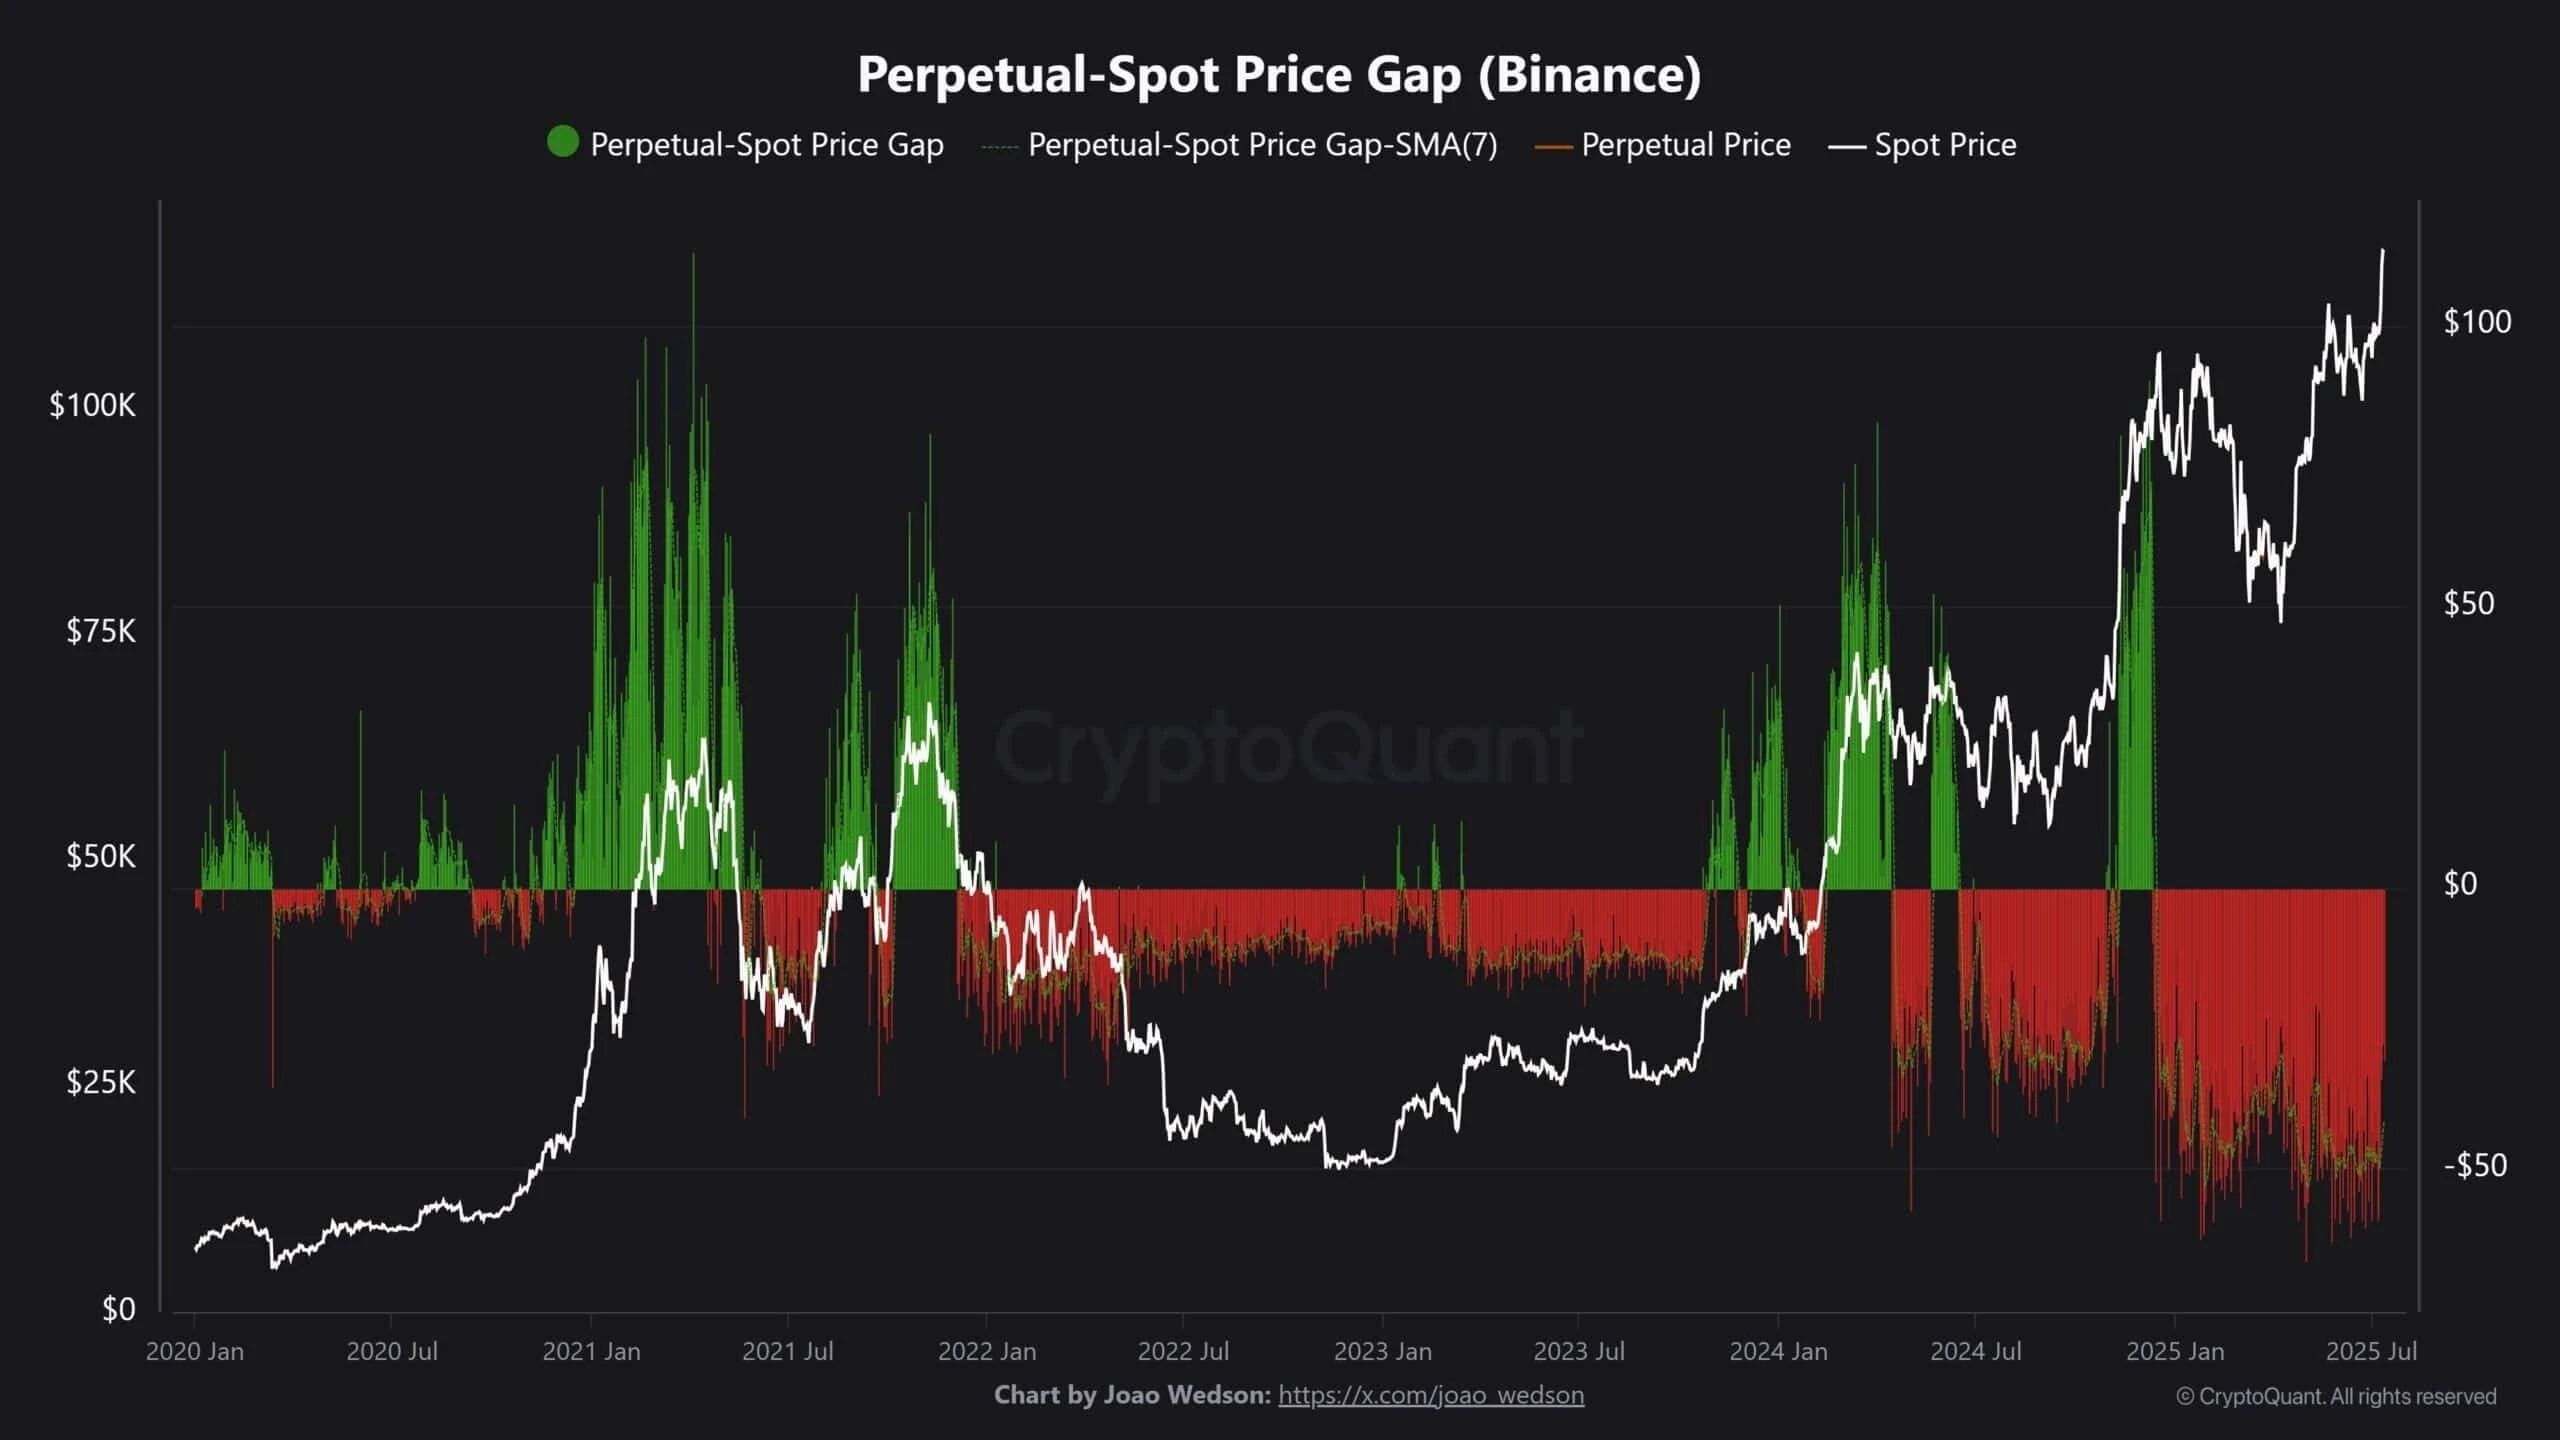
Although the basis (price difference) between Binance's futures and spot prices is still negative, it is rapidly narrowing.
Usually, this gap turning positive is a precursor to a Bitcoin bull market sprint.
For example:
At the end of 2020 and the beginning of 2021, when BTC broke through $20,000 and $50,000, the spot market led the rise, followed by a positive basis in futures, igniting a parabolic increase.
👉 The current trend feels familiar.
As long as the bullish sentiment in the futures market gradually recovers, this "slow bull" may be the prelude to the next "fast bull."
📉 A slight pullback ≠ reversal; the bull market is far from over?
Overall, despite recent developments:
Whale transfers
Liquidation explosion
Chip changes
Inflow to exchanges
All of these have released pressure signals in the short term, but:
✅ On-chain data shows that long-term holders remain steadfast.
✅ ETFs are continuously attracting capital, and institutional attention in the market is high.
✅ The derivatives market has not yet overheated.
✅ Retail participation is still low, with no feeling of FOMO madness.
In other words, this may just be a washout wave within a bull market, not the end of the trend.
✅ Final notes: How to operate next?
👀 If you are a long-term investor:
Congratulations, the trend is still there; the fluctuations are just a washout.
It's reasonable to raise the profit-taking line, but don't easily go short.
📉 If you are a short-term trader:
Currently, it is a high-level consolidation period, making operations more difficult.
It is advisable to reduce leverage and wait for a clear direction before making a move.
🛡 If you're waiting to get in on a pullback:
Watch for whether a bottom support is forming around 115,000
If BTC quickly falls back to $108,000 - $110,000, it could be an excellent buying point.
🧭 To summarize in one sentence:
"The bull is still here, just taking a breather."
The next few trading days are crucial; don't let short-term fluctuations scare you out of the market, and avoid blindly chasing after prices.
Whales are moving, the market is changing; savvy you should focus on the data and patiently position yourself to be the real winner 💪✨
✍️ DYOR, manage risk well, and may everyone set sail in the crypto world! 🌊
🔁 Feel free to like and share with your crypto friends, and don't forget to follow me for more insights into the latest developments in the crypto world!
💬 If you have any projects to discuss, feel free to join us! Let's explore the crypto world together and cheer each other on 😎


