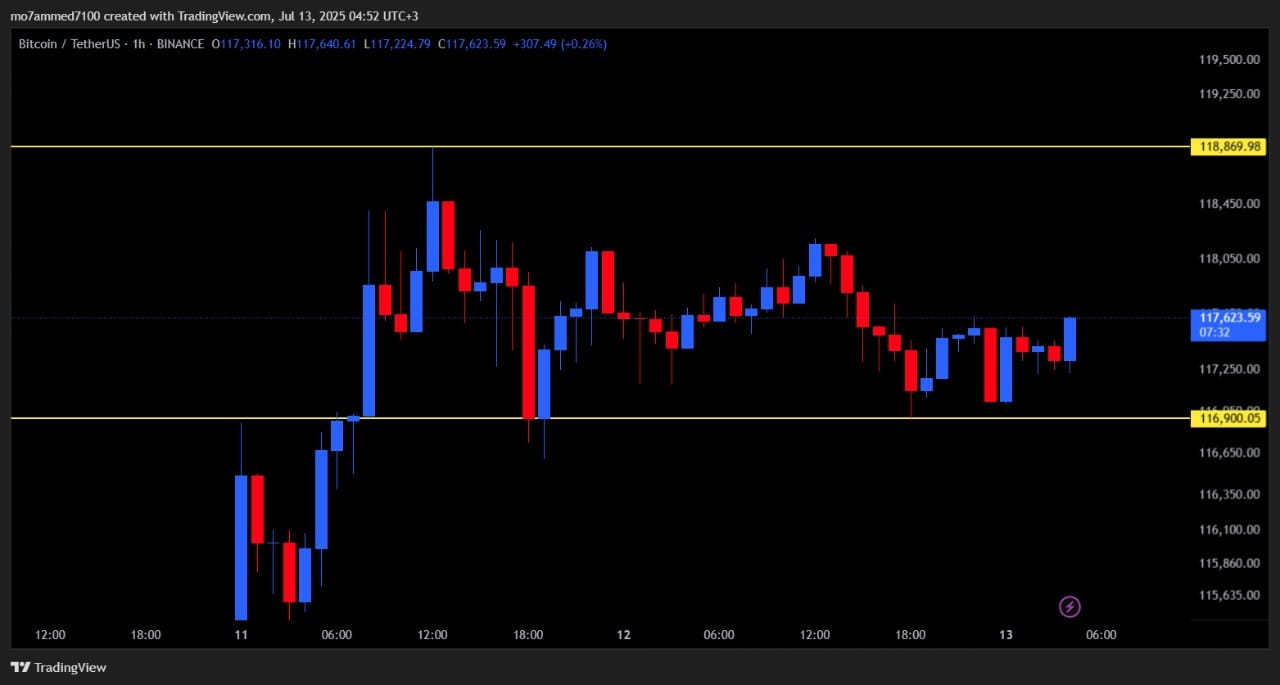
A quick overview of Bitcoin's performance: The price has stabilized around $117,500, after reaching a daily peak of $118,869 and recording a low of $116,900 within 24 hours. Despite a slight decline of -0.04%, the overall trend remains clearly upward.
The technical indicators show strong momentum
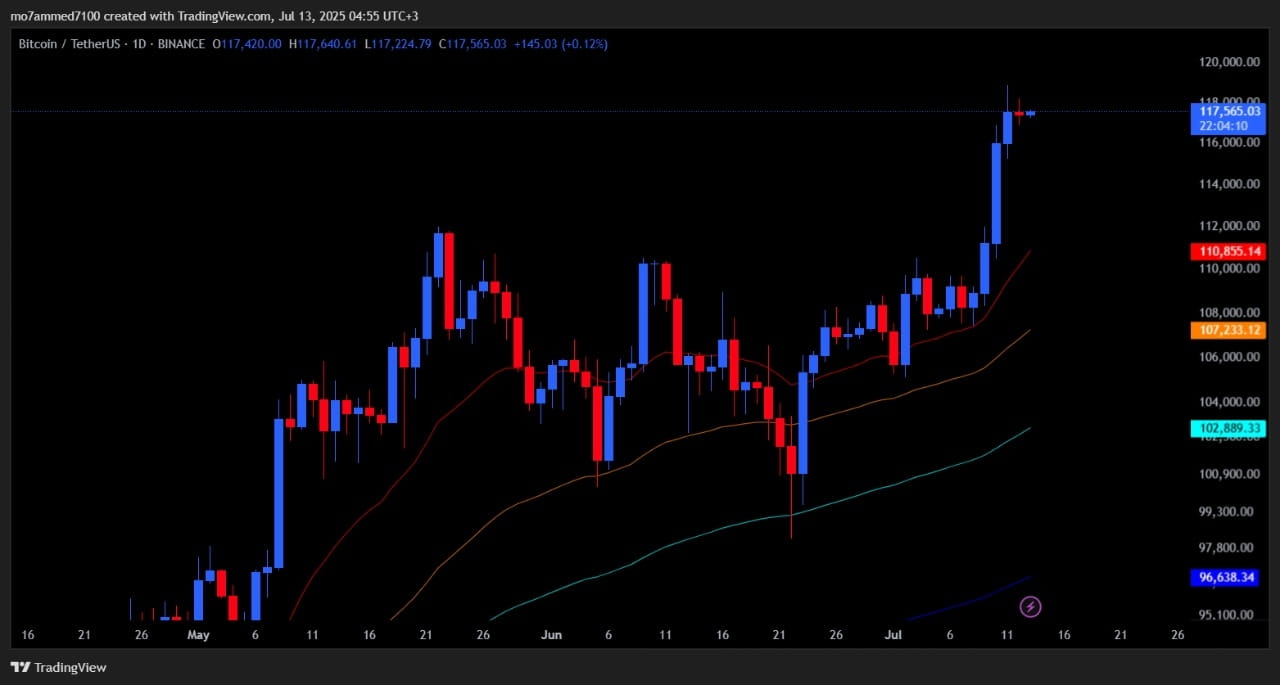
The moving averages MA7 and MA25 are still below the current price, supporting the continued rise. The long-term MA99 confirms maintaining the positive trend above $100,000.
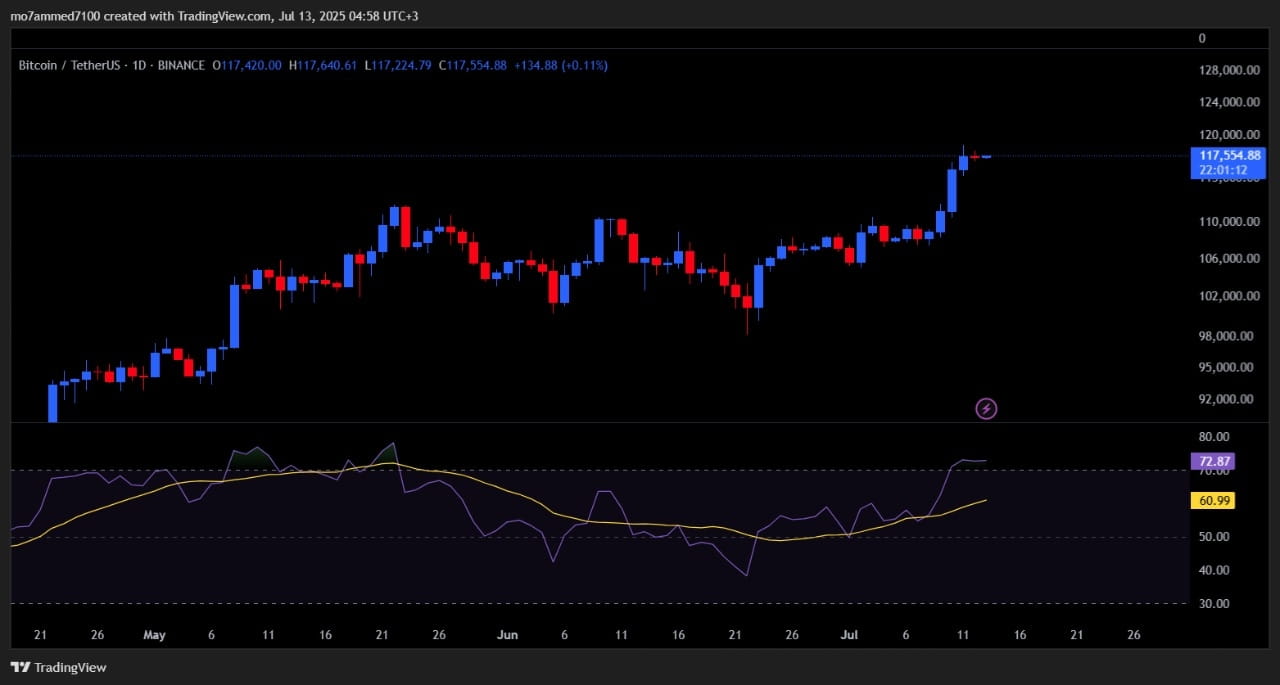
The RSI(6) indicates a clear overbought condition at 85, which is a signal for a near-term price correction opportunity.
As for the MACD, it shows a positive crossover with a clear rise in the green bars, reflecting the entry of real liquidity into the market.
Can we expect a correction? And how do we deal with it?
The RSI reaching these high levels means that the price may need to 'catch its breath' through a slight decline, which is normal and healthy.
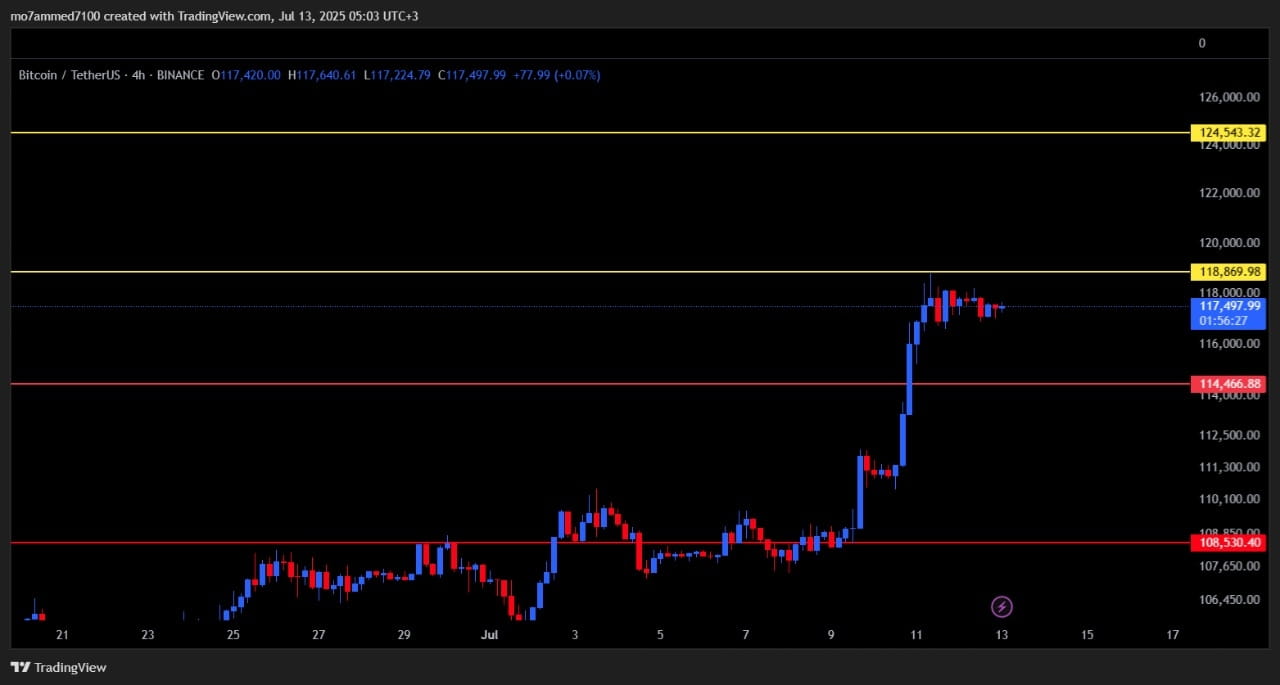
However, it should be noted that breaking the support of $114,400 may lead to temporary profit-taking by some traders, but it does not indicate a change in trend.
Simply put: a correction does not mean a collapse, but rather a pause before continuing to rise.
Next resistance and critical support
If the price successfully breaks through the resistance at $119,900, the path will be clear toward the $125,000 area.
Conversely, $114,400 is considered the first immediate support, while $108,500 is the most important line of defense in case of a deeper correction.
What do these movements mean for investors?
The upward trend is still in place, and the momentum is strong, but the overbought conditions call for caution. Therefore, it is advisable to wait when buying now and to wait for a price retracement from clear support levels before opening new positions. A smart investor does not chase peaks but waits for opportunities during pullbacks.
Summary of the technical analysis for BTC/USDT today
The trend is upward, and the technical support is strong
The indicators suggest a likelihood of a slight correction
Important support: $114,400 then $108,500
Target resistance: $119,900 then $125,000
Best strategy: Watch for a rebound from the supports to open new trades
Disclaimer:
This content is for educational and analytical purposes only and does not constitute investment advice or a recommendation to buy or sell. Trading in the cryptocurrency market involves high risks and may lead to capital loss. Every investor should conduct their own research and consult a licensed financial advisor before making any financial decisions. The author is not responsible for any losses that may arise from the use of this analysis.
#bitcoin #BTCUpdate #CryptoAnalysis #TechnicalAnalysiss #BinanceSquareBTC

