
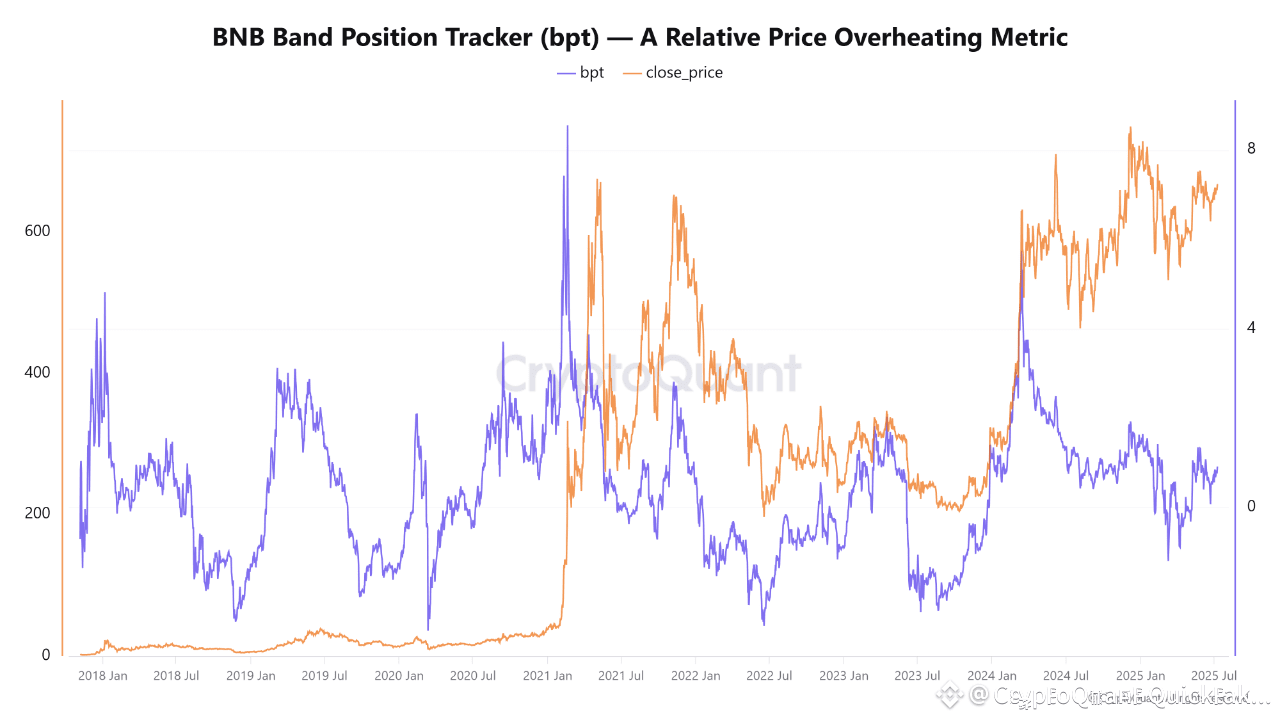
What does bpt show?
bpt gives a clear picture of how far BNB’s current price stands above its 1-year trend, by comparing the latest close price to its long-term average and volatility.
How to interpret it?
bpt ≈ 0:The price is very close to its 1-year average. The market is calm and not overheated.
bpt 2 to 5:Price is getting elevated – possible sign of a rally or growing optimism.
bpt 5 to 8:The market is entering an “overheated” phase. BNB is trading well above trend; risk of a correction rises.
bpt > 8:Price is at extreme highs relative to yearly history, a FOMO zone. Such high bpt has historically been followed by consolidations or pull-backs.
Takeaway:
High bpt values highlight periods when BNB is trading much higher than its usual 1-year level. This can be used as a warning signal by investors and traders to re-evaluate risk, especially during rapid bull runs.
Written by CryptoOnchain
