
Daily K trend analysis: Bitcoin closed yesterday with a long lower shadow bearish candle, having reached a strong support area. Currently, the largest rebound since this waterfall market has appeared, but no clear bottom signal has emerged. It is currently in the late stage of the waterfall market, having touched a strong support area. Both Bitcoin and Ethereum have reached the daily level accumulation area and need to start changing the mindset from shorting to going long. Adopt a left-side trading strategy, gradually bottom-fishing while strictly controlling risk.#比特币走势分析
Ethereum's wave five structure is about to complete, with 2,071 being the key bottom-fishing level. Focus on the 1,950-1,960 spot accumulation area if it breaks.#以太坊走势观察
Previous review: Yesterday's weekend market was very exciting.
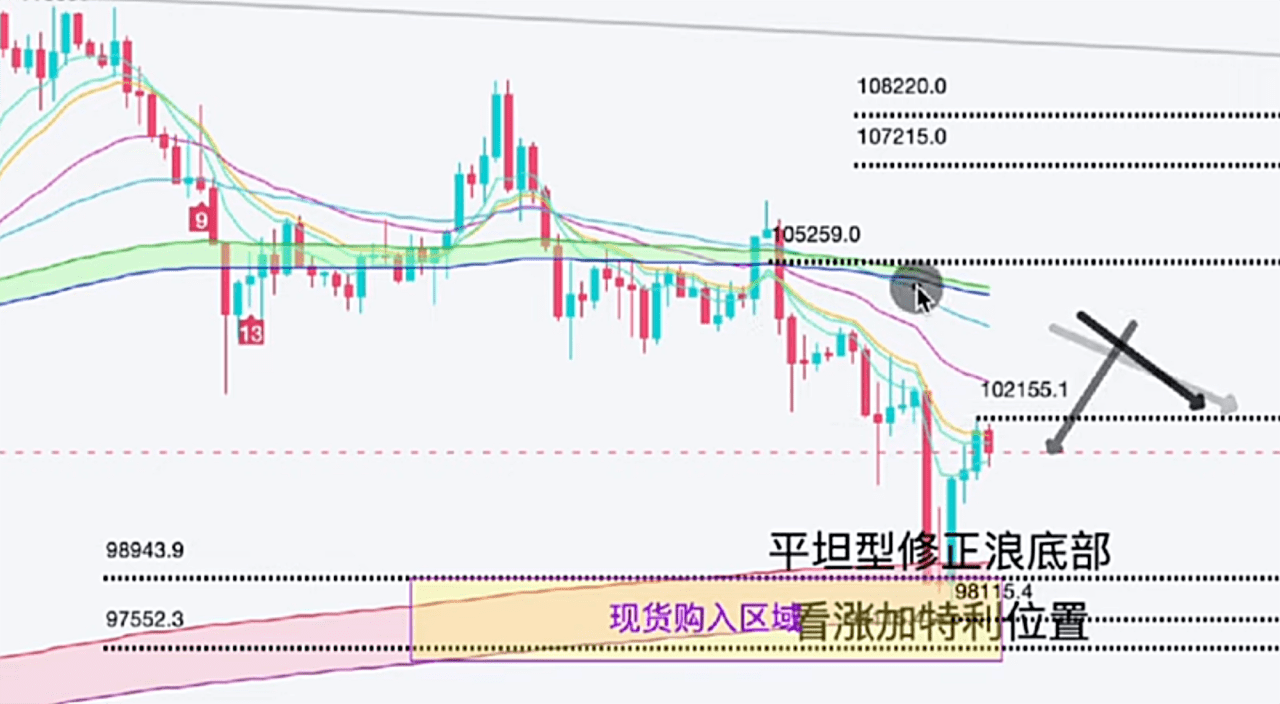
Regarding Bitcoin: The support level at 10,800 rebounded nearly 3,000 points. The spot buying area of 98,100 rebounded to 102,100, an increase of 4,000 points.
Regarding Ethereum: Successfully warned not to bottom-fish, as it fell 500 points from 2,680 to 2,110. The bottom-fishing order at 2,113 performed brilliantly: stop loss at 2,113, first target 2,200, nearly a 1:10 risk-reward ratio. Short BCH at 487, close to 450 for profit.
Resistance Level 1: 103,500 (Wave Theory first wave bottom point + 0.382 retracement level + support-resistance switch position)
Support Level 1: 97,500/97,300 (False breakout position of the fifth wave, pay attention to the 15-minute level 1.13 false breakout, set several hundred points stop loss)
Support Level 2: Daily level tunnel line (key stop loss level, rebound after touching to recover losses and exit)$BTC
For more detailed point analysis, please watch today's market analysis video, which includes detailed explanations! Follow along with Aleng studying K-lines, and we will meet at the peak together! Stay tuned so you won't get lost, and get daily updates on the latest point interpretations!