1. Market overview: low volatility trap and differentiation between institutional and retail investors
Price sideways and technical dilemma
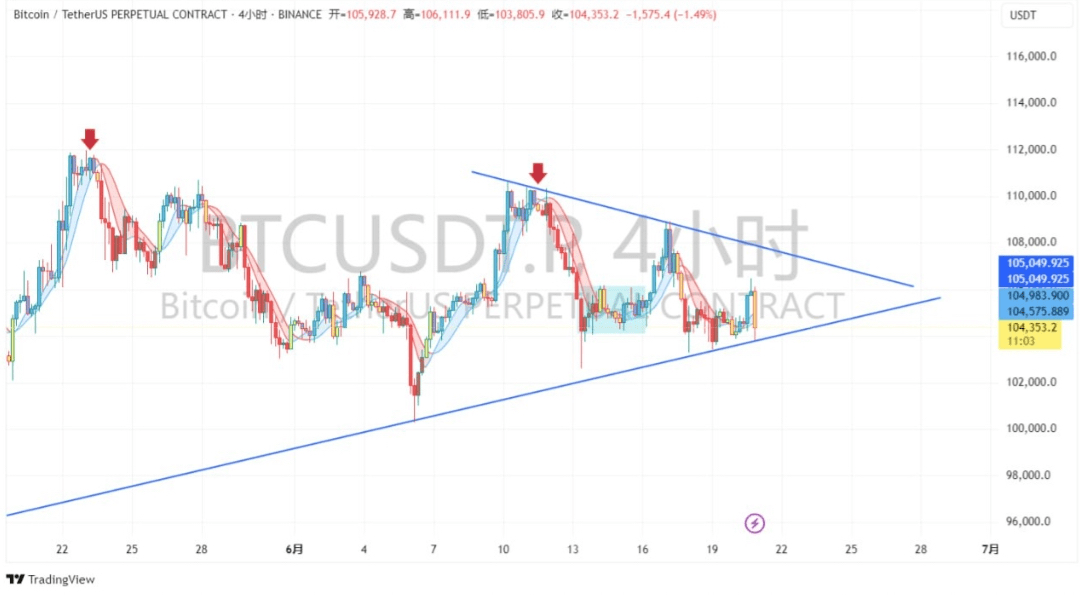
BTC: It fluctuated narrowly within the range of $103,400–105,800 (the end of the triangle convergence) during the week. It failed to hit $106,500 three times. The Bollinger Bands on the 4H chart shrank to the critical point, and the volatility hit an 18-month low.
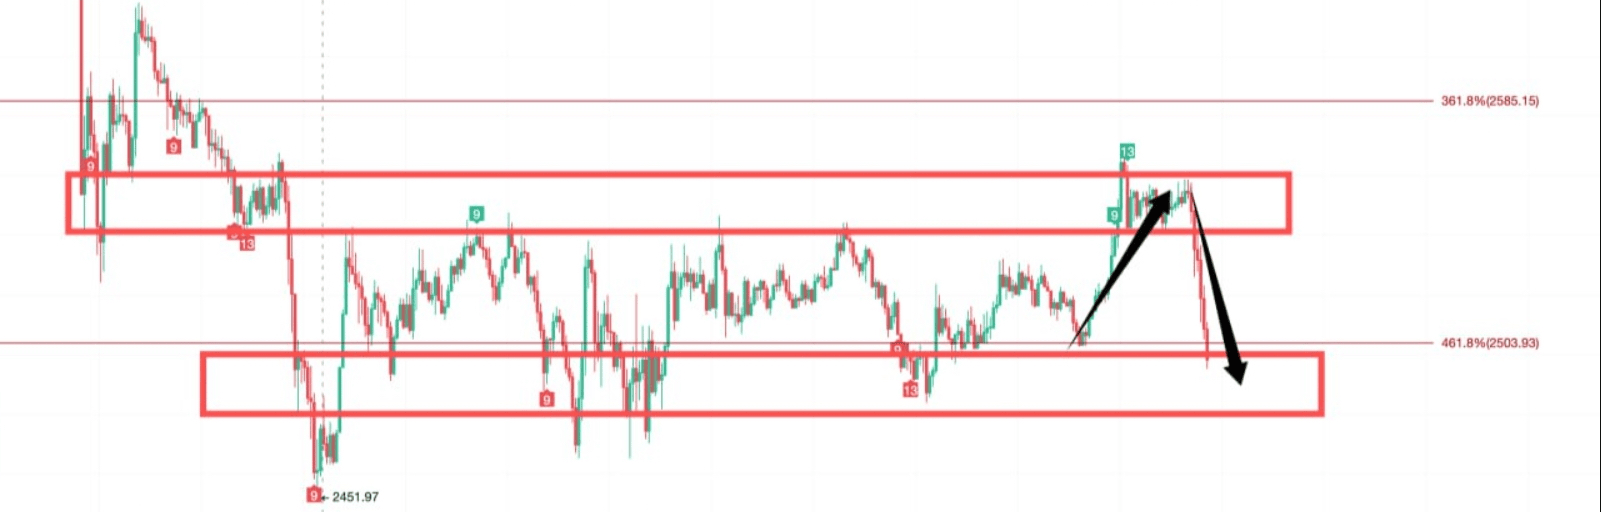
ETH: Weak linkage, under pressure from the $2,360 support, the perpetual contract funding rate has been negative for consecutive days (-0.012%), reflecting the lack of confidence of leveraged bulls.
On-chain liquidity ice age
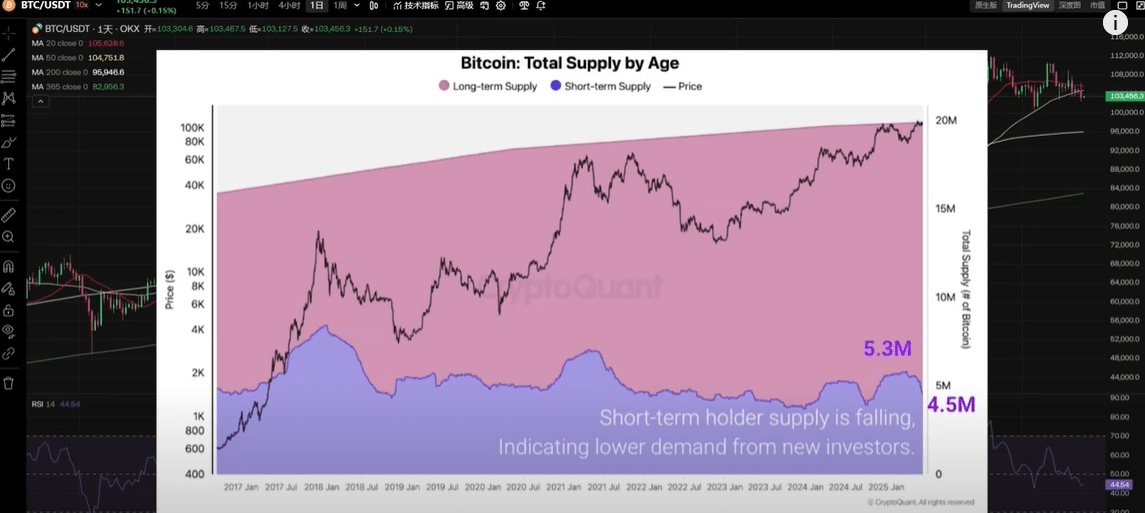
The demand momentum of BTC has dropped to an extremely low level. Historically, this only occurs in a bear market. However, BTC is now consolidating near its all-time high, indicating that new entrants and existing market funds are in a wait-and-see state.
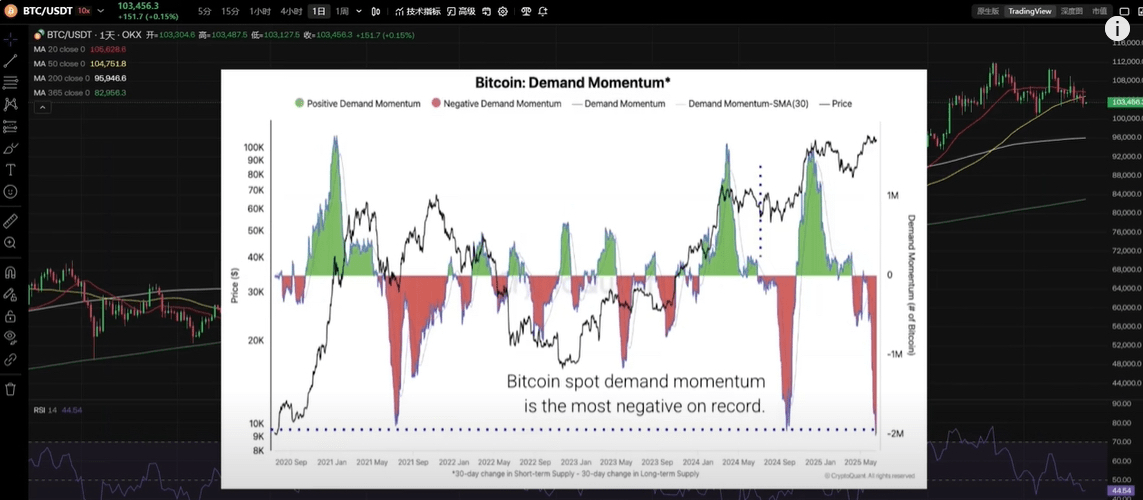
Bitcoin's 7-day average transaction volume is only 316,000 transactions (the lowest since October 2023), and miners' fee income has dropped sharply to US$593,000/day (accounting for the revenue structure <2%), exposing the crisis of excess computing power.
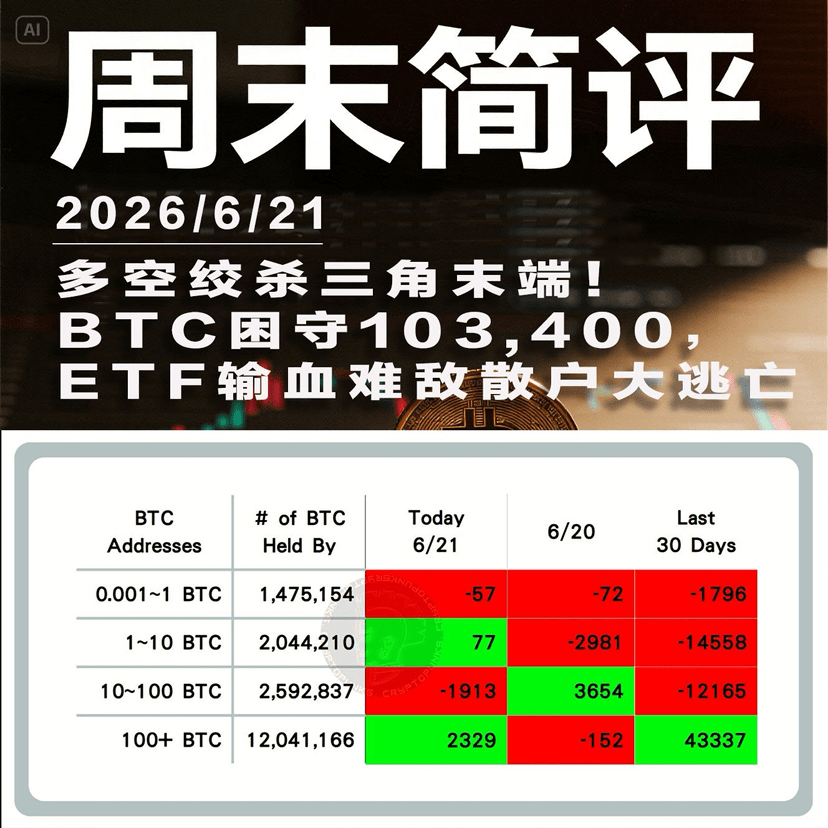
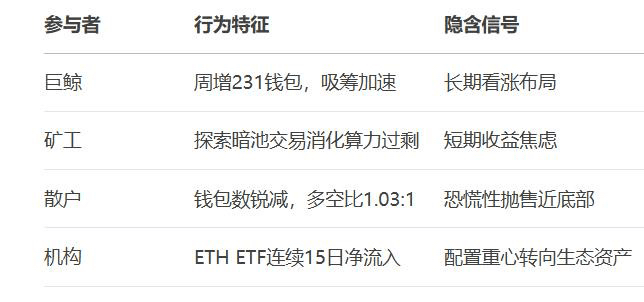
The behavior of whales and retail investors is split:
Long-term holdings are still hoarding
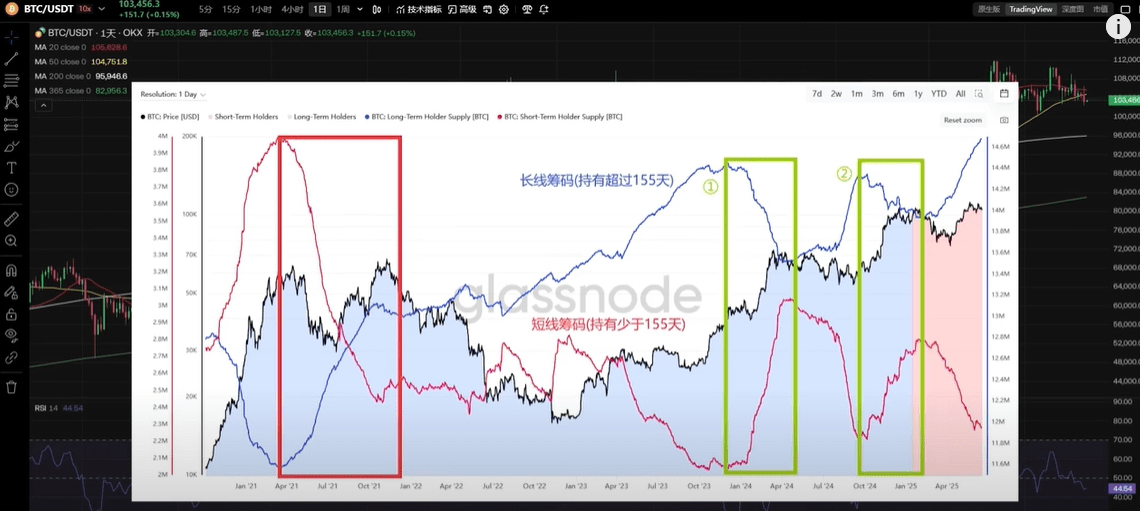
Addresses with more than 100 BTC: 231 wallets were added in the week, accumulating more than 1.05 million BTC;
The number of short-term holders has dropped by 800,000 BTC
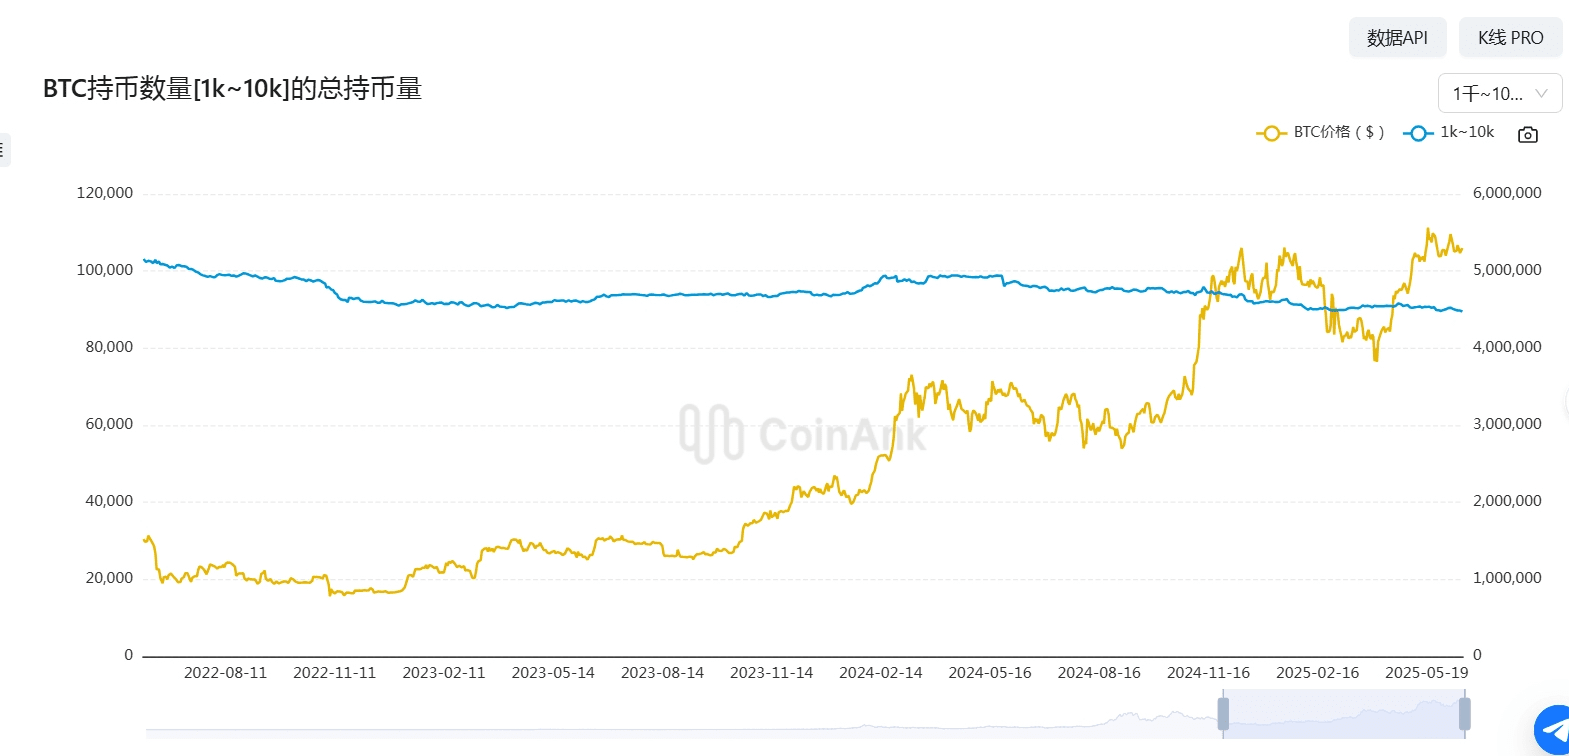
Retail wallets (<10 BTC): decreased by 37,000, and bullish sentiment fell to the lowest level since April (long-short comment ratio 1.03:1).
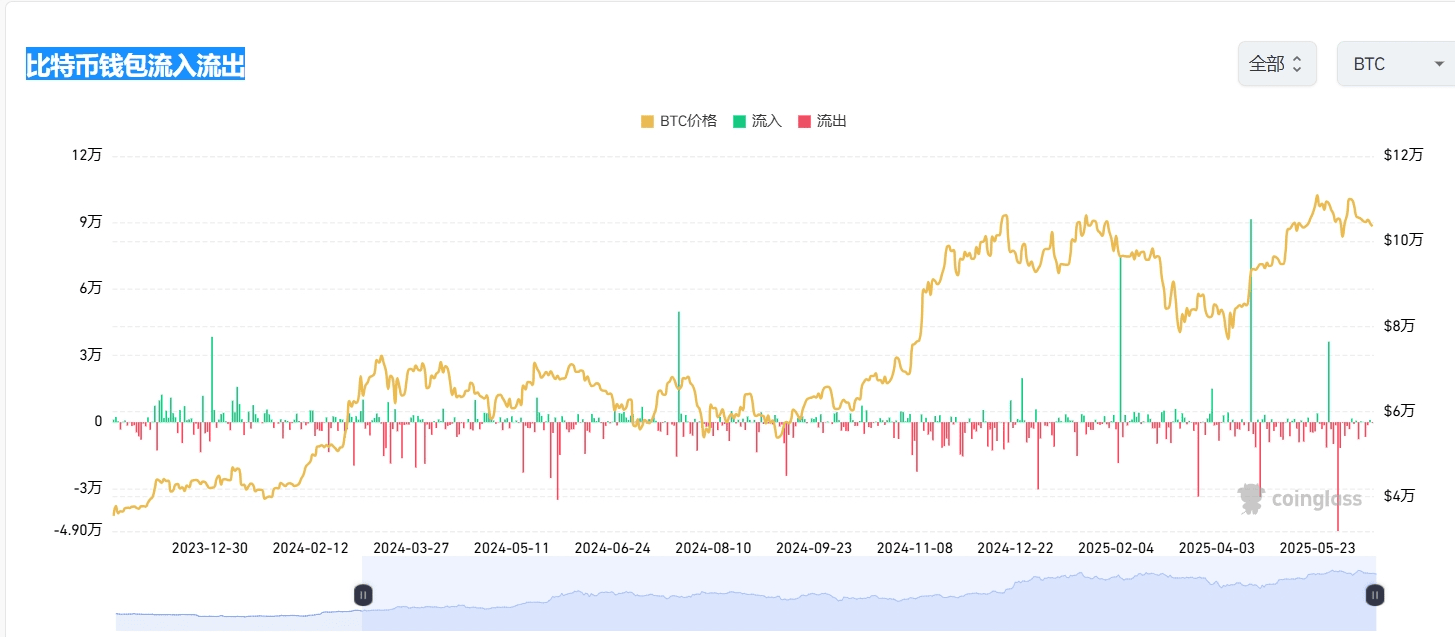
In the past 7 days, the net outflow of CEX was 5503.49 bitcoins. The top three CEXs in terms of outflow are as follows:
Binance, outflow 8049.748 BTC;
Kraken, outflow of 3538.65 BTC;
OKX, outflow of 772.70 BTC.
In addition, Bitfinex received 3,898.86 BTC, ranking first in the inflow list.
Exchange Bitcoin wallet balances continue to hit new lows
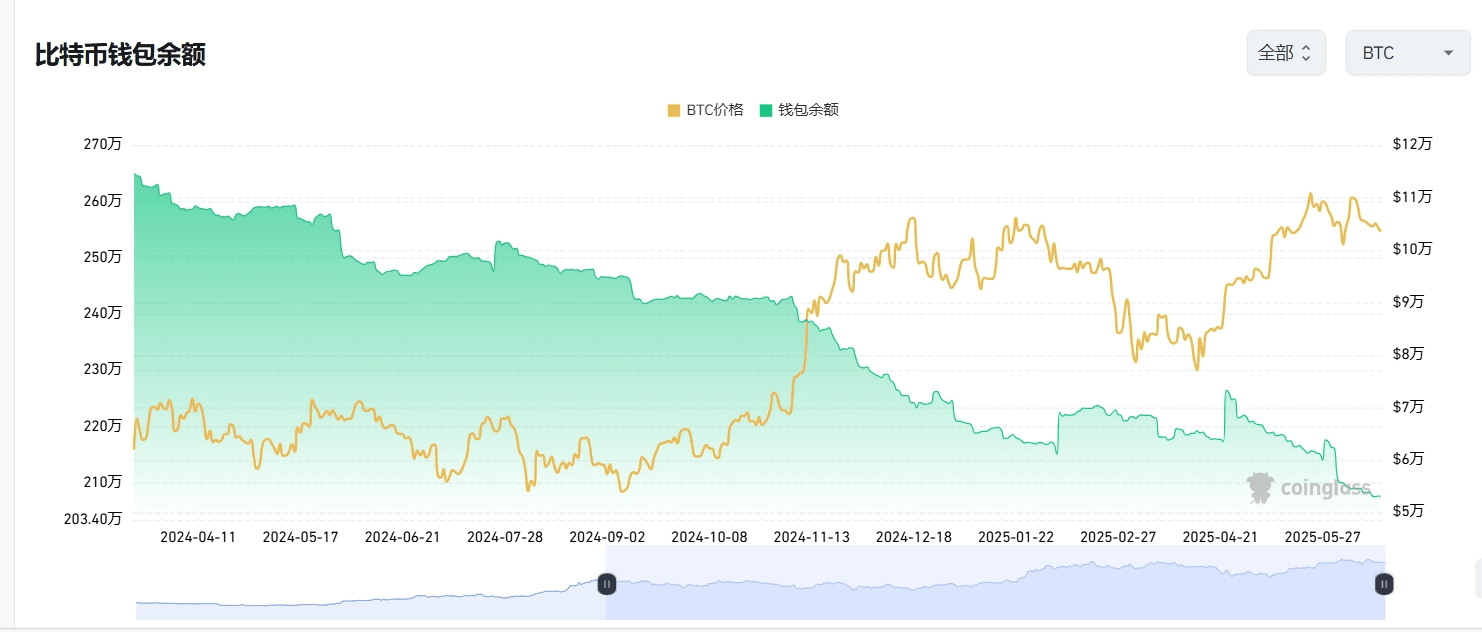
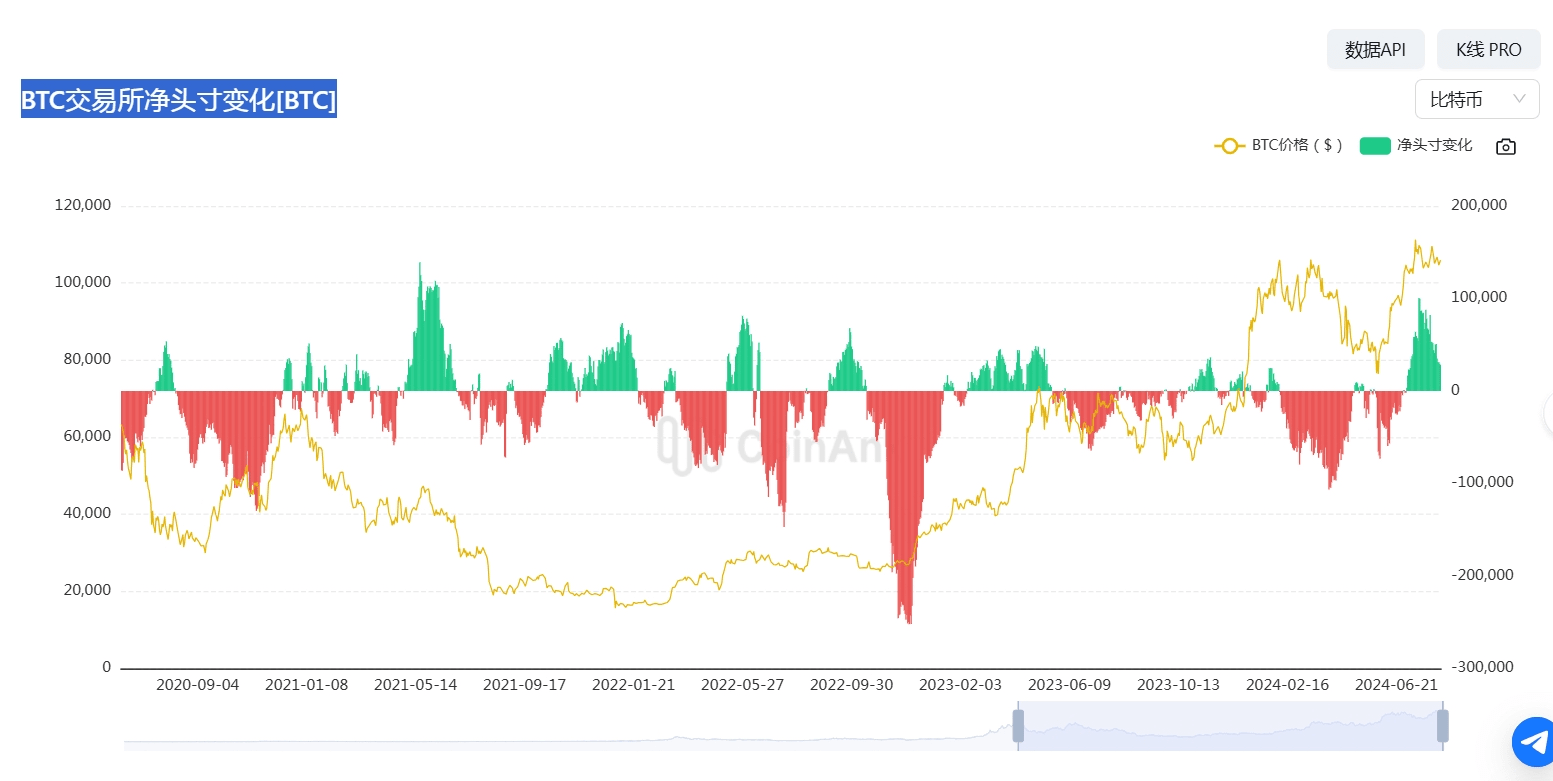
Long-term investors and large investors continue to withdraw coins from exchanges
BTC exchange net position changes
II. Fund movement: ETF siphoning effect and derivatives risks
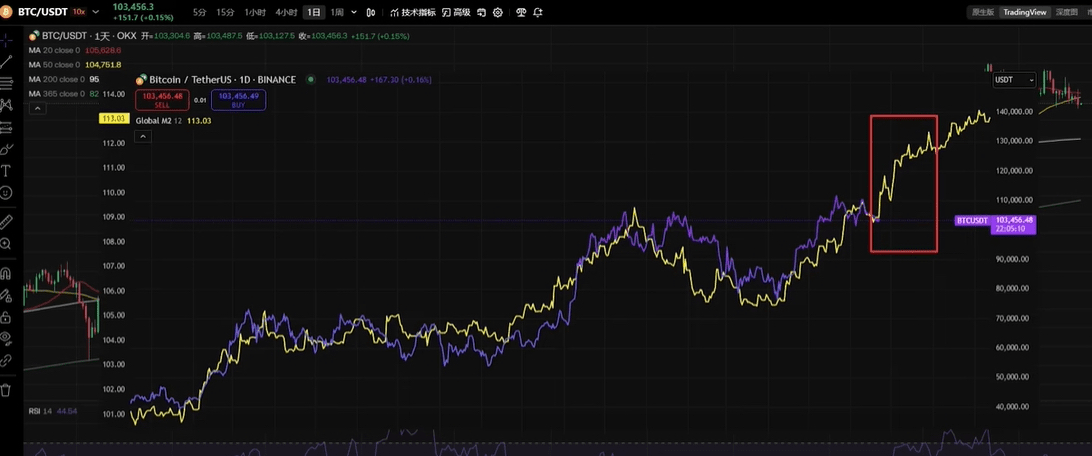
The relationship between BTC and global liquidity M2 is that the global liquidity M2 indicator generally leads BTC by ten weeks.
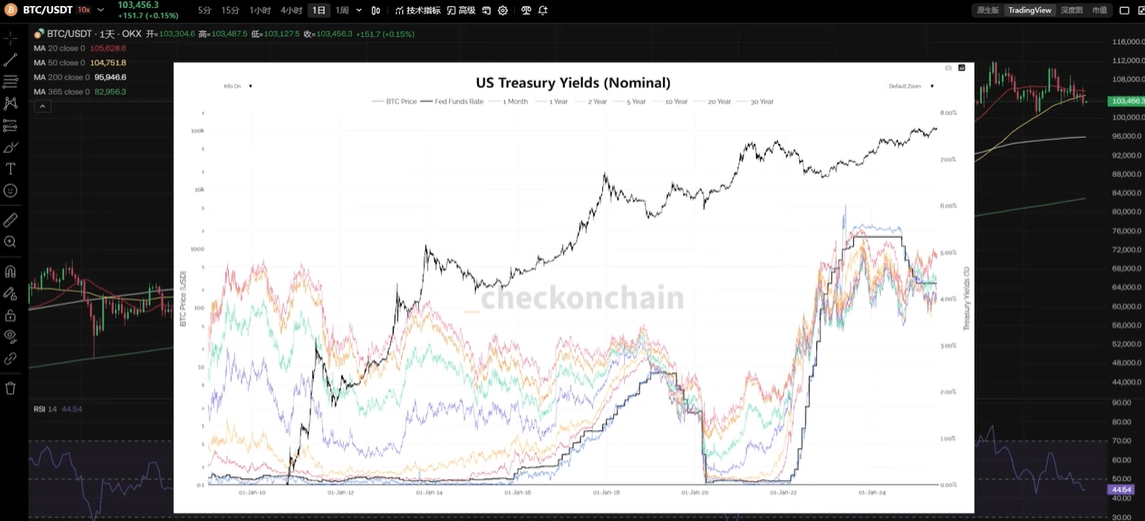
Liquidity released by the US Federal Reserve and its correlation with BTC
Structural Adjustment of Institutional Holdings
BlackRock IBIT ETF: The scale reaches US$69.7 billion (accounting for 3.25% of BTC circulation), but the continuous outflow of Grayscale GBTC offsets the net inflow.
Ethereum ETF: Net inflows for 15 consecutive days, becoming the new favorite of institutions, while the momentum of BTC ETF funds has weakened.
The hidden danger of leverage accumulation in derivatives
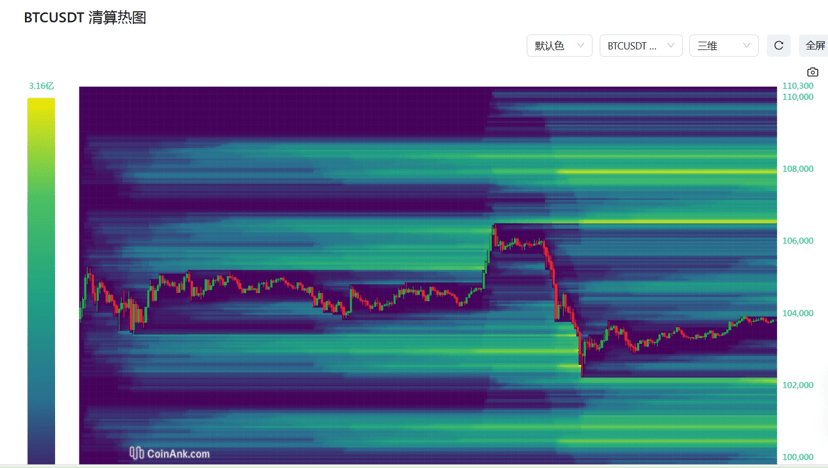
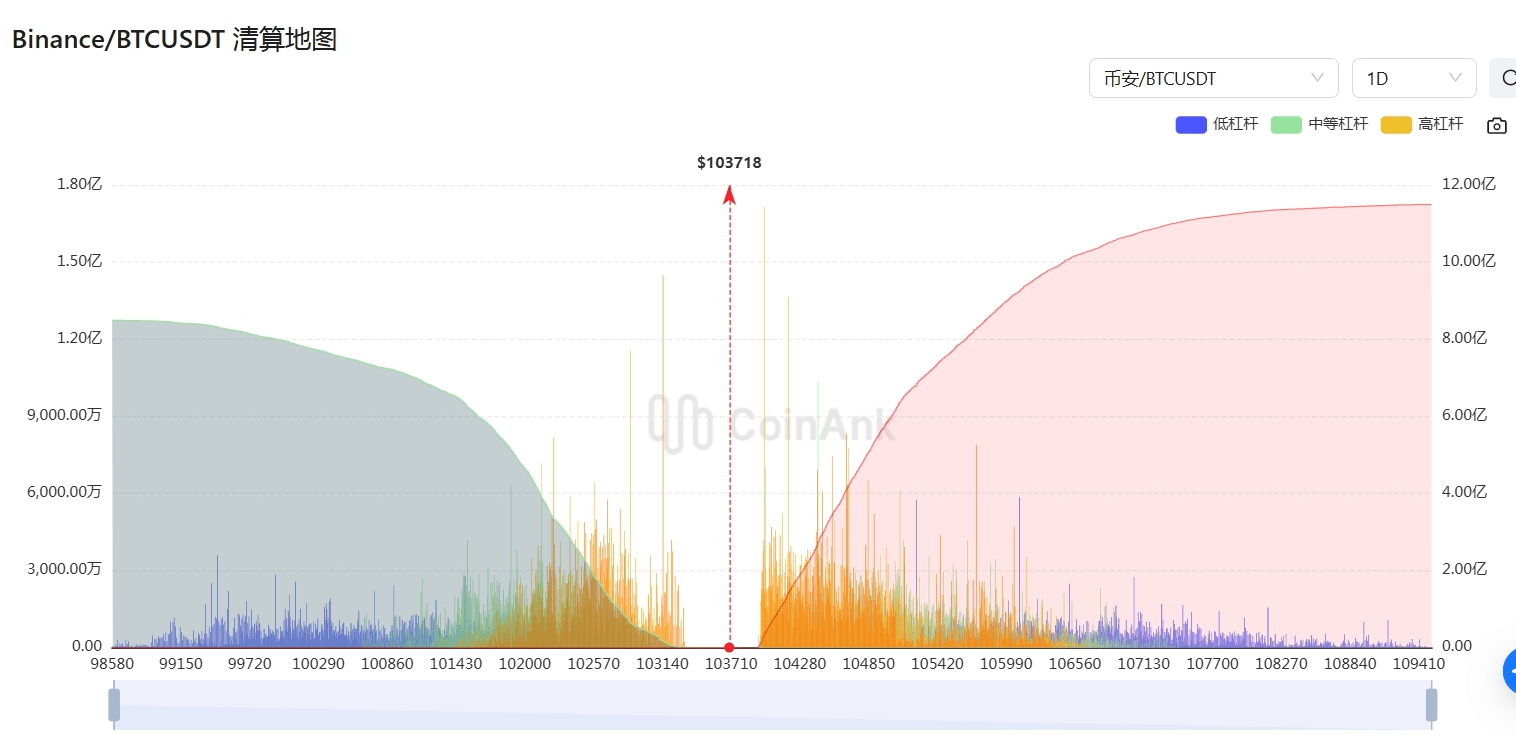
The total BTC open interest in the entire network reached 69.39 billion US dollars (CME accounted for 16.5 billion), and 103,300 US dollars was the concentrated area of long positions (1.8 billion US dollars were liquidated on the 7th).
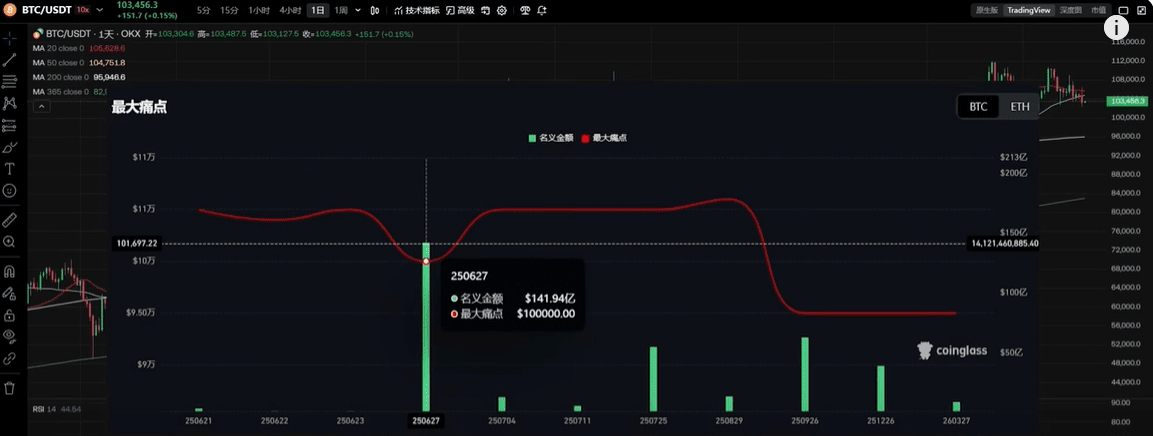
The options market is bearish: the biggest pain point of the contract expiring on June 21 is $100,000, and the put option premium suppresses the rebound.
The biggest pain point of BTC futures delivery is $100,000
Market Sentiment Comparison Chart
3. Regulatory Frontier: Accelerating Compliance Process
Hong Kong offshore RMB stablecoin trial
The regulations are planned to be implemented in August and will be implemented in three stages:
2025-2026: Sandbox testing of trade scenarios in the Greater Bay Area;
2026-2027: Access to mBridge cross-border payment and pilot RWA bond tokenization;
2028: Global promotion challenges the status of the US dollar as a stable currency.
US SEC policy shift
The new chairman Atkins overturned Gensler's line: defining "autonomous custody rights" as American values and supporting non-intermediary on-chain finance (such as DEX compliance).
(GENIUS Stablecoin Act) passed a procedural vote, requiring full reserves + regular audits, and algorithmic stablecoins were banned.
4. Ecological innovation: efficiency breakthrough and scenario implementation
Public chain performance competition upgrade
XRP Ledger: Processing 5.1 million transactions per day (DEX+NFT driven), cost < $0.01, feasibility verification of enterprise-level applications.
Ethereum Fusaka upgrade: EIP-7939 and other scopes have been finalized, the test network is about to be launched, and gas fee optimization and ZK-Rollup integration have become the focus.
Evolution of miners’ survival strategies
Leading mining companies (such as Marathon) have enabled the Slipstream private channel to avoid packaging transactions in the public memory pool and alleviate revenue pressure.
Bitcoin developers debate "censorship resistance vs. network purification", and differences in technical routes intensify (value storage vs. payment network).
5. Risk Warning: Weekend Liquidity Crisis
Macroeconomic repression continues
Fed's Barkin said there is "no urgency to cut interest rates", and the dollar rebounded, suppressing risk assets;
U.S. stocks and cryptocurrencies are decoupled: BTC fell 1.8% when the Dow rose 1.2%, and capital diversion was obvious.
Low volatility trap
CEX spot trading volume fell by 21.8% month-on-month (down for three consecutive months), Binance's share shrank to 31.2%, and market activity reached a freezing point.
6. Next week’s outlook: catalysts for change
Technical Choice
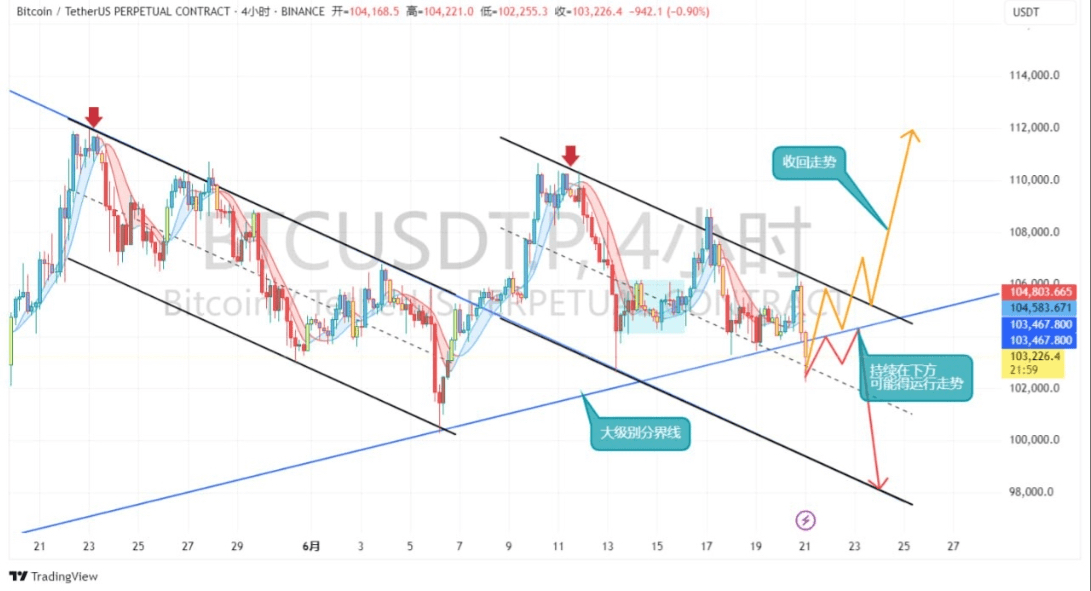
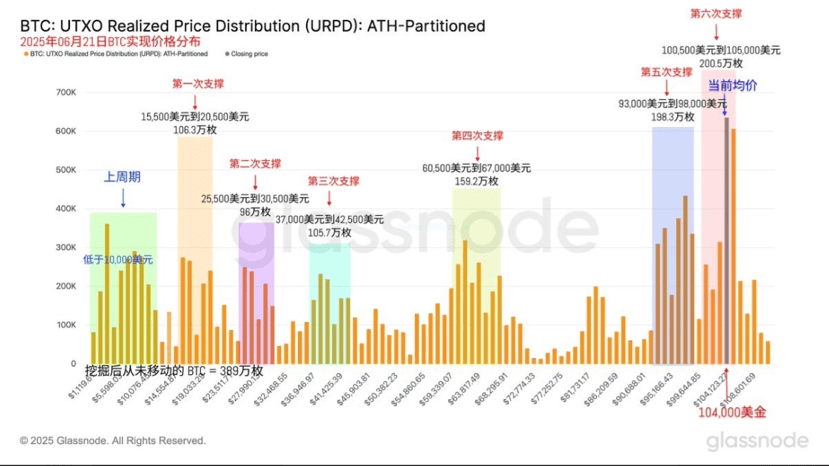
The areas with the highest concentration of BTC short-term chips are 10400 and 10500
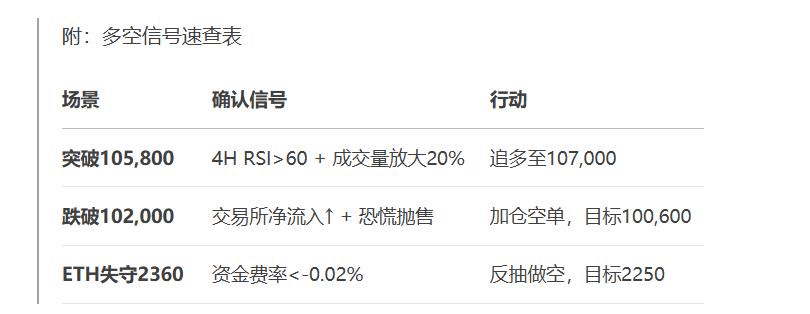
BTC triangle breakout: If it breaks through $105,800 with large volume, the target will be 107,000→108,500; if it loses $102,000, it will probe 100,600 or even 98,000.
ETH upgrade expectations: Fusaka testnet may boost L2 ecology, pay attention to the defense results of $2,360.
Long and short signal quick reference table
Policy and Data Focus
Disclosure of the details of Hong Kong’s stablecoin regulations (affecting the construction of CNH liquidity pool);
US June CPI data (re-evaluation of the probability of a rate cut in July).
Summary: The world of encryption is waiting to be broken
This week, the market is stuck in the paradox of "institutional holdings" and "retail investors leaving the market", "silence on the chain" and "regulatory ice-breaking":
Short-term: The range of $103,400–105,800 is still the life and death line for long and short positions. Beware of the spike in the low liquidity.
Long term: Hong Kong's RMB stablecoin experiment and the compliance of U.S. self-custody will reshape the global crypto asset flow paradigm.
Operational inspiration: The retail investor panic period (long-short ratio of 1.03:1) may be a window for reverse layout, but leverage needs to be strictly controlled, focusing on BTC/ETH spot and compliant stablecoin ecological targets.
1. Greed and Fear Index Today: 52 Neutral Increased from yesterday
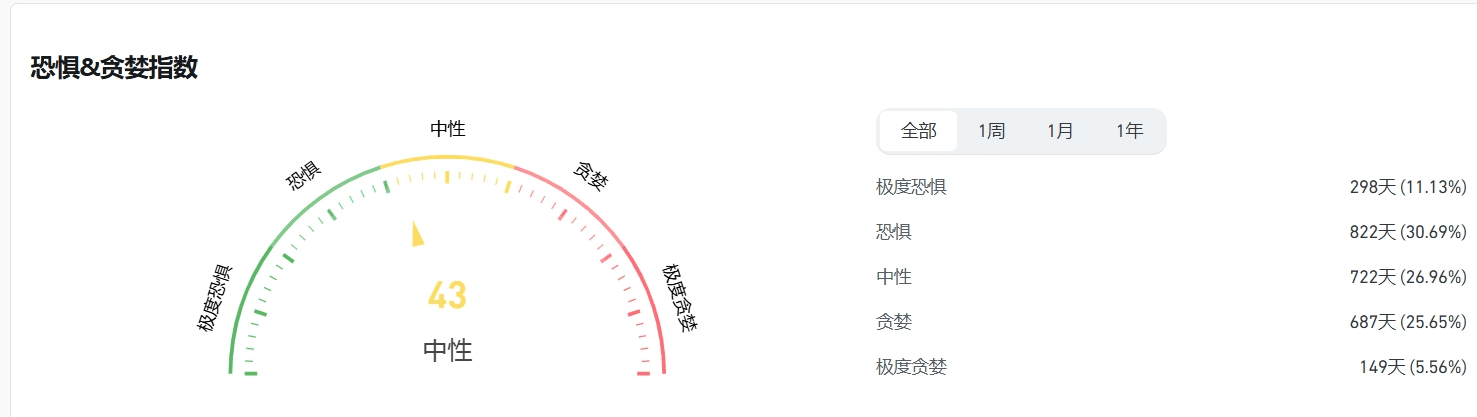
** Greed Panic/ Greed Index Interpretation
The behavior of the cryptocurrency market is very emotional. When the market is rising, people tend to be greedy and have a fear of missing out, and when the market is falling, they react irrationally by selling their cryptocurrencies.
With the help of the fear and greed index, we can help our friends get rid of the influence of their own emotional factors and make irrational judgments as much as possible.
There are two states:
Extreme fear indicates that investors are overly worried and could be a buying opportunity.
Being too greedy suggests that investors are too excited and the market may be due for a correction.
2. Bitcoin’s total market share: 63.78, slightly higher than yesterday
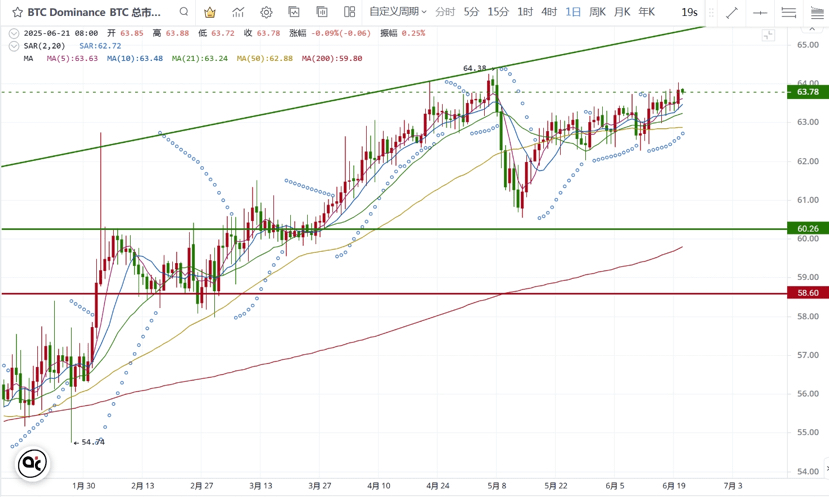
**Bitcoin's total market share is a core indicator to measure Bitcoin's relative influence in the entire cryptocurrency market. This indicator not only reflects Bitcoin's short-term market position, but also reveals changes in capital rotation, investor sentiment and macro trends.
Bitcoin market share is a barometer for judging the market stage:
Early stage of bull market: market share increases, and funds are allocated to Bitcoin first.
Mid- to late-stage bull market: Market share declines, funds rotate to altcoins, triggering the “altcoin season”
Market thermometer: >60% = risk aversion; <40% = altcoin frenzy.
Fund flow chart: reveals the allocation preferences of institutions and retail investors (Bitcoin → stable, altcoin → high risk and high return)
3. Bitcoin and Ethereum trading pair 0.023506 Ethereum to Bitcoin trading pair fell back
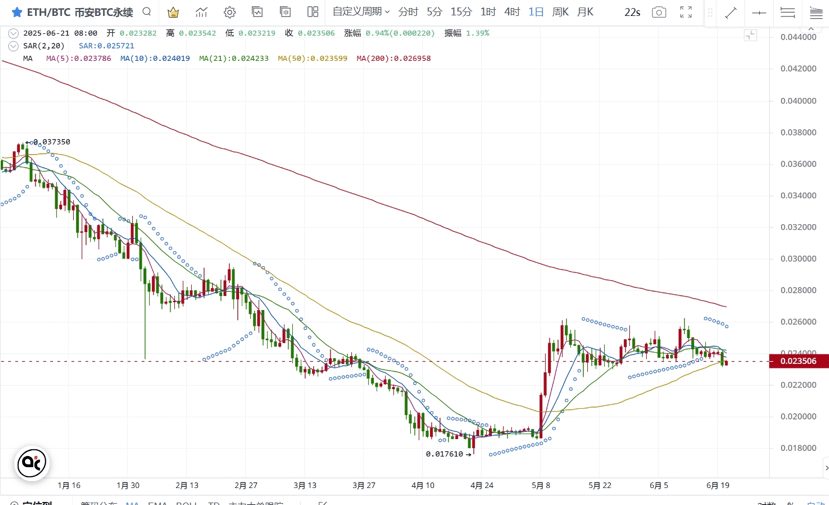
**The Bitcoin/Ethereum trading pair is the “risk thermometer” of the cryptocurrency market:
Ratio rises → market prefers high-risk assets (signal of the start of the altcoin season);
Ratio decreases → funds flee to Bitcoin (characteristic of a bear market or early bull market).
4. ETF inflow and outflow data ETF data maintains inflow for many days
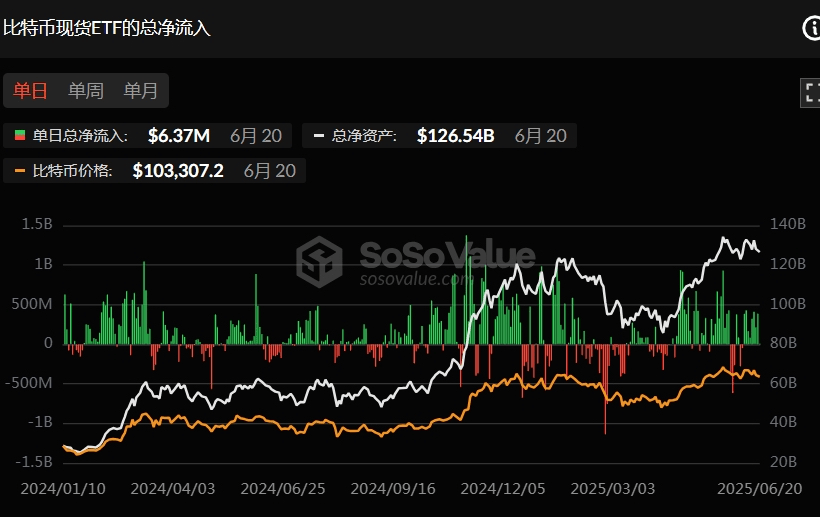
**ETF inflow and outflow data description: Bitcoin ETF's inflow and outflow data is a core indicator for tracking institutional sentiment, market trends and fund rotation.
5. On-chain BTC retail, large, and institutional buying and selling data statistics. The largest inflow of whales in a week
Thanks to @交易扑克大 for providing data collation and sharing
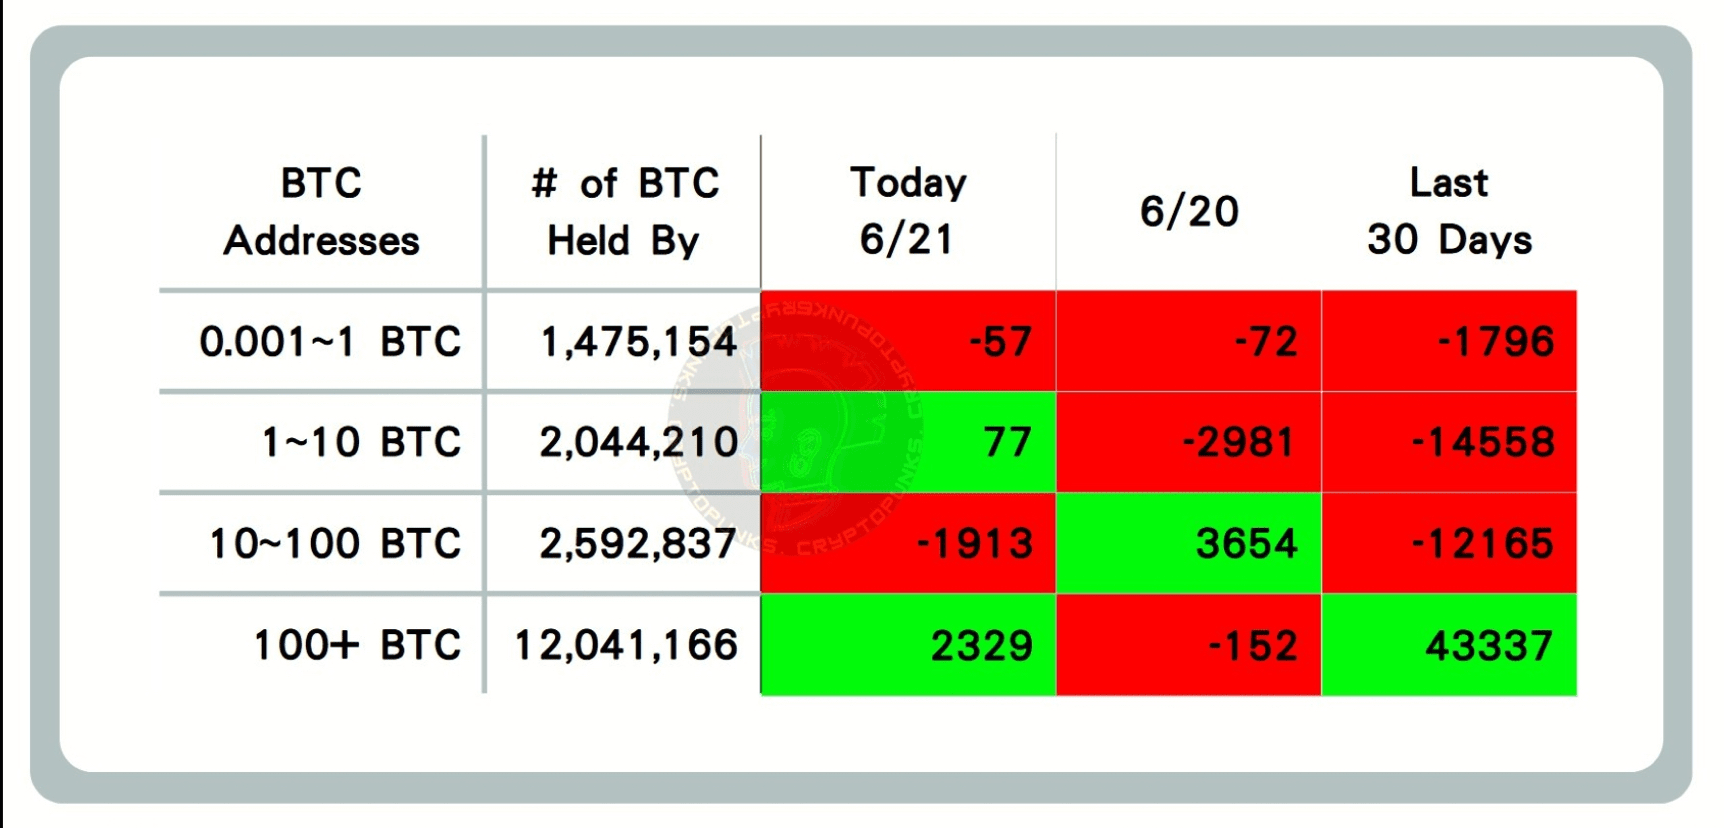
Data description: Represents the increase or decrease of on-chain flow of ≤ 1 BTC, 1-10 BTC, 10-100 BTC, and 100+ BTC respectively. This data can reflect the market sentiment of retail investors, large investors, and institutions.
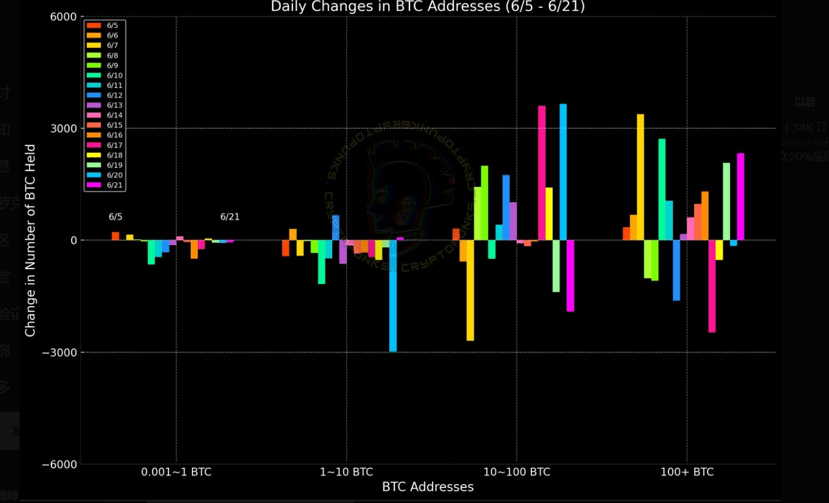
Data description: This data reflects the increase or decrease of on-chain flows of ≤ 1 BTC, 1-10 BTC, 10-100 BTC, and 100+ BTC within a week. This data can intuitively reflect the flow trend of BTC among retail investors, large investors, and institutions in the market.
When an extreme situation occurs in the on-chain data, a reversal often occurs (for example, if a large whale with more than 100 BTC on the chain buys a large amount, while others sell, the probability of Bitcoin rising greatly increases, and vice versa). At the same time, it is necessary to combine the analysis with other on-chain data and technical indicators.
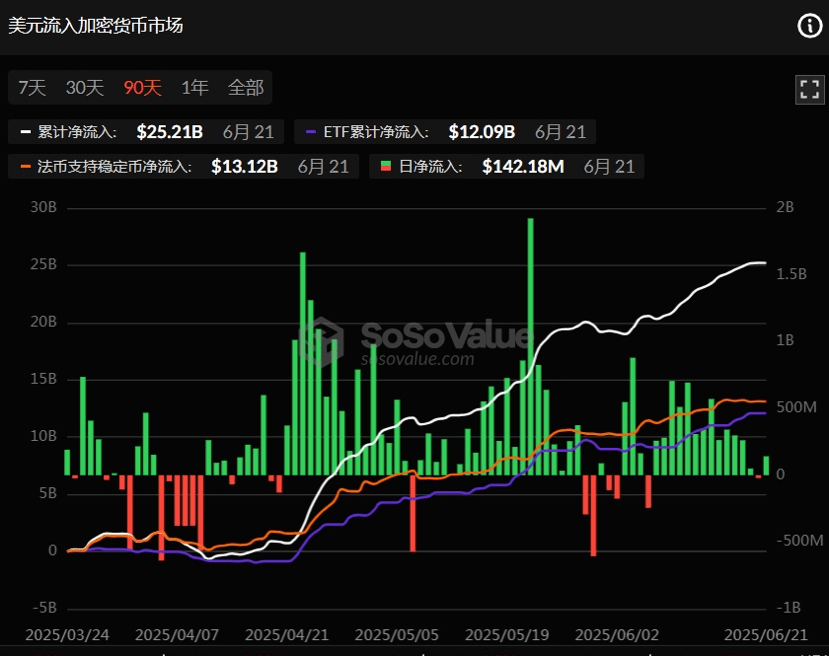
6. US dollars flow into the cryptocurrency market. Net inflow
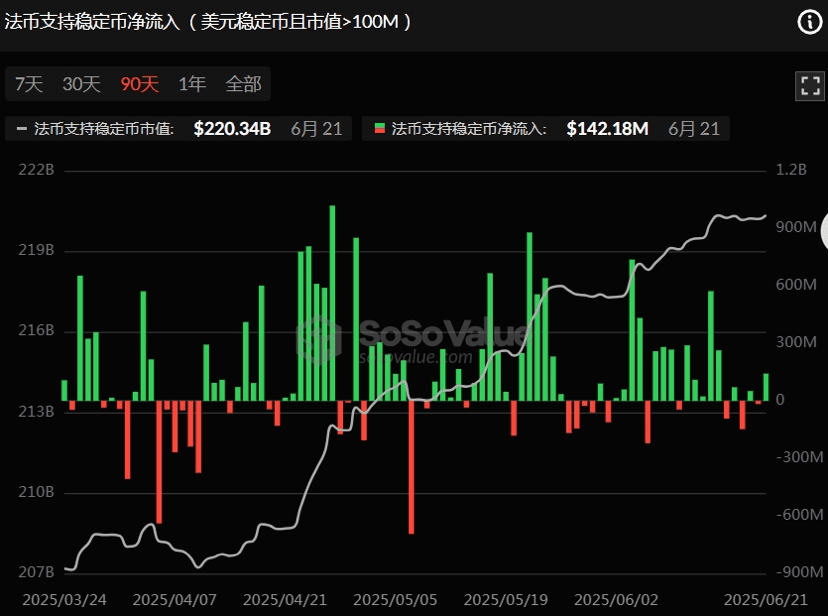
7. Net inflow of legal tender-backed stablecoins (USD stablecoins with market value > 100M)
8. The rainbow chart shows that BTC has no signs of peaking
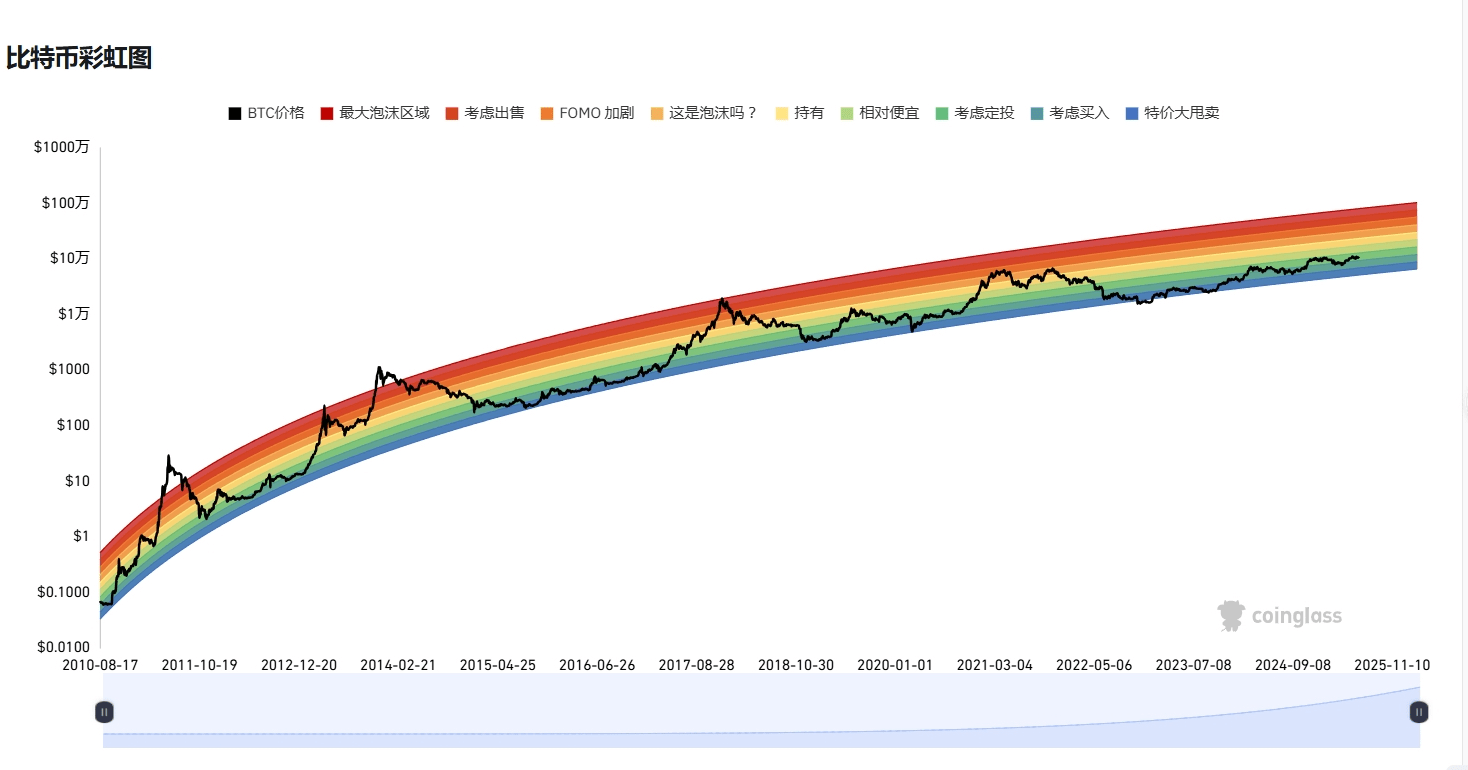
The above data only represents the prediction of BTC volatility trend and market sentiment from the perspective of on-chain data, and does not represent any investment advice. Please make your decision carefully! !
I am Mingzhu. Follow me and I will share real-time data and dynamics on the chain every day to help my friends predict and make decisions. Don’t miss the excitement. Welcome to leave a message for discussion.
