1. Core conclusions from the global fund manager survey.
Cash allocation and risk preference.
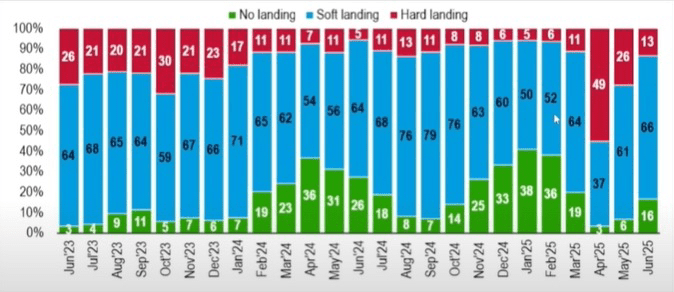
Latest June data: The preference of 200 of the largest fund managers managing $600 billion toward the financial markets is to increase positions and reduce cash.
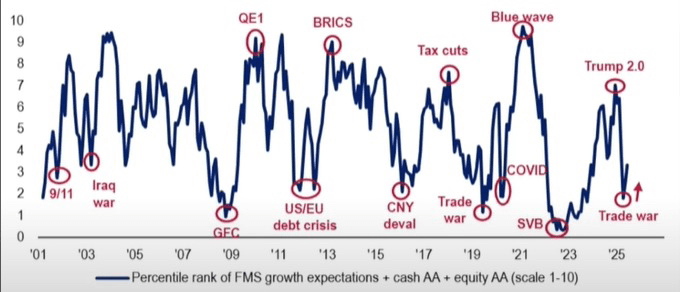
Cash positions have dropped to a three-month low (4.8% → 4.2%), indicating that investor sentiment has reversed from panic in April, with a significant increase in risk appetite.
66% of respondents expect a 'soft landing' for the global economy, with recession worries dropping from a net 42% in April to a net 36%.
Investor confidence index has somewhat recovered.
Asset allocation preferences.
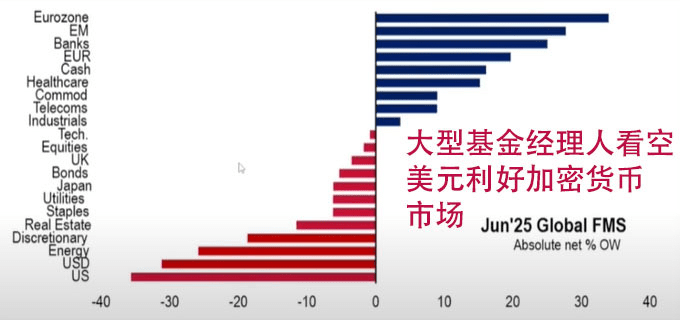
Non-U.S. stocks are the top choice for growth: 54% of fund managers believe international stocks will perform best in the next five years, while only 23% are optimistic about U.S. stocks.
Emerging markets receive significant over-allocation: The net over-allocation ratio reaches 28% (the highest since August 2023), with funds flowing into Asian markets like India and South Korea (net inflow of $10.65 billion in May).
Sentiment of the dollar and gold.
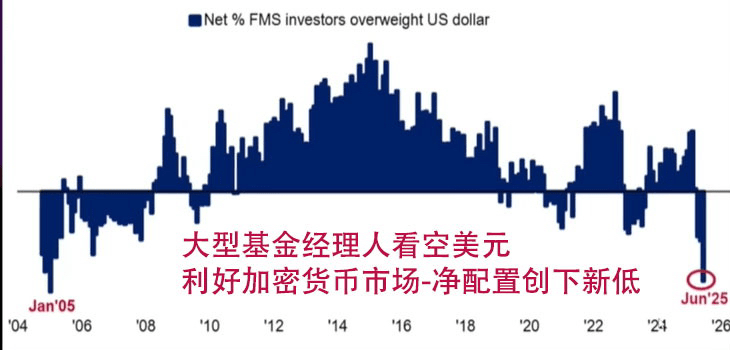
The dollar is extremely under-allocated: A 31% under-allocation is the most extreme in 20 years, with a net 59% of investors expecting the dollar to weaken in the next 12 months.
Gold trading crowding is at the top: 'Long gold' has been the most crowded trade for three consecutive months (41%), followed by long U.S. tech stocks (23%) and shorting the U.S. dollar (20%).
2. The abnormal inflow of Bitcoin ETFs in geopolitical conflicts.
Continued capital inflow during conflicts.
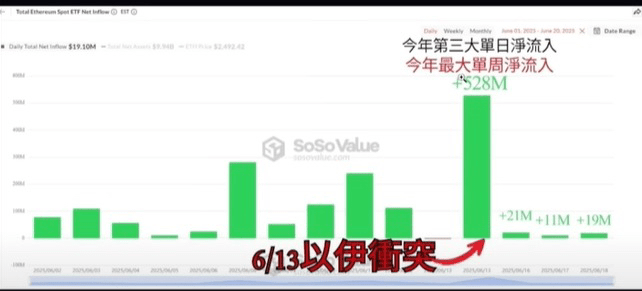
BTC ETF inflow performance since the Israel-Iran conflict: Since the conflict on June 13, BTC ETFs have seen net inflows, whereas historically, during all international conflicts, international capital has seen net outflows to avoid risks.
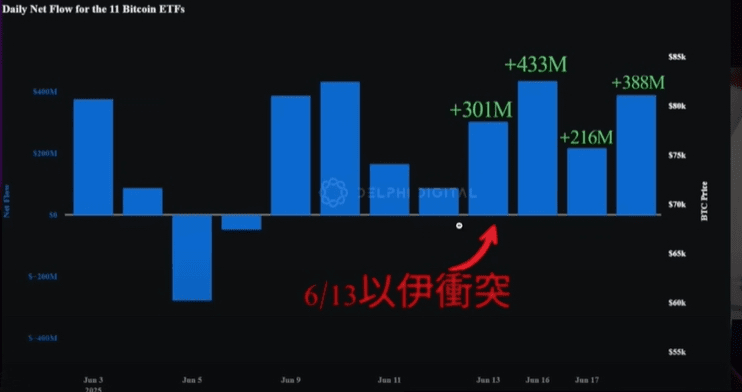
During the conflict between Israel and Iran, there was a net inflow of $1.3 billion from June 9 to 13 (continuous for 5 days). During the same period, an Israeli airstrike on Iran caused BTC to briefly drop over 3% to $103,000 but quickly rebounded.
Divergence from traditional safe-haven assets:
Historically, geopolitical conflicts usually lead to net outflows of ETFs, but this time the逆势流入凸显比特币“避险属性”的强化.
On-chain support and institutional holdings.
Exchanges' BTC reserves continue to hit new lows.
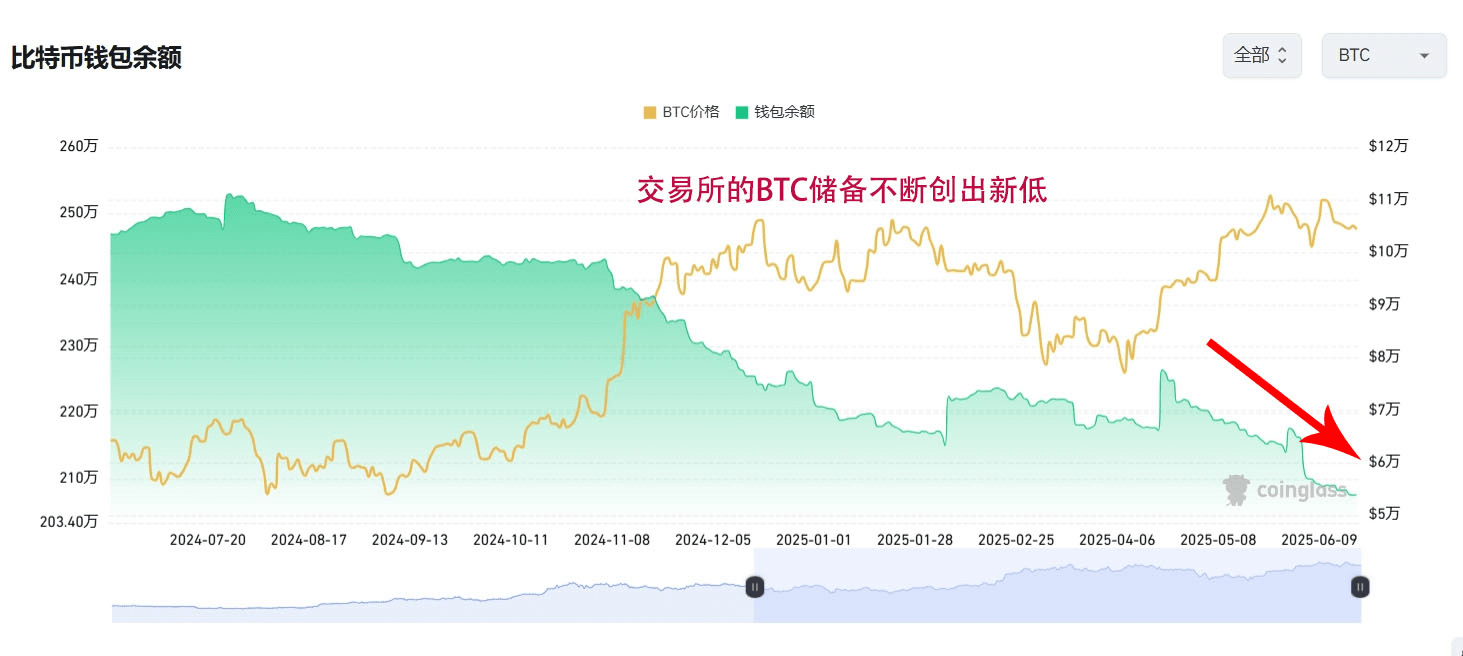
Long-term investors are continually withdrawing BTC from exchanges.
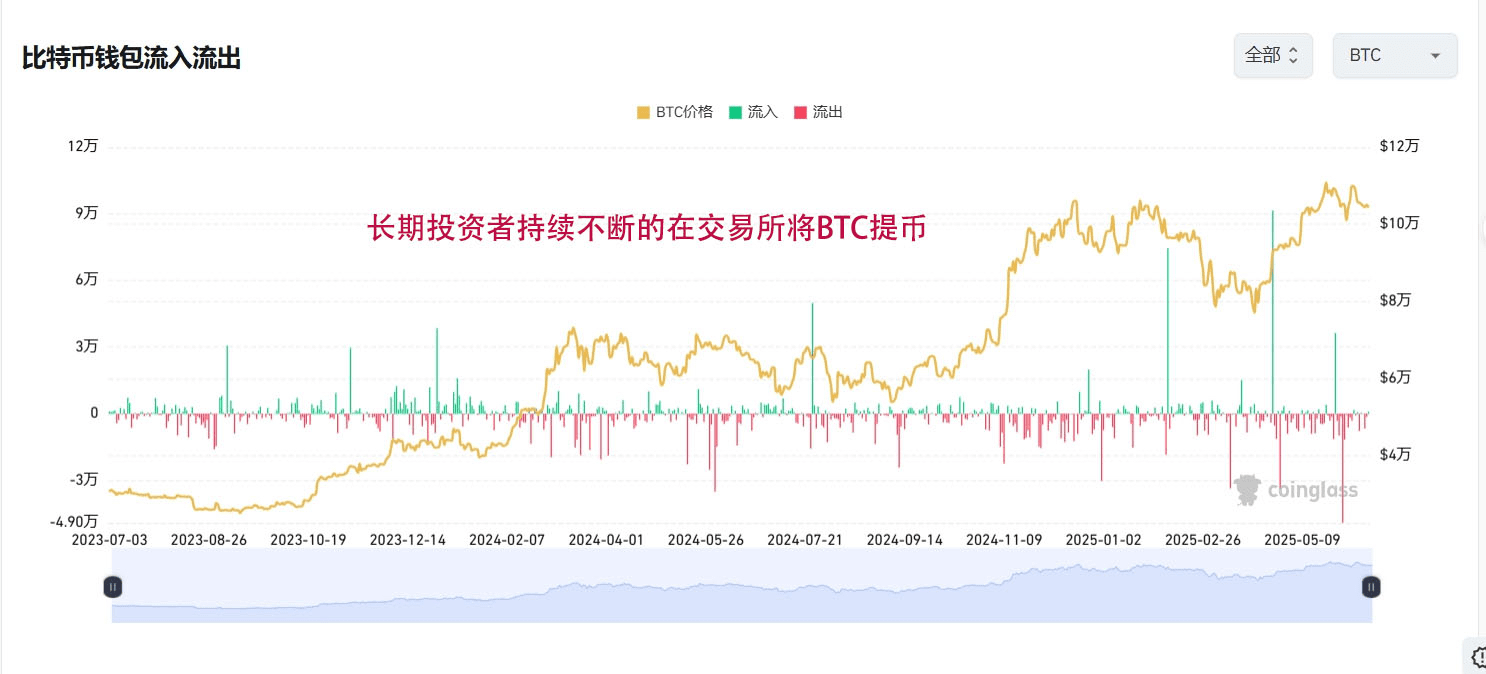
The BTC balance on exchanges hits a three-year low: Over 20,000 BTC flowed out of centralized exchanges in a week (Coinbase Pro accounts for 7,779), suggesting a tendency for long-term holding.
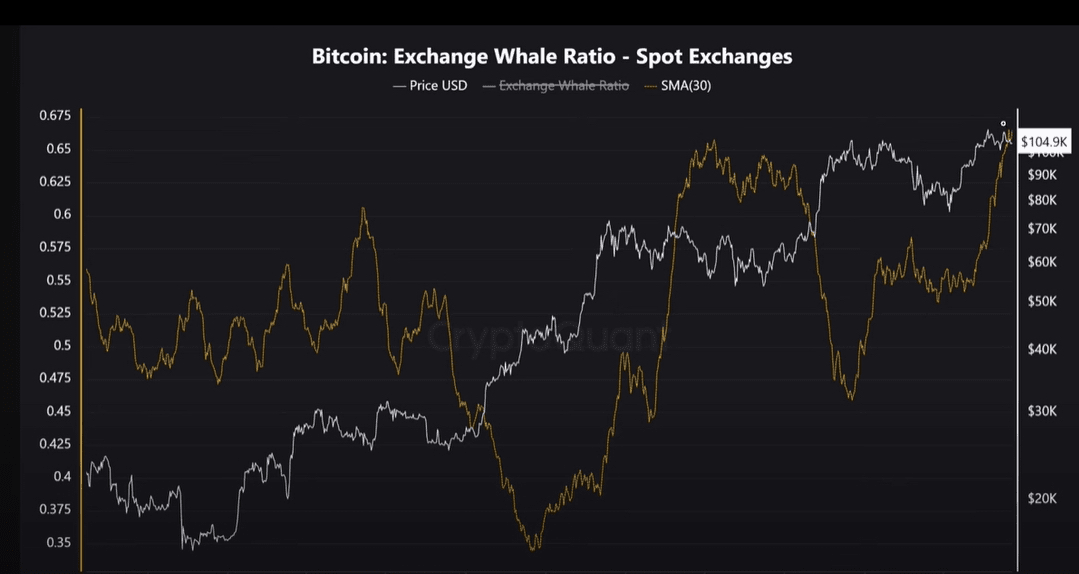
The holdings of BTC large whales on exchanges continue to reach new highs.
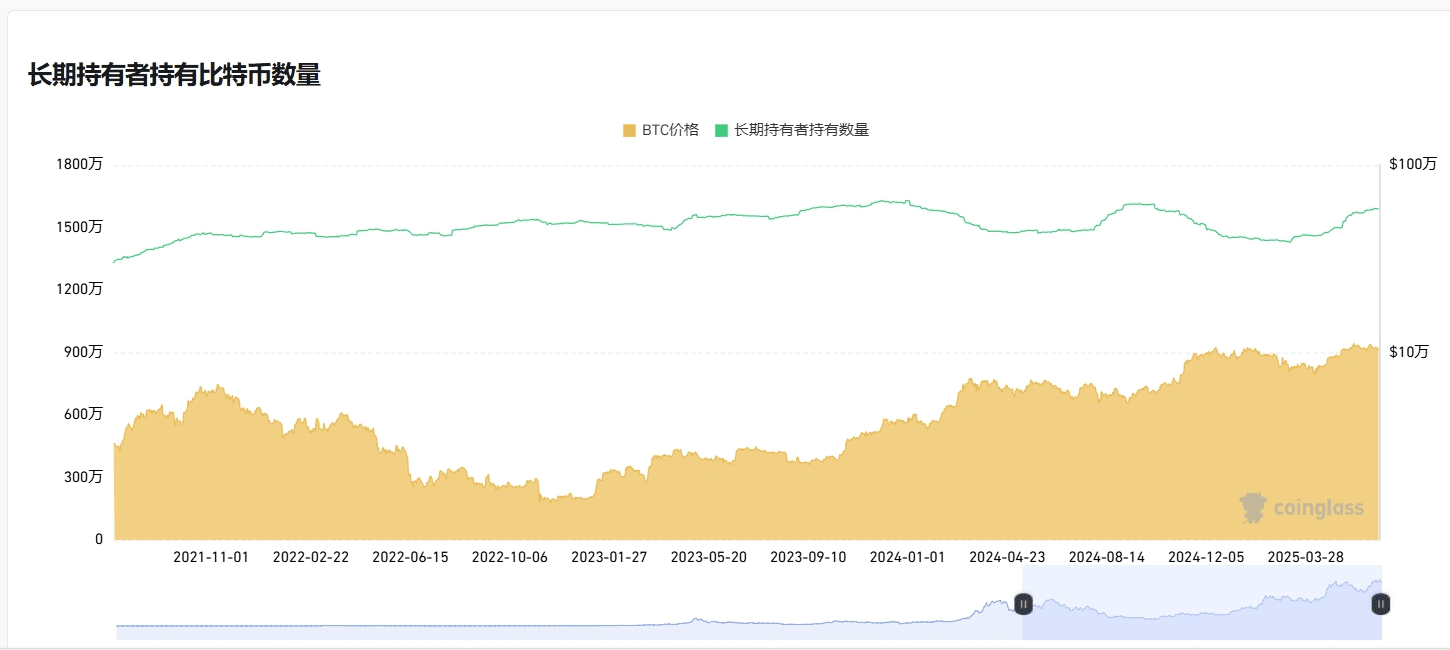
New long-term Bitcoin holders are continuously accumulating.
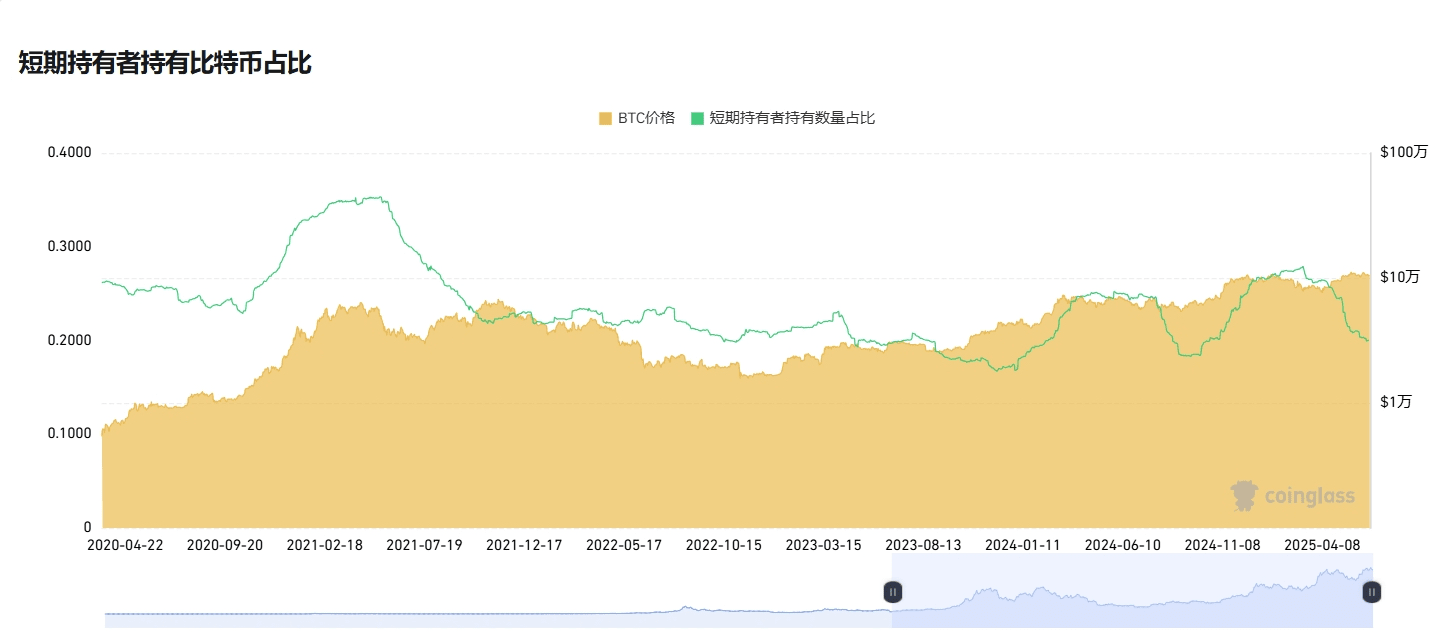
Short-term BTC holders in the market are continuously selling off.
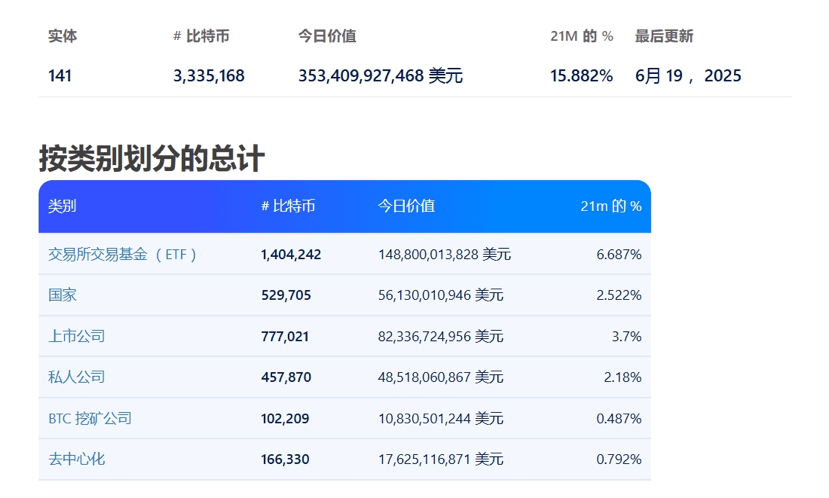
Over 100 companies hold 830,000 BTC (about $86.4 billion), BlackRock increased its holdings of $750 million in ETH in June, reflecting ongoing institutional positioning.
3. Current state and key contradictions in the Bitcoin market.
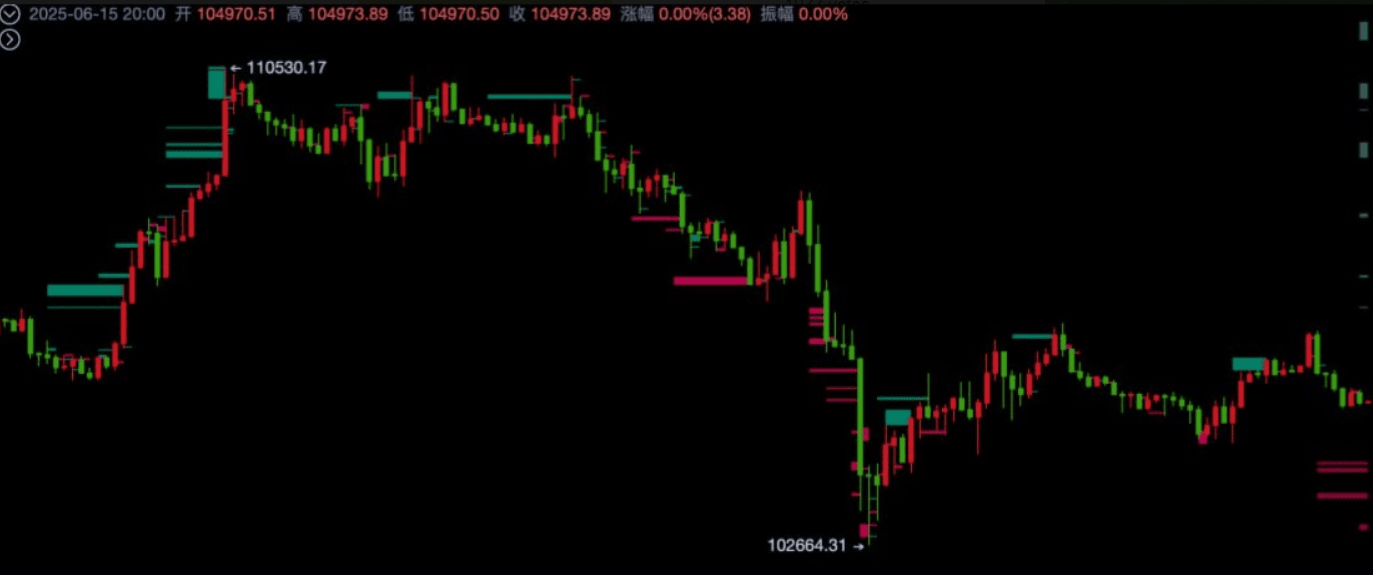
Technical triangle convergence and directional choice.
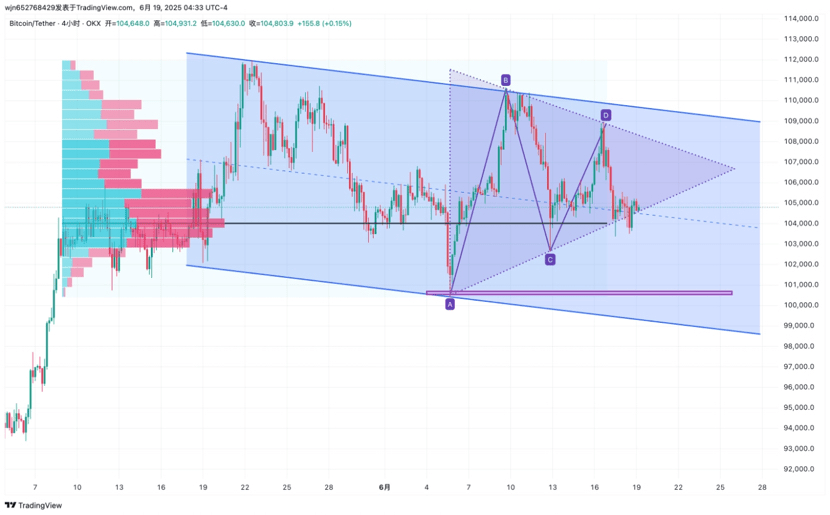
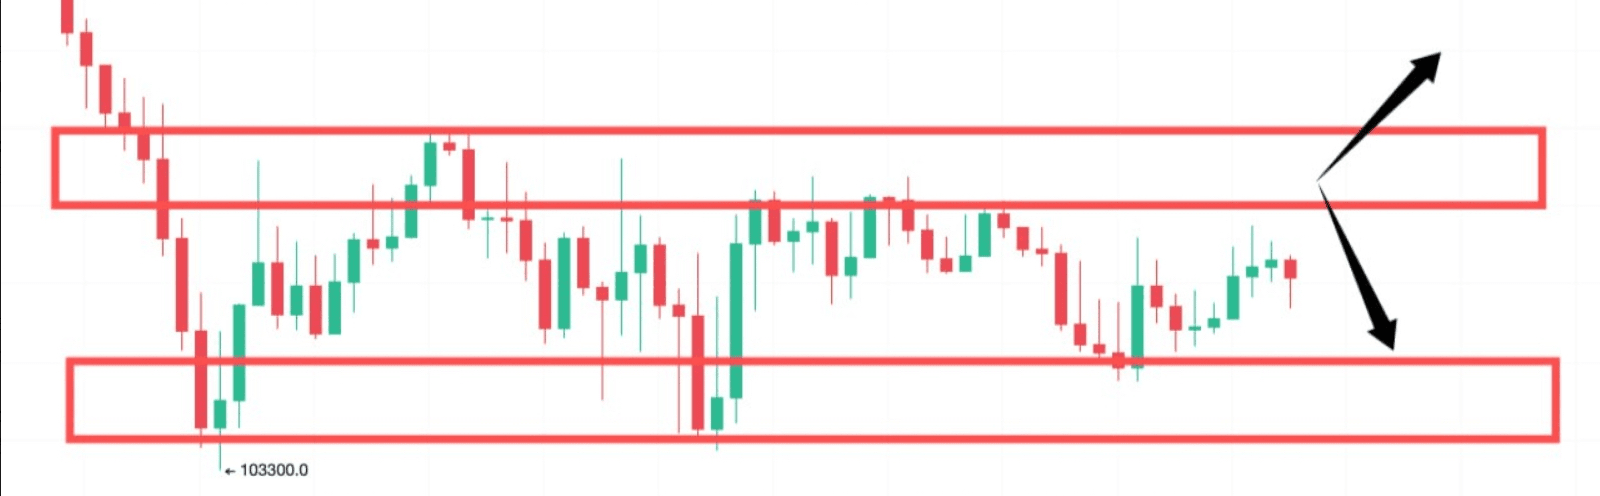
Short-term volatility range narrows: Support at $103,400 vs resistance at $105,600, with the Bollinger Bands contracting indicating that volatility is about to break out.
The struggle between bulls and bears intensifies:
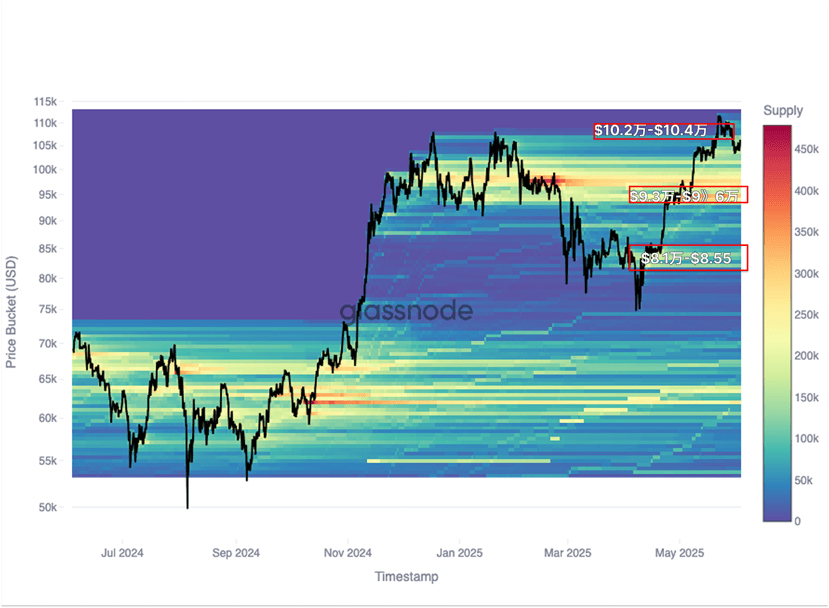
Bullish signal: The range of $104,000-$105,000 has more than 1.2 million BTC in stock, with strong support at $93,000-$98,000.
Short-selling risk: Three attempts to breach $110,000 have failed, MACD bearish momentum is strengthening; if it falls below $103,100, it may trigger a deep correction.
Divergence between on-chain data and market sentiment.
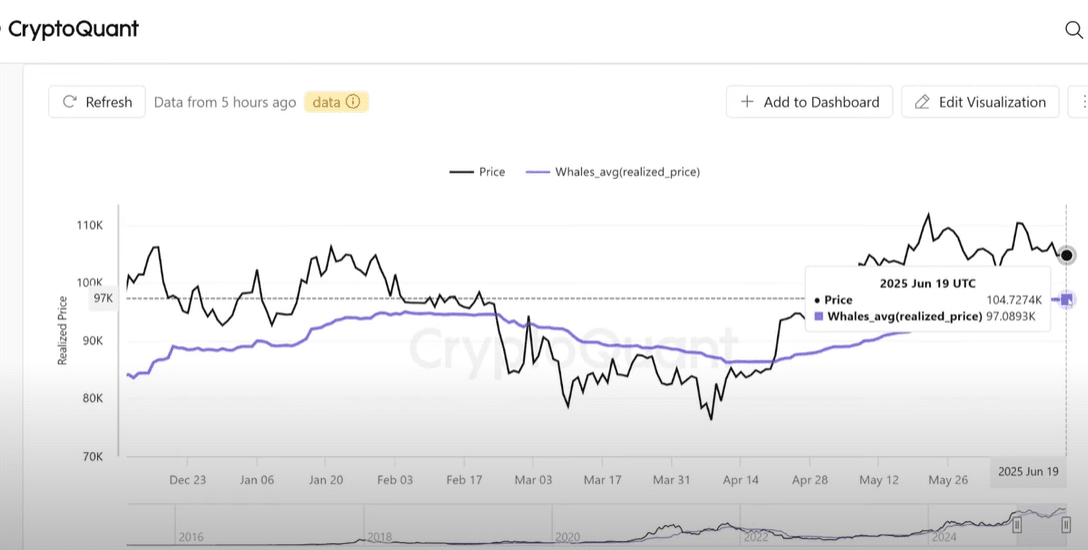
BTC prices realized respectively.
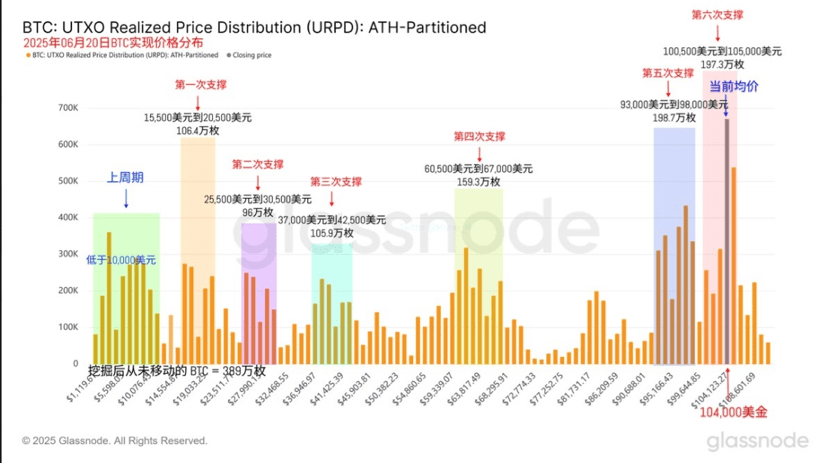
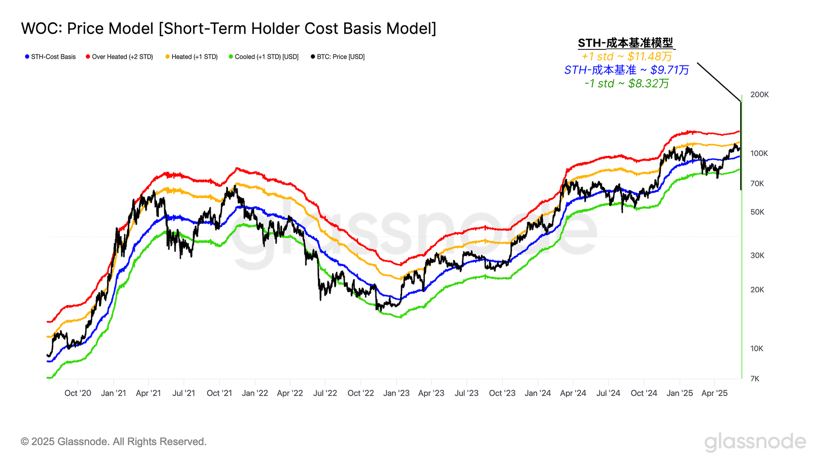
The holding cost of new whales on Wall Street is around $97,000.
The realized profit ratio of long-term holders and short-term holders of BTC.
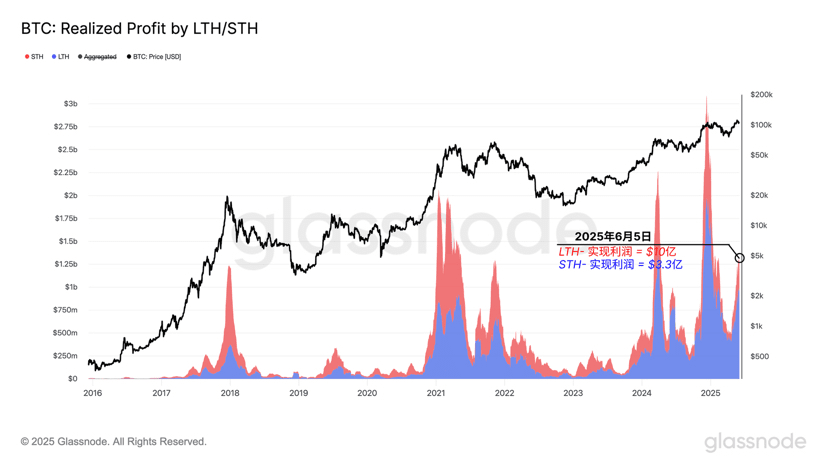
Long-term holders (holding time over 6 months) realize about $1 billion in profit daily.
Recent selling pressure mainly comes from long-term holders taking profits at high levels.
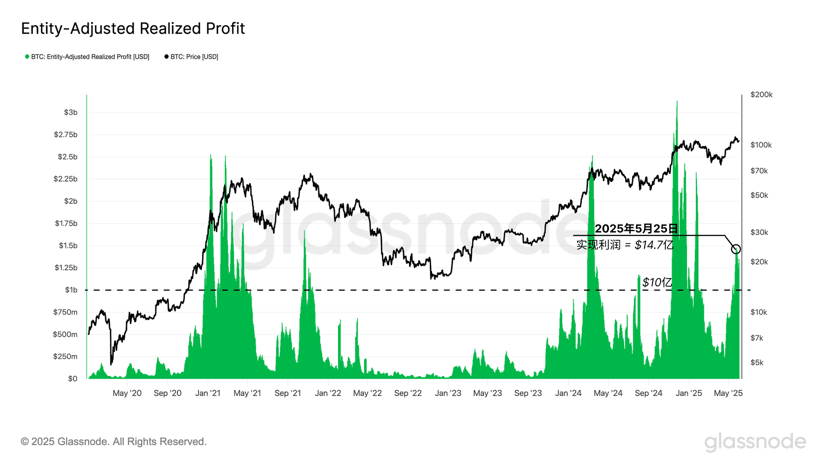
As well as some short-term holders cashing out profits at high levels.
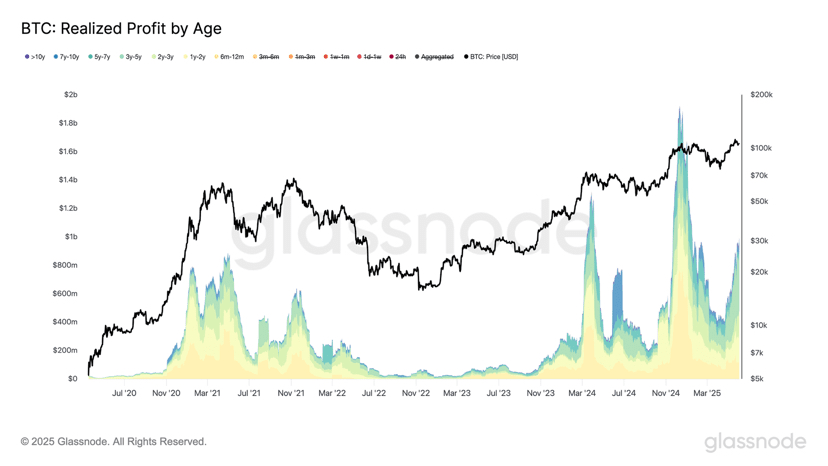
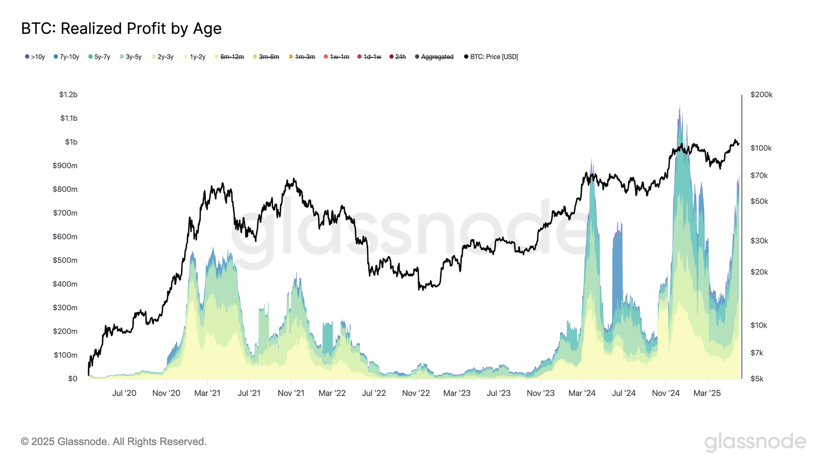
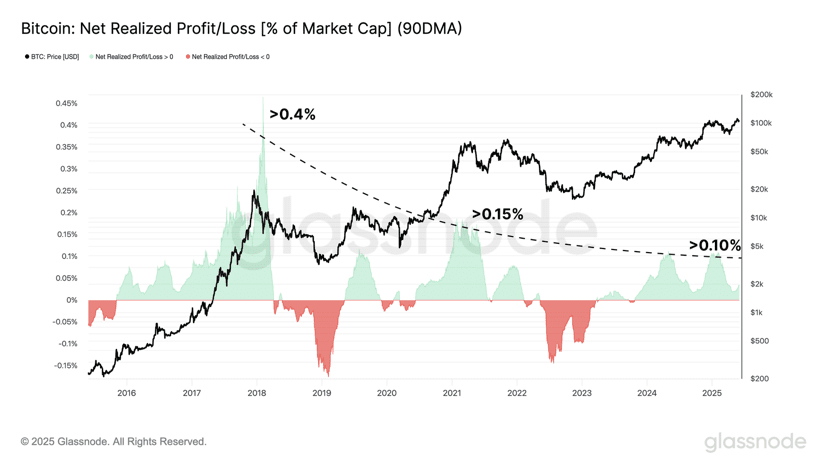
90-day normalized net profit realization based on market capitalization.
The number of transactions settled daily on the Bitcoin network shows a clear downward trend.
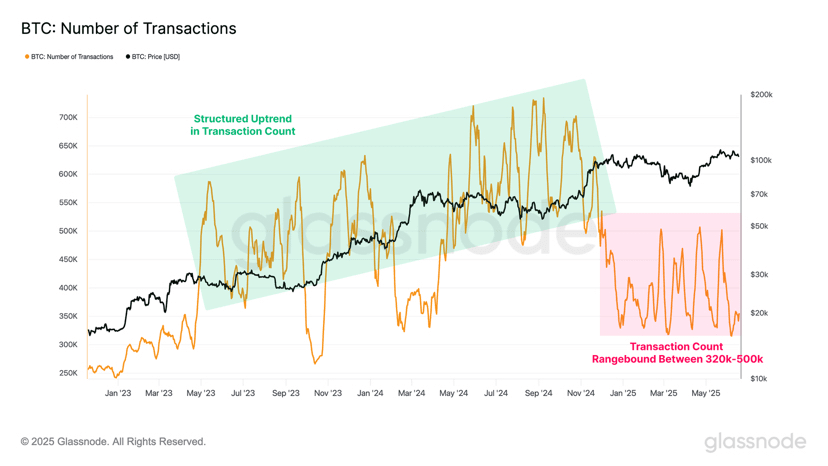
Trading volume drops to an 18-month low: The 7-day average trading volume is only 316,000 transactions (peak 700,000), reflecting a decline in retail participation.
The options market is cautious: The maximum pain point for options expiring on June 21 is $100,000, with the open interest of put options higher than that of call options.
4. Key observation points and strategy suggestions for the future market.
Breakout signals and risk thresholds.
Upward conditions: Stabilize above $105,500 and break the downward trend line, target $107,000→$108,500.
Downside risk: If it falls below $103,400, it may test $102,000→$100,600; falling below $100,600 will confirm the large cycle top.
Institutional behavior and macro correlation.
The U.S. dollar index (DXY) dominates long-term trends: The dollar has fallen to a three-year low (DXY<100), providing support for BTC, but if Iran blocks the Strait of Hormuz, short-term safe-haven assets may decline together.
Fed policy and inflation: If U.S. Treasury yields rise 'disorderly' or expectations for rate hikes heat up, it may suppress risk assets.
Holding strategy suggestions.
Patience in spot positioning: Avoid chasing highs, look for buying opportunities in the $75,000-105,000 range, with an allocation ratio ≤15%.
Derivative caution against leverage risk: Total open positions of BTC contracts across the network reach $6.939 billion (CME accounts for $16.5 billion), price fluctuations are likely to trigger liquidations.
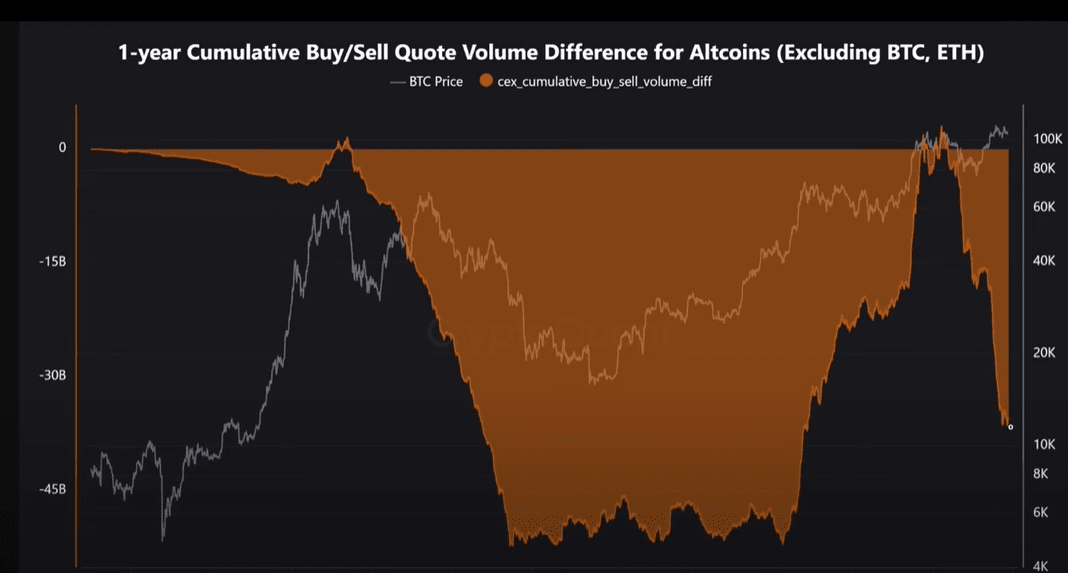
Looking at the total buying and selling amount of all altcoins, the market is continuously selling altcoins, which can be a buying opportunity at lower prices.
5. Summary: Resilience amid contradictions awaits a catalyst.
Bitcoin demonstrates resilience amidst the tug-of-war between 'geopolitical capital inflow' and 'technical fatigue', with institutional accumulation and on-chain sediment forming support, but breakthroughs require stronger demand catalysts (like Fed rate cuts, incremental funding for spot ETFs). In the short term, focus on the direction of triangle convergence breakout, while in the medium to long term, remain anchored to the U.S. dollar trend and global liquidity changes.
1. Greed and Fear Index today: 48 Neutral. BTC has stabilized quickly after experiencing a pullback in market sentiment.
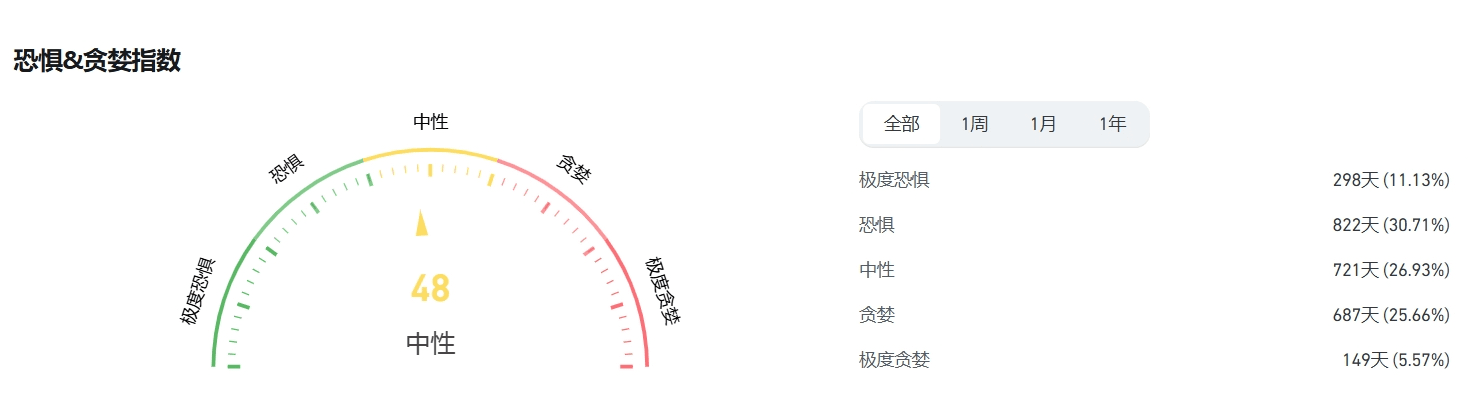
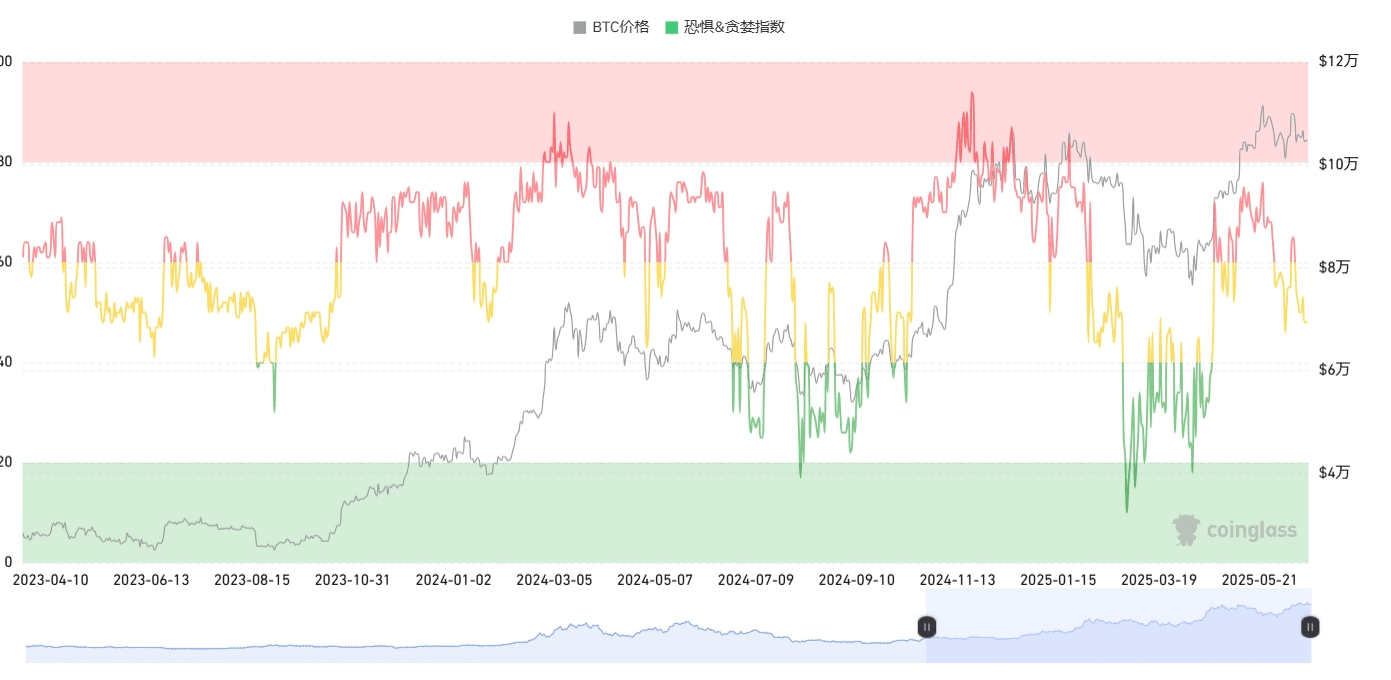
**Interpretation of the Greed and Fear Index.
The behavior of the cryptocurrency market is highly emotional. When the market rises, people tend to be greedy, feeling the fear of missing out; when the market falls, they irrationally react by selling their cryptocurrencies.
By leveraging the greed and fear index, we hope to help friends avoid being influenced by their emotional factors and making irrational judgments.
There are two states:
Extreme fear indicates that investors are overly worried, which may present a buying opportunity.
Excessive greed indicates that investors are overly excited, and the market may undergo a correction.
2. Bitcoin's total market share 63.66 is basically flat compared to yesterday.
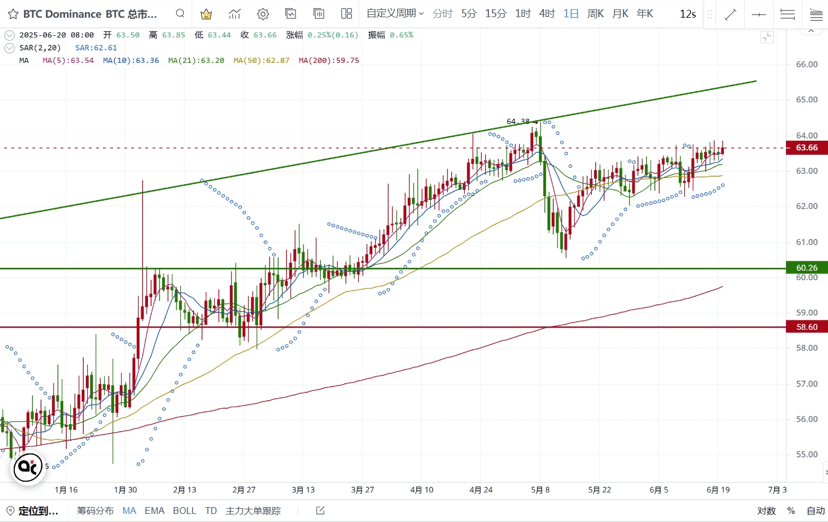
**Bitcoin's total market share is the core indicator for measuring Bitcoin's relative influence in the entire cryptocurrency market. This indicator reflects not only Bitcoin's short-term market position but also reveals changes in fund rotation, investor sentiment, and macro trends.
Bitcoin's market share is a 'wind vane' for assessing market stages:
Early stage of a bull market: Market share increases, funds prioritize allocation to Bitcoin.
Late-stage bull market: Market share declines, funds rotate to altcoins, triggering 'altcoin season'.
Market thermometer: >60% = risk aversion dominant; <40% = altcoin frenzy period.
Capital flow chart: Reveals institutional and retail allocation preferences (Bitcoin → stable, altcoins → high risk and high return).
3. Bitcoin and Ethereum trading pair 0.023909 Ethereum to Bitcoin trading is basically flat.
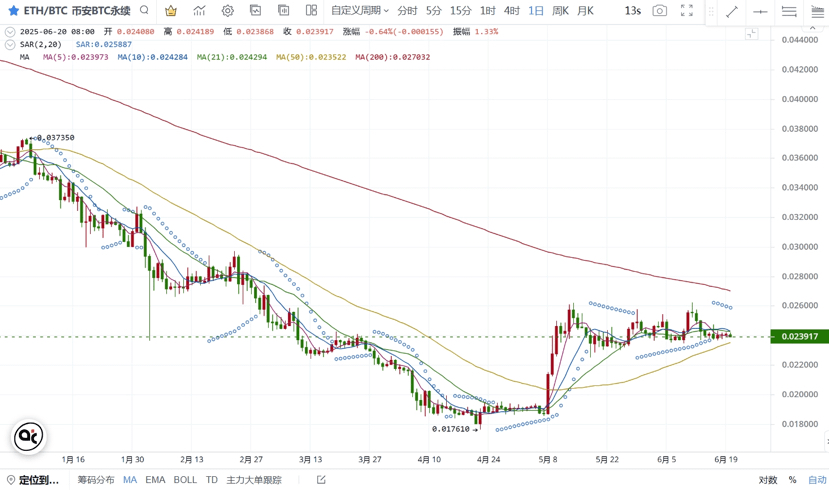
**The Bitcoin/Ethereum trading pair is the 'risk thermometer' of the cryptocurrency market:
The ratio is rising → The market prefers high-risk assets (signal for altcoin season to start);
The ratio is declining → Funds are seeking safety in Bitcoin (characteristics of either a bear or early bull market).
4. ETF inflow and outflow data ETF data maintains a net inflow for 8 days (U.S. stock market closed).
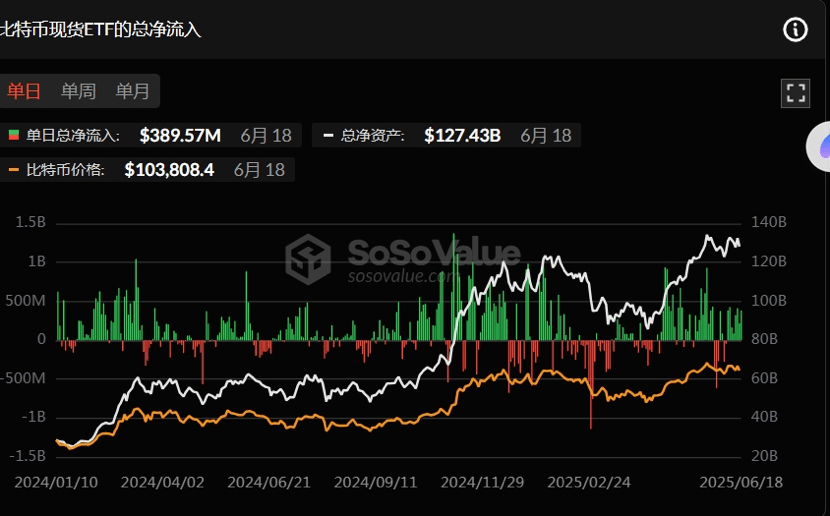
**ETF inflow and outflow data indicate: The inflow and outflow data of Bitcoin ETFs are core indicators for tracking institutional sentiment, market trends, and fund rotation.
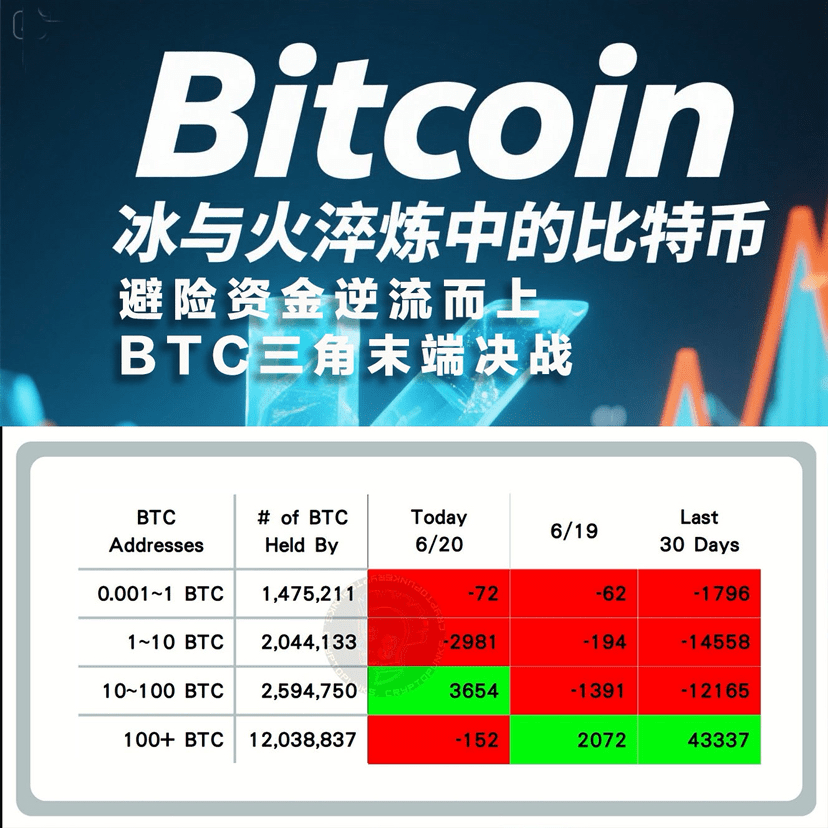
5. Statistics on on-chain BTC buying and selling data from retail, large holders, and institutions. Large whales selling small amounts.
Thanks to @TradingPunk for providing data collation and sharing.
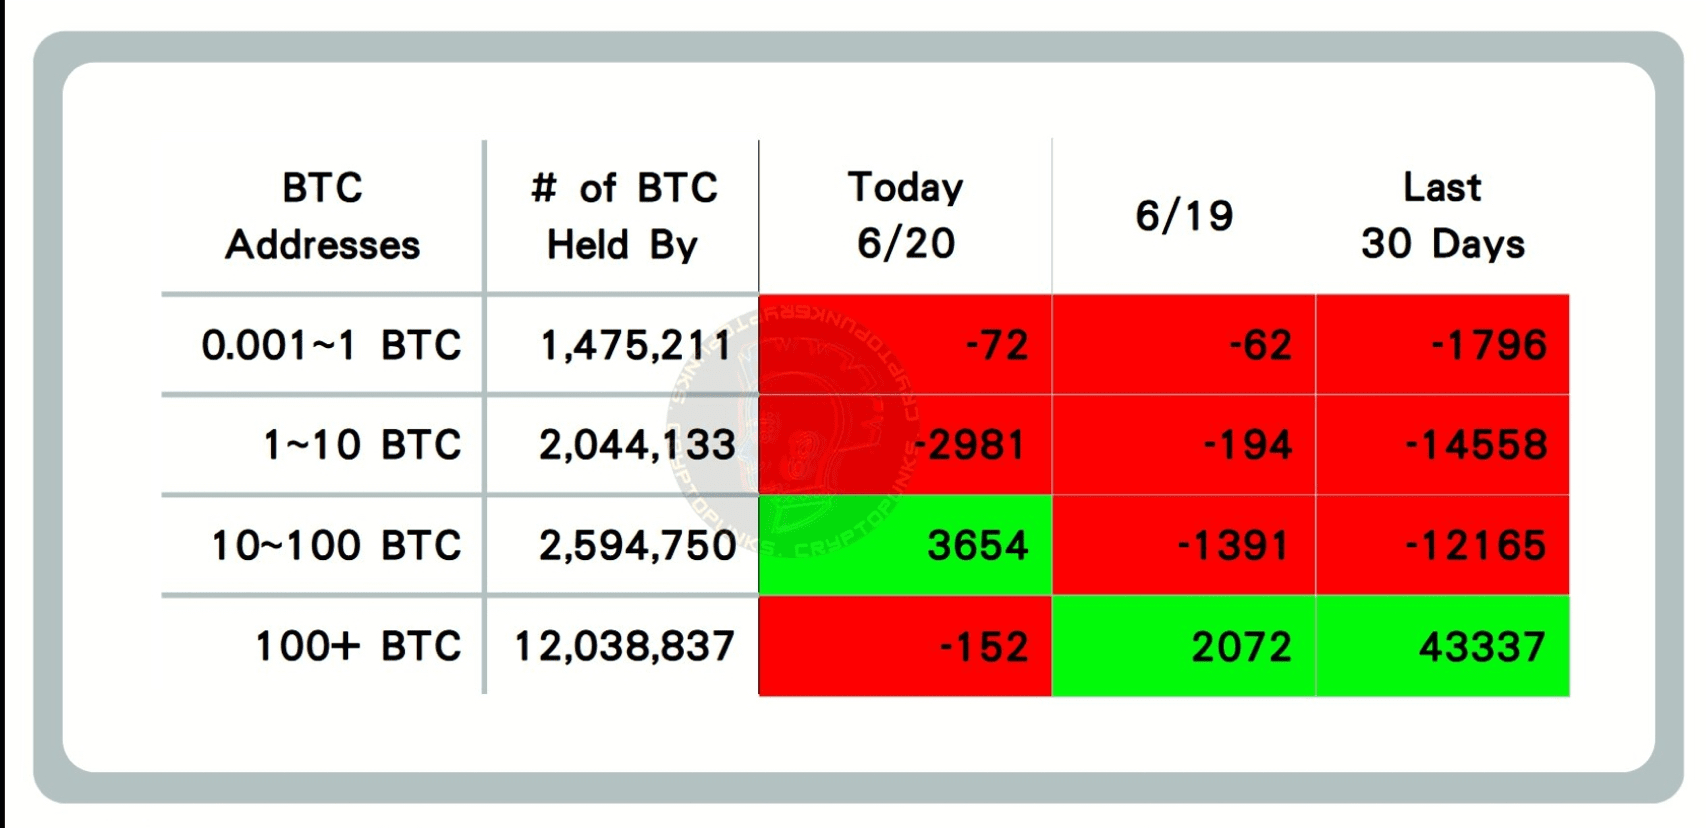
Data explanation: Represents the increase or decrease of BTC flowing on-chain for ≤ 1 BTC, 1-10 BTC, 10-100 BTC, and 100+ BTC, which can reflect a kind of market sentiment among retail investors, large holders, and institutions.
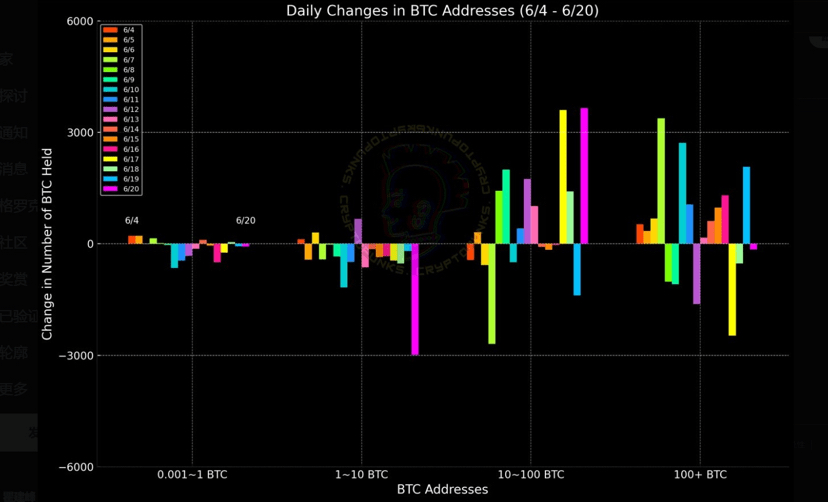
Data explanation: This data reflects the increase or decrease of BTC flowing on-chain within a week for ≤ 1 BTC, 1-10 BTC, 10-100 BTC, and 100+ BTC, which visually reflects the liquidity trends of retail, large holders, and institutions in the market.
When an extreme situation occurs in on-chain data, a reversal often happens (for example, if large whales of over 100 BTC appear and buy heavily while others sell, the probability of Bitcoin rising significantly increases, and vice versa for falling). This must also be analyzed in conjunction with other on-chain data and technical indicators.
6. MVRV realized market value ratio MVRV > 1.
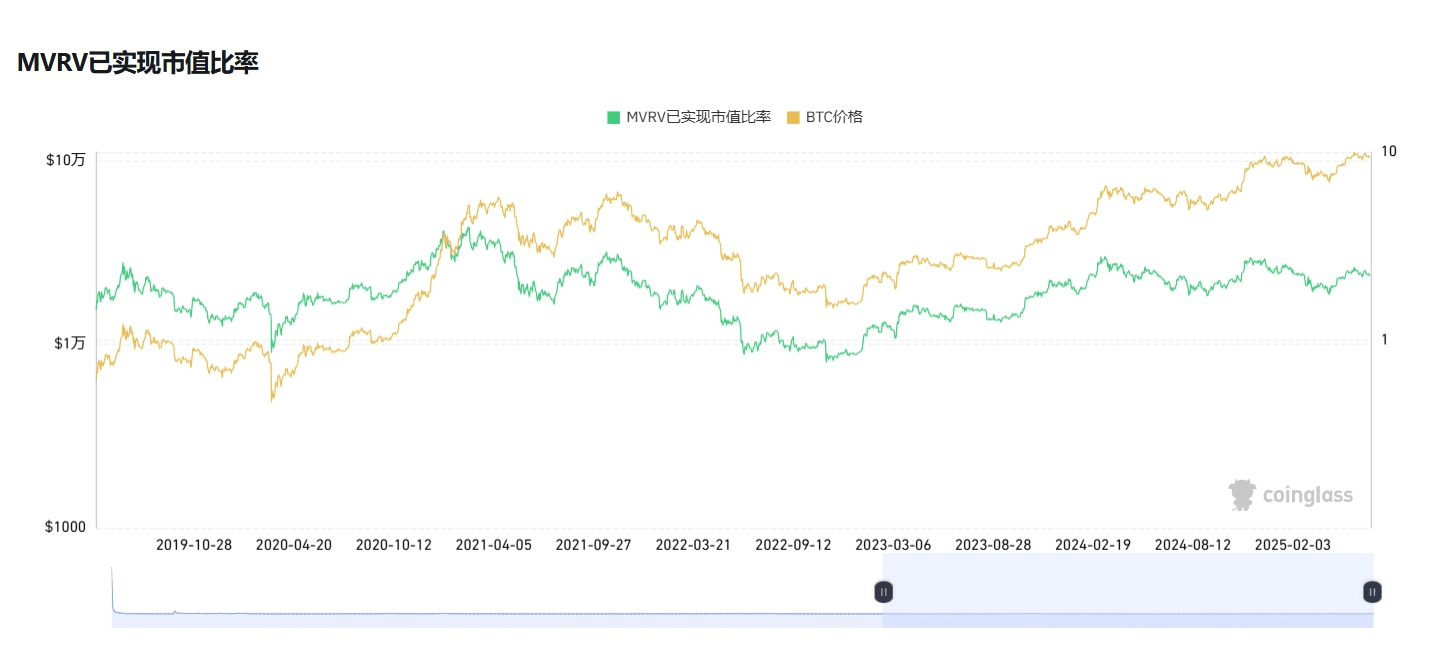
**Explanation of the MVRV realized market value ratio indicator: The MVRV realized market value ratio is a metric used to assess the cryptocurrency market (especially Bitcoin). This indicator can help friends determine whether an asset is overvalued or undervalued and identify potential market cycle tops and bottoms.
MVRV > 1.
When the ratio is greater than 1, it indicates that market prices are above realized prices, meaning most holders are in profit. This may indicate that the market is overheated, especially when MVRV reaches historical highs, potentially signaling a market top.
MVRV < 1.
When the ratio is less than 1, it indicates that market prices are below realized prices, meaning most holders are in a loss position. This may indicate that the market is undervalued, especially when MVRV reaches historical lows, potentially signaling a market bottom.
7. Altcoin Season Index 18 Is it altcoin season: No Still in a sluggish state.
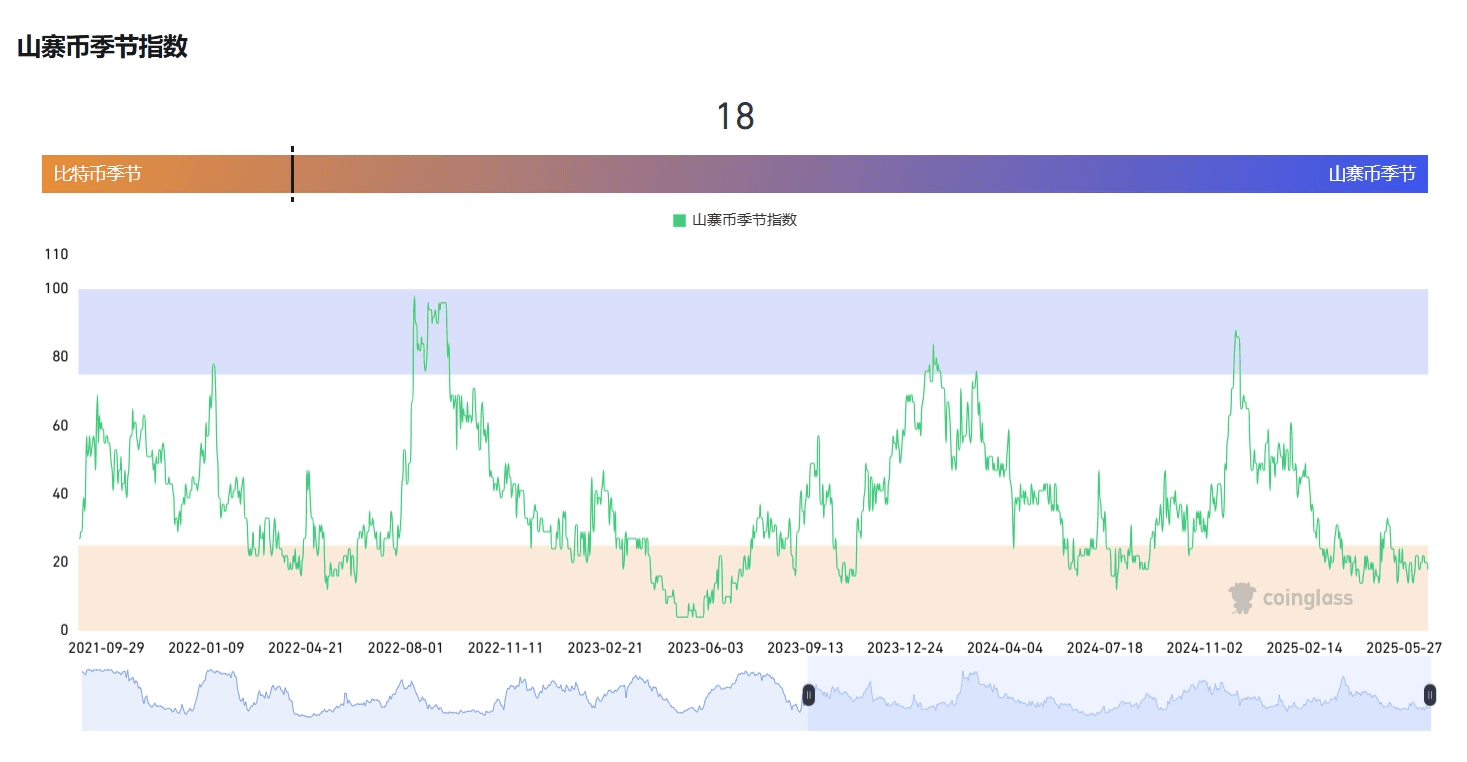
**Altcoin Season Index explanation: The altcoin season index is a metric used to measure the performance of non-Bitcoin cryptocurrencies in the market. It is typically used to determine whether altcoins outperform Bitcoin over a specific time period, helping investors understand market trends and investment opportunities.
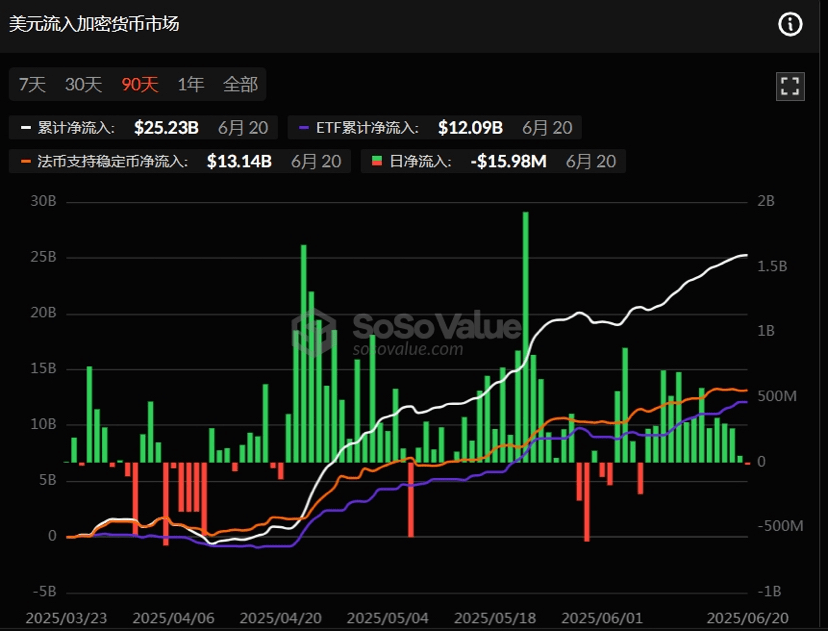
8. U.S. dollars flowing into the cryptocurrency market Slight outflow after continuous inflow.
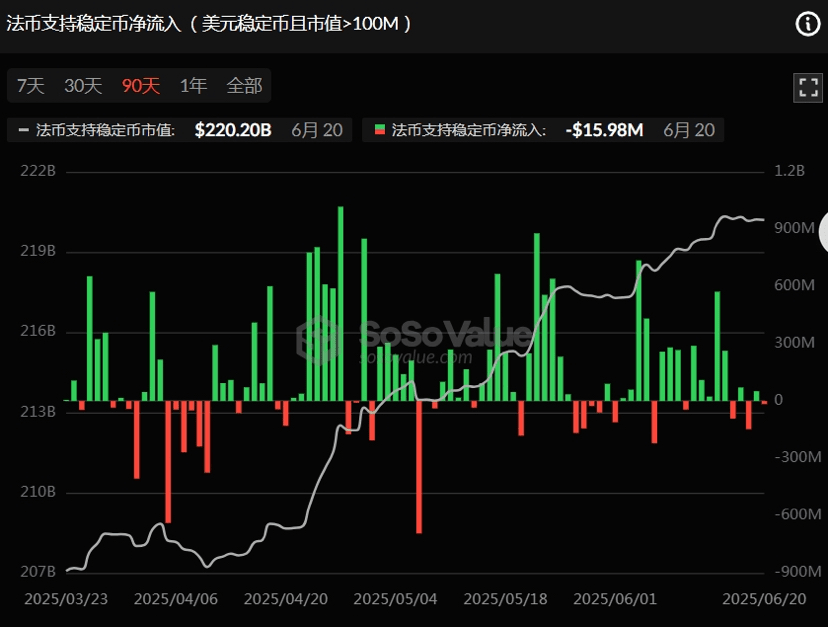
9. Fiat currency supporting stablecoin net inflow (U.S. dollar stablecoins with a market cap >$100M) small outflow.
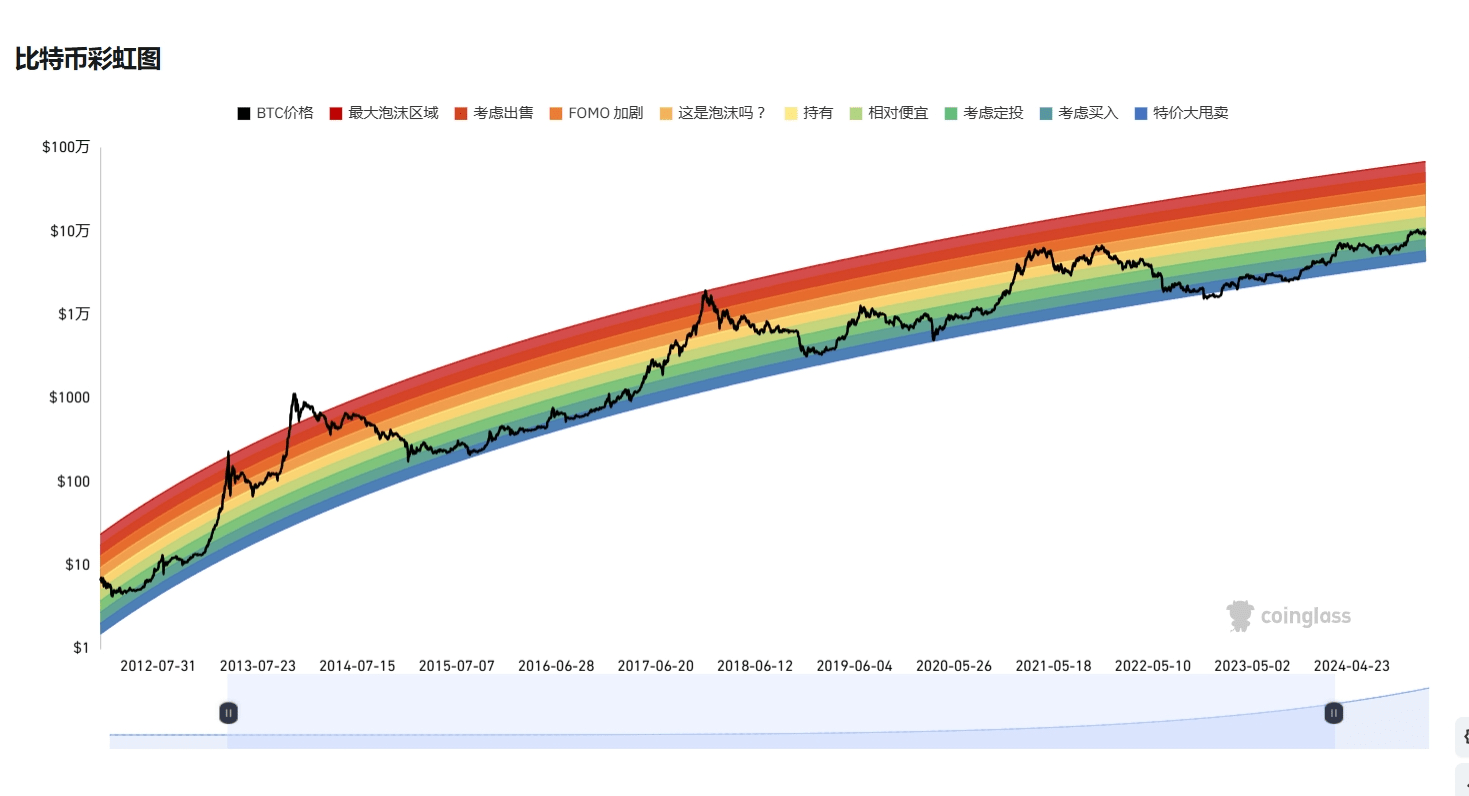
10. The rainbow chart shows that BTC has not shown signs of peaking.
The above data only represents a perspective from on-chain data to predict BTC volatility trends and market sentiment and does not represent any investment advice. Please make careful decisions!!

I am Mingzhu, follow me, I share real-time on-chain data and dynamics every day to help friends make predictions and decisions. Don't miss out, feel free to leave comments for discussion.