1. Market Overview: The calm before the storm.
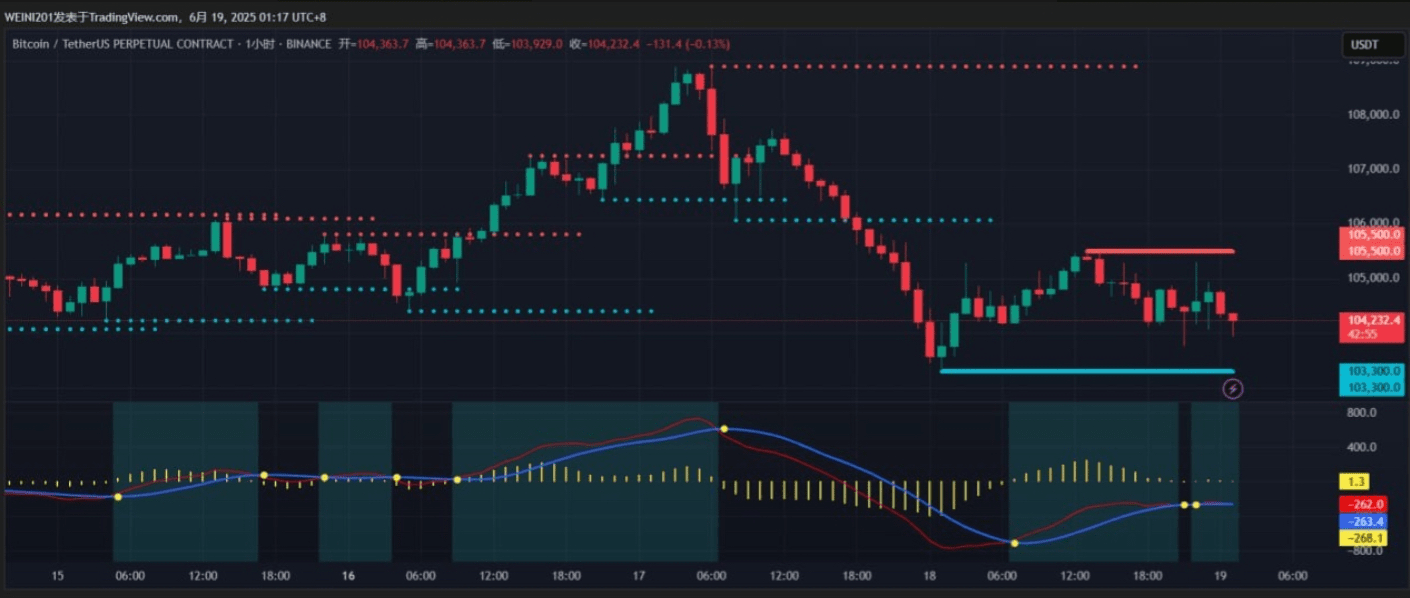
BTC price: $105,004 (24h -0.43%), with the oscillation range narrowing to $102,600~$106,000.
Spot ETF capital flow:
BTC net inflow +$388.3M (8 consecutive days of net inflow, BlackRock IBIT accounted for $279M).
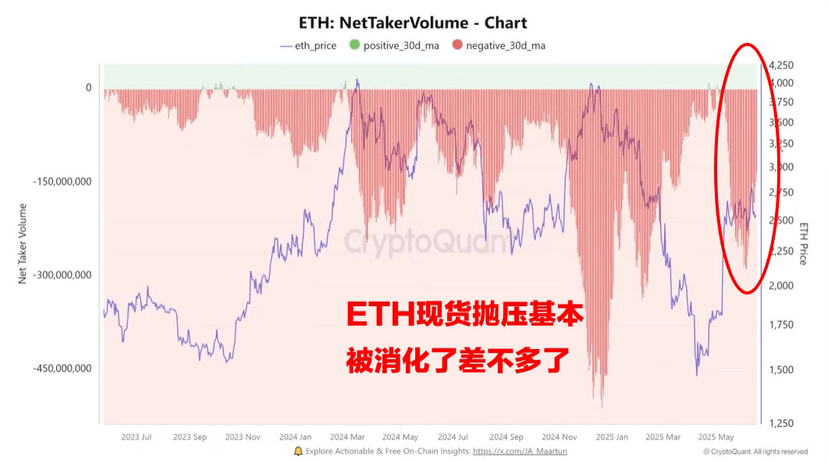
ETH net inflow +$19.1M, staking volume hits historical high (35 million coins).
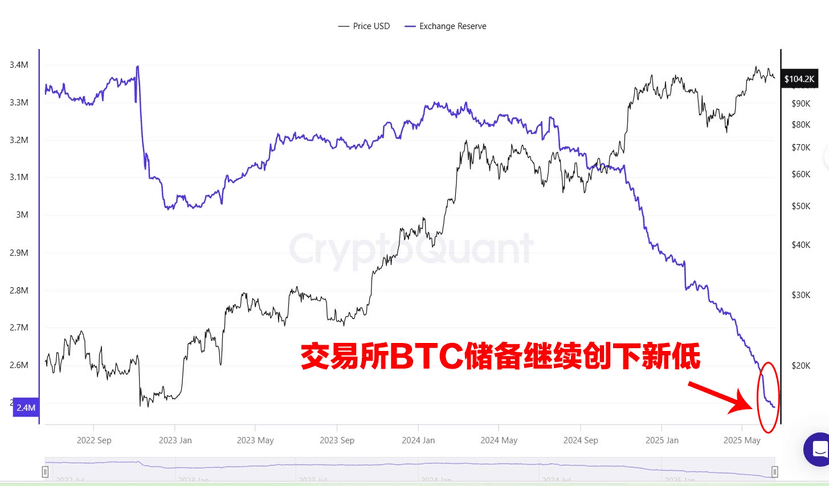
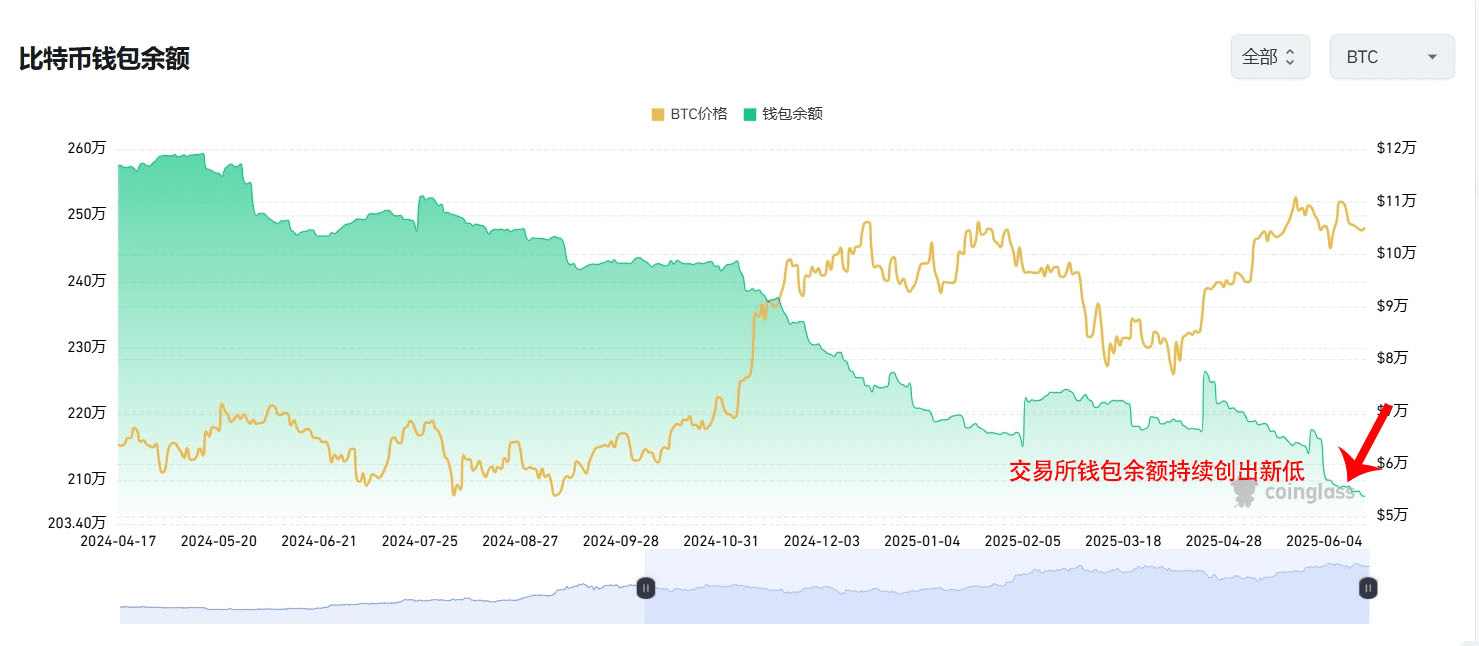
Exchange reserves: BTC supply falls to a 22-month low, with an intensifying unwillingness to sell.
2. On-chain data: Whales vs. Retail Extreme Differentiation.
Whales strongly accumulate.
$100k+ address single-day increase reaches near 7-day peak, continuing the accumulation trend since February.
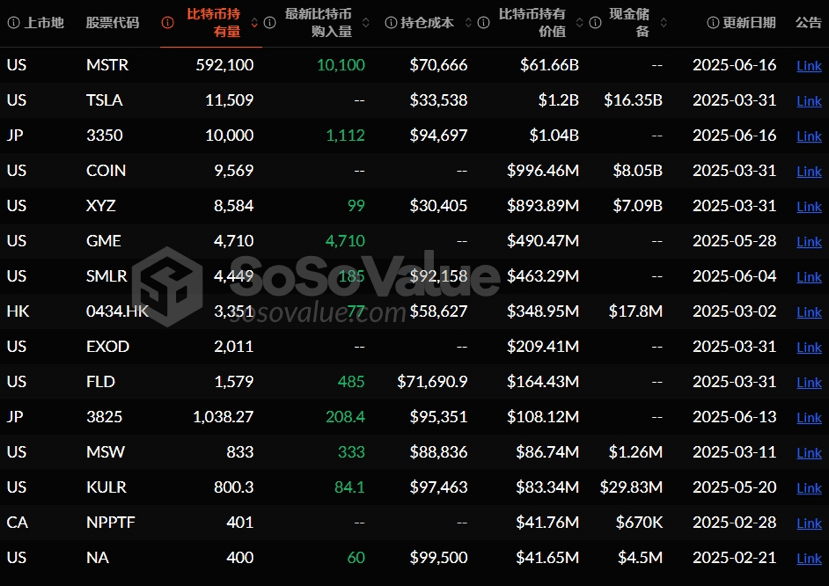
Listed companies' BTC reserves exceed 768,500 coins (valued at $82 billion), with MicroStrategy and BlackRock leading the 'institutional hoarding wave'.
 Retail panic selling.
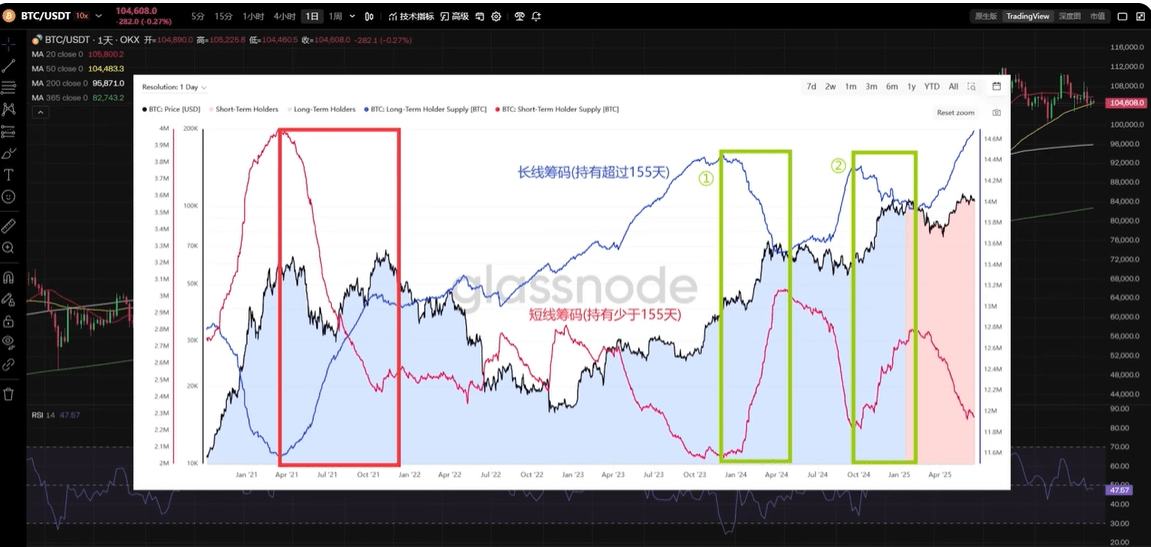
<100 BTC addresses continue to decrease, on-chain turnover rate drops by 15%, small investors exit during the oscillation.
Extreme sentiment signal.
History shows: Whale accumulation + retail sell-off often indicates the formation of a mid-term bottom, as seen with a 48% rise in BTC after October 2024.
3. Capital flow: ETF support vs. geopolitical pressure.
Total ETF holdings $127.425 billion (accounting for 6.12% of market value), significant institutional support.
BlackRock IBIT single-day inflow +$279M (over 2,600 BTC) core tool for hedging geopolitical risks.
Stablecoin issuance: Tether minted 1 billion USDT in a single day, potential buying power ammunition accumulated.
Contradiction: Middle East conflict triggers risk aversion ➕ Fed's hawkish signal (maintaining interest rates + lowering 2026 rate cut expectations) suppresses risk appetite.
4. Technical Analysis: End of triangle convergence
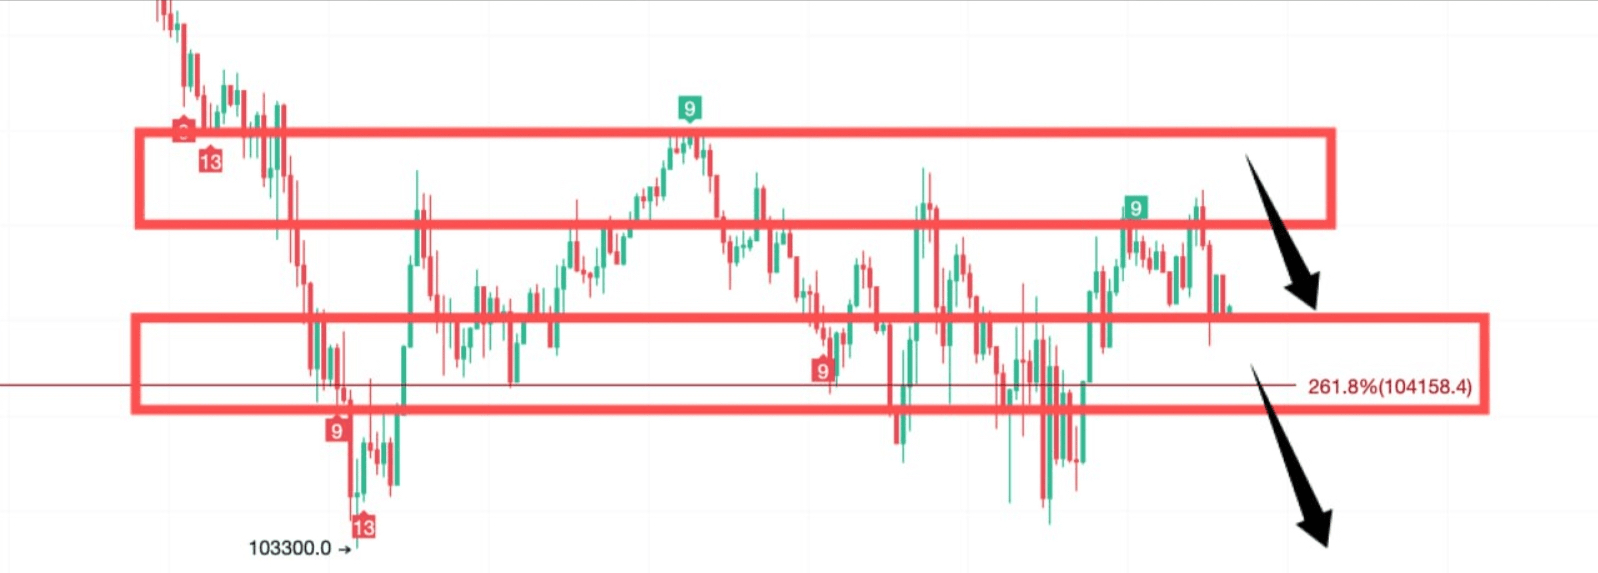
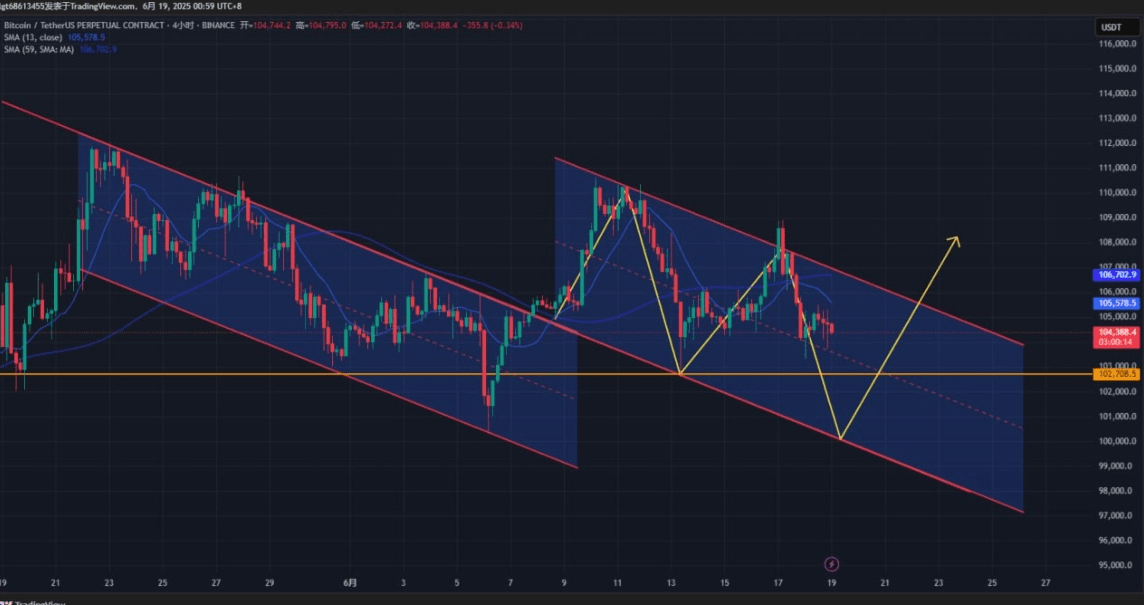
Current price $105,000.
Key watershed.
Upward breakout: 106,000 → accelerate.
Downward breakdown: 102,600 → test 100,000.
Long-short critical point:
Resistance: 105,500-106,000 (4H mid-line + channel upper bound).
Support: 102,600 (4H previous low) → 102,000 (strong support at daily lower bound).
ETH linkage: oscillation range 2,420~2,580, breakout at $2,580 can chase the rise.
5. Market sentiment: Extreme differentiation in wait-and-see.
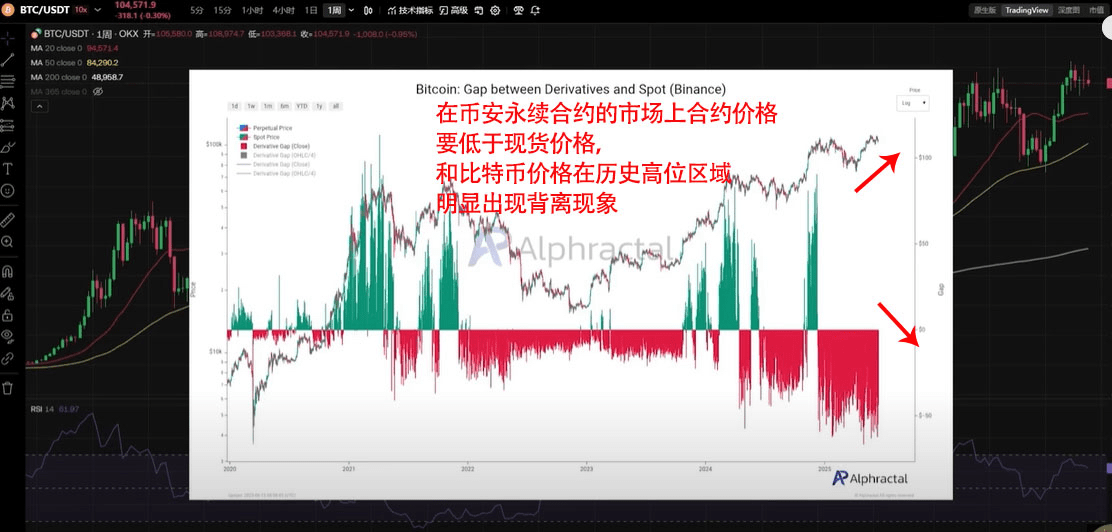
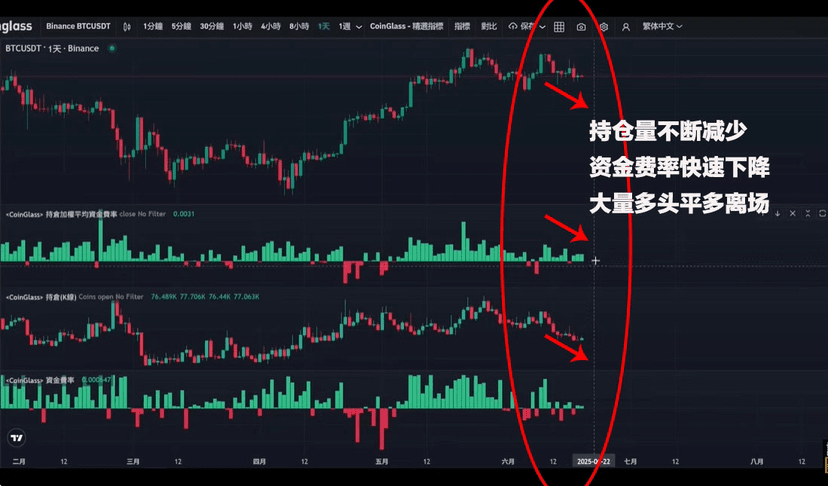
Derivatives signal:
BTC perpetual contract funding rate continues to decline.
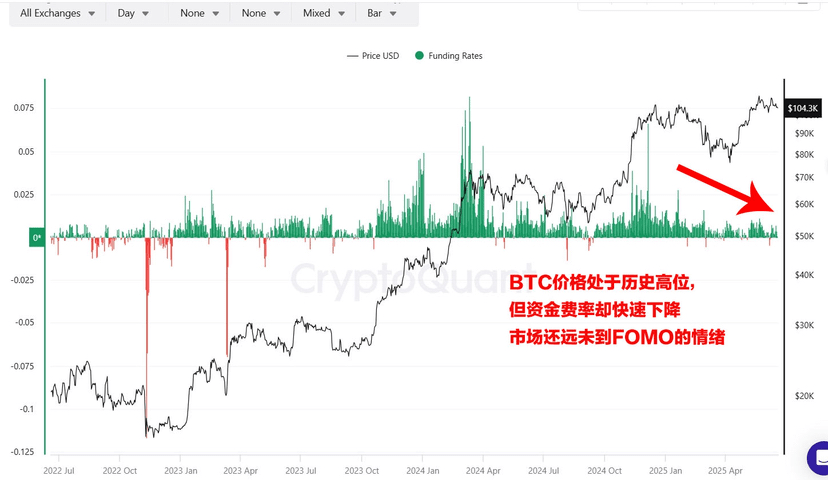
Demand for put options surges, investors guard against downside risk.
Macro-sensitive period:
Israel-Iran conflict escalates ➕ Trump criticizes Powell's policies, increasing policy uncertainty.
6. Trading Strategy: Looking for breakthrough opportunities in defense
Bulls close above 106,000, 108,000 buying $110k call options.
Bears break 4H below 102,600, short 100,000 on MSTR stock.
ETH range layout 2,450-2,420, breakout at 2,580 to chase the rise.
Operational key points:
Breaking $105,500 requires volume confirmation, otherwise treat as oscillation.
Prioritize closing leveraged positions during sudden geopolitical events.
7. Summary: Waiting for change catalysts.
Short-term: 102,000-106,000 narrow oscillation continues, breaking depends on geopolitical easing or the Fed turning dovish.
Mid-term:
Whale accumulation + ETF support = $100,000 and below is the institutional accumulation zone.
RWA (such as JPMorgan's on-chain deposit certificates) could引入 hundreds of billions of traditional funds.
Change countdown: The calm before the storm often breeds greater market movements—maintain key levels and follow the trend.
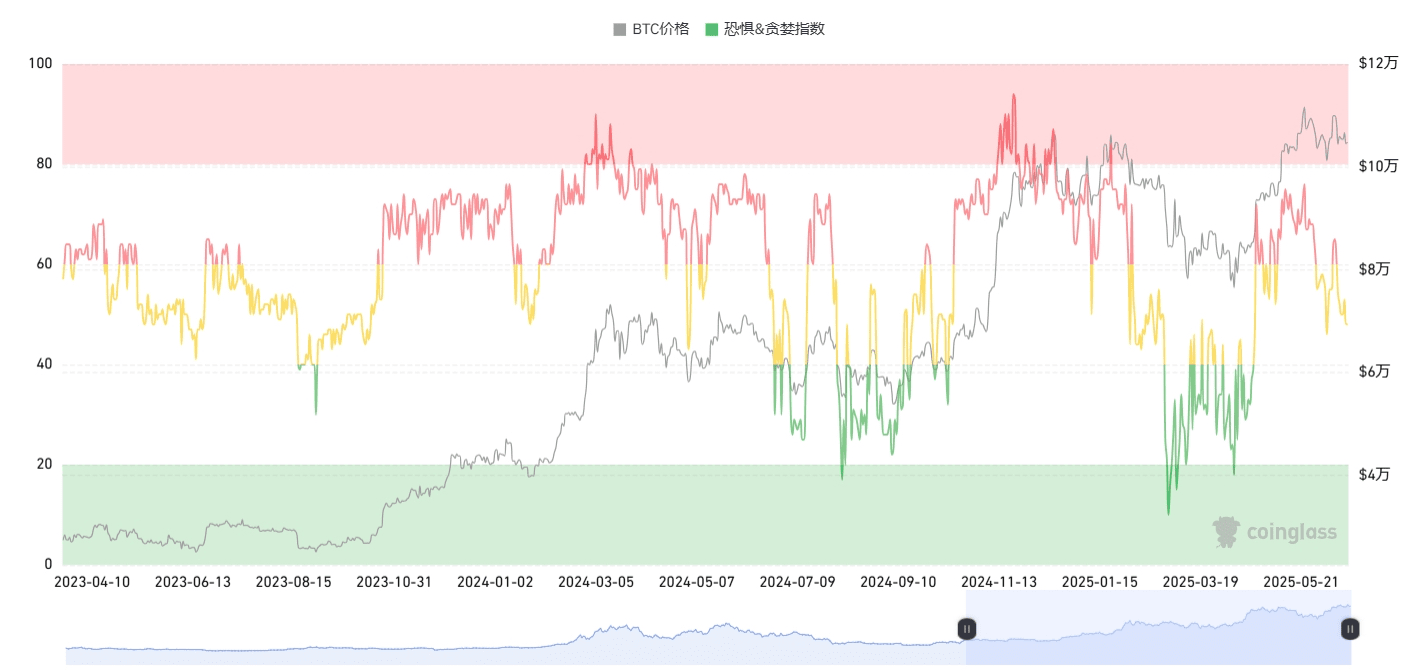
1. Greed and Fear Index today is: 48 neutral. BTC stabilizes rapidly after experiencing a pullback in market sentiment.
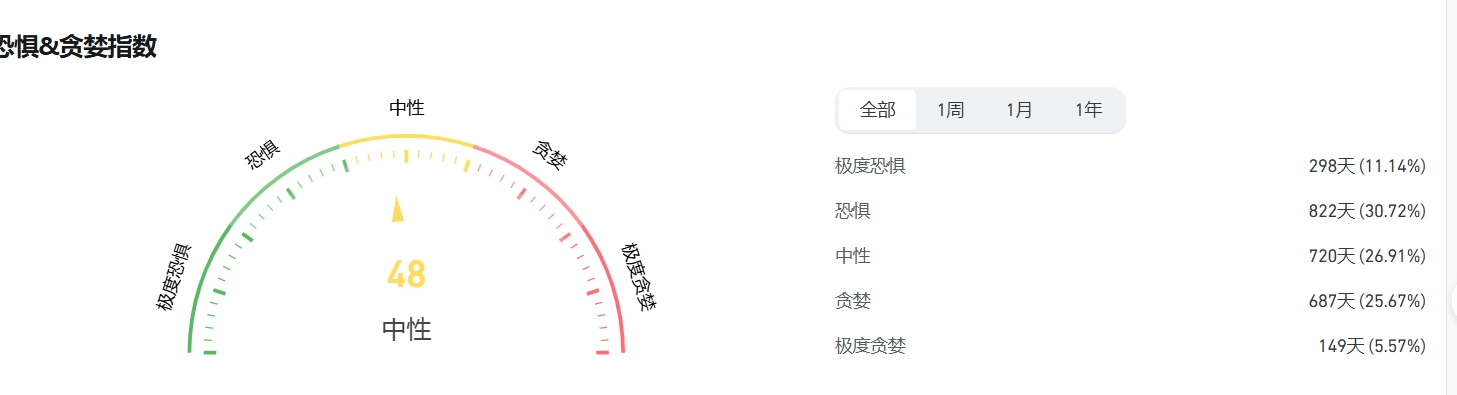
**Greed and Fear/Greed Index Interpretation
The behavior of the cryptocurrency market is highly emotional. When the market rises, people tend to be greedy, fearing they will miss out; when the market falls, they irrationally sell their cryptocurrencies.
Using the Fear and Greed Index to help friends avoid being influenced by their emotions and making irrational judgments.
There are two states:
Extreme fear indicates that investors are overly worried, which could be a buying opportunity.
Excessive greed indicates that investors are overly excited, and the market may undergo a correction.
2. Bitcoin total market share 63.57 remains basically flat from yesterday.
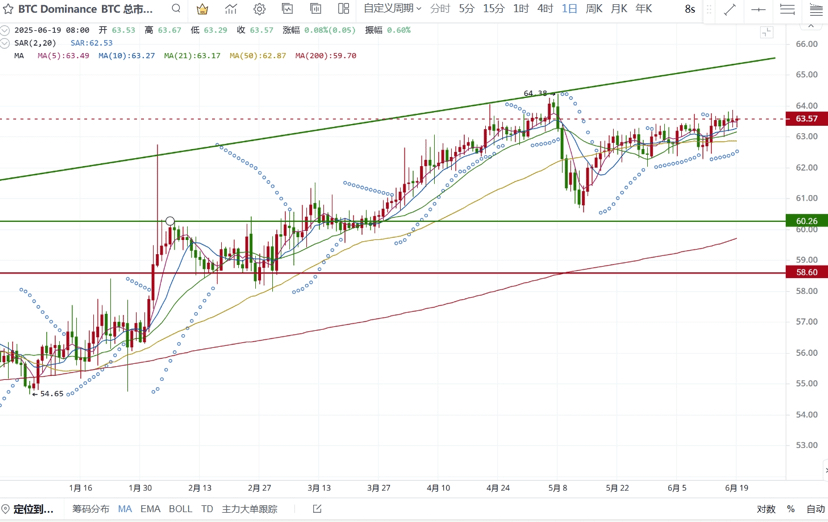
**Bitcoin's total market share is a core indicator of Bitcoin's relative influence in the entire cryptocurrency market. This indicator not only reflects Bitcoin's short-term market position but also reveals changes in capital rotation, investor sentiment, and macro trends.
Bitcoin's market share is a 'barometer' for determining market phases:
Early bull market: market share rises, capital prioritizes Bitcoin allocation.
Late bull market: market share decreases, capital rotates to altcoins, triggering 'altcoin season'.
Market thermometer: >60% = risk aversion dominant; <40% = altcoin frenzy.
Capital flow chart: reveals institutional and retail allocation preferences (Bitcoin → stable, altcoins → high risk and high return).
3. Bitcoin and Ethereum trading pairs 0.024050 Ethereum to Bitcoin trading is basically flat.
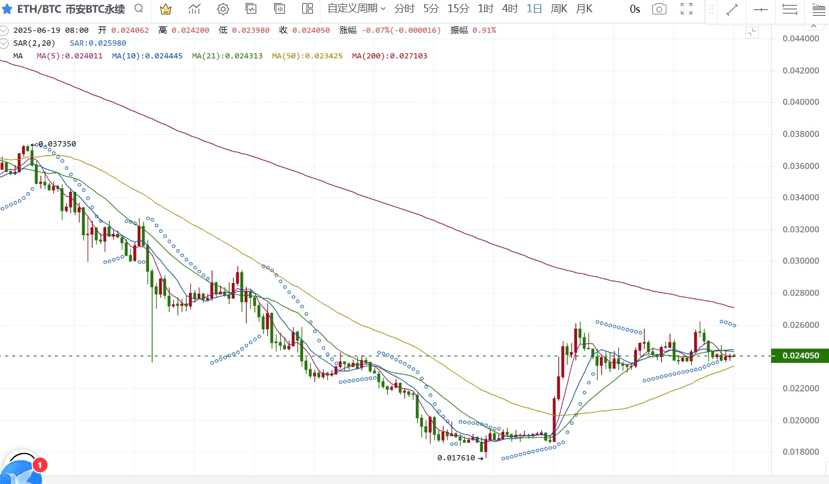
**The Bitcoin/Ethereum trading pair is the 'risk thermometer' of the cryptocurrency market:
Ratio rises → market prefers high-risk assets (signal for the start of altcoin season);
Ratio decreases → capital seeks refuge in Bitcoin (characteristics of a bear market or early bull market).
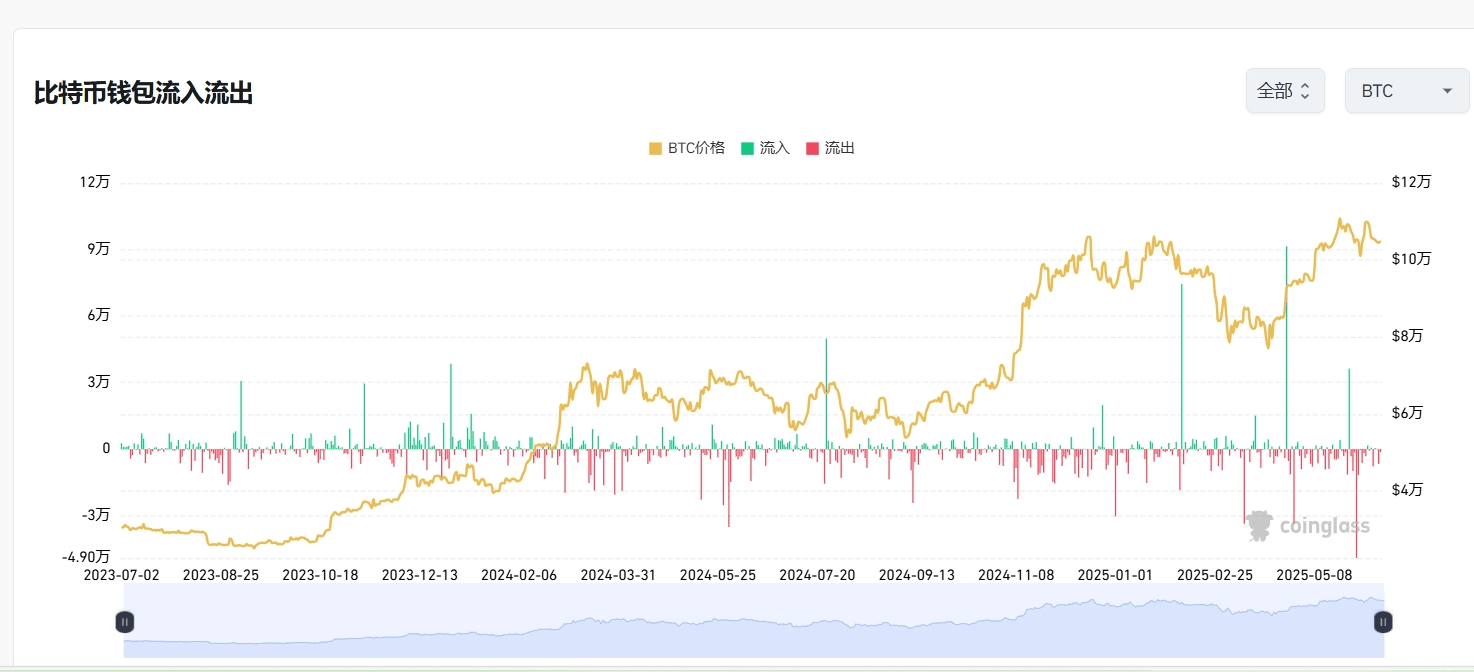
4. ETF inflow and outflow data ETF data maintains 8 days of net inflow.
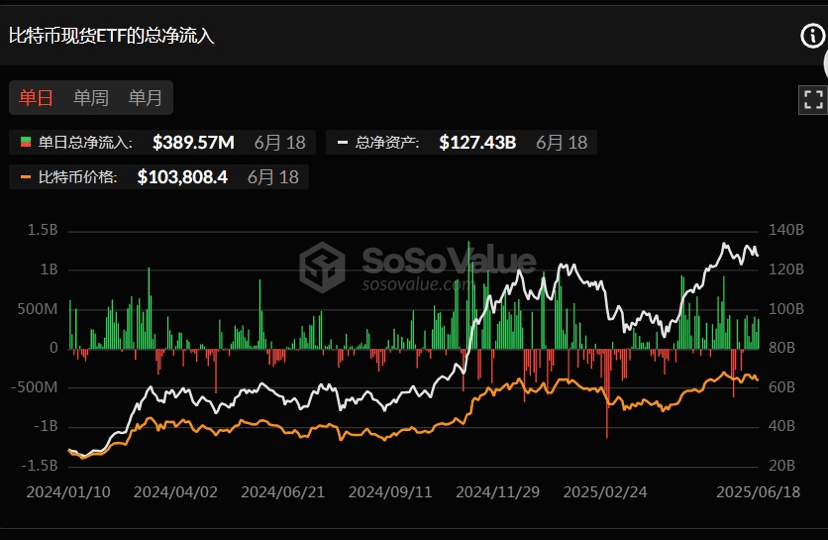
**ETF inflow and outflow data explanation: The inflow and outflow data of Bitcoin ETFs are core indicators for tracking institutional sentiment, market trends, and capital rotation.
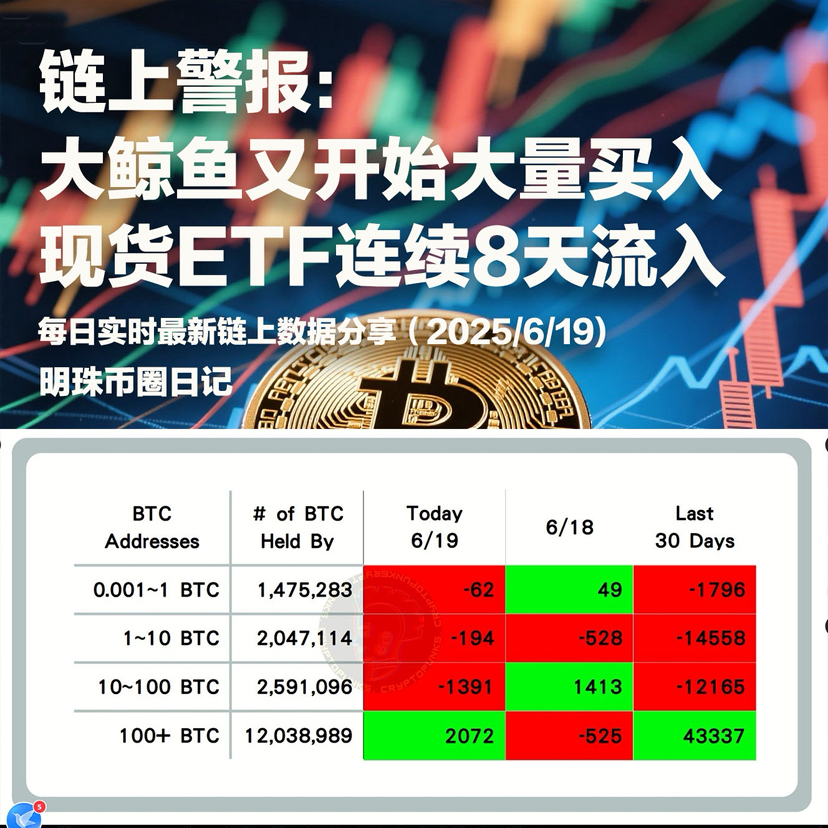
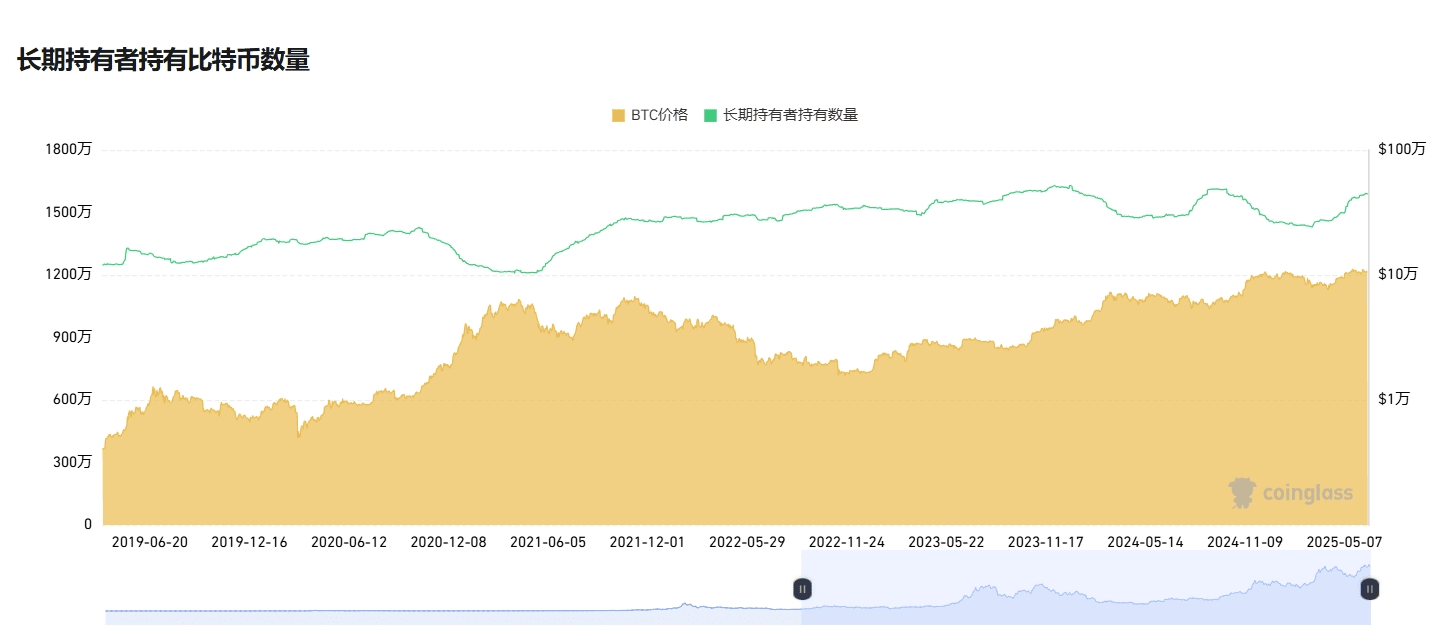
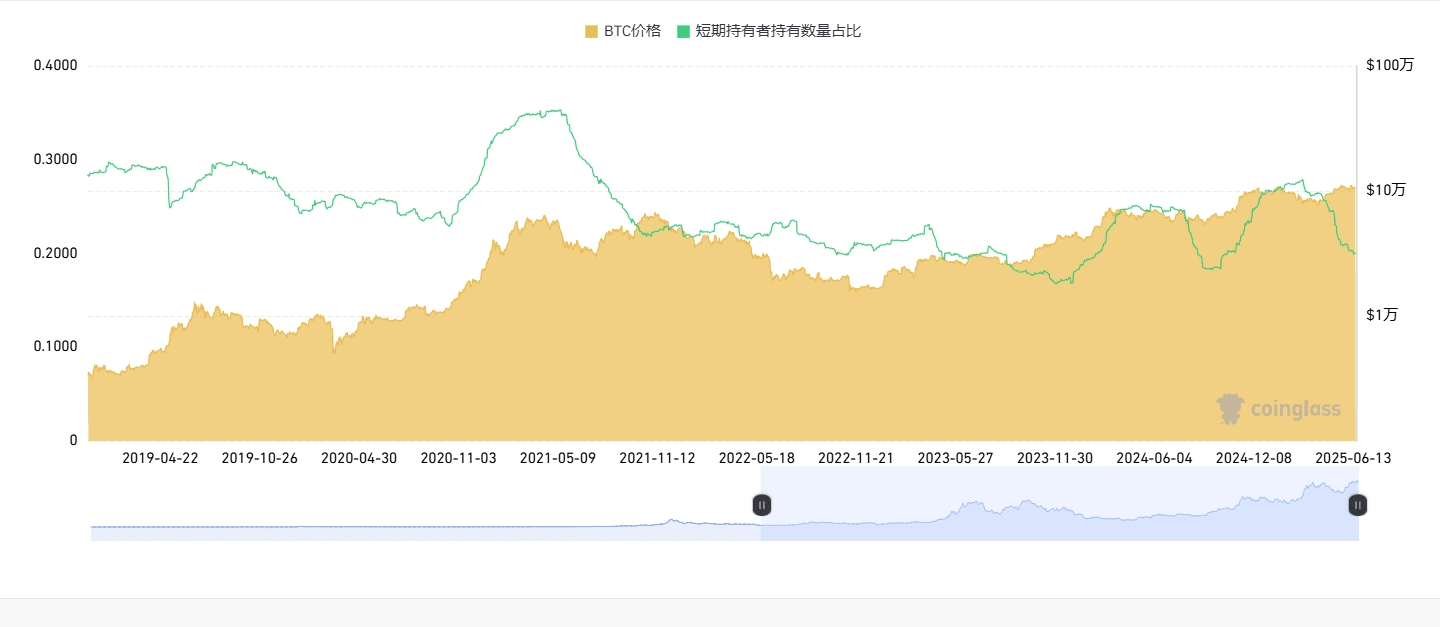
5. On-chain BTC retail, large, and institutional buy and sell data statistics. Large whales sell (largest in the last two weeks)
Thanks to @TradingPunk for organizing and sharing the data.
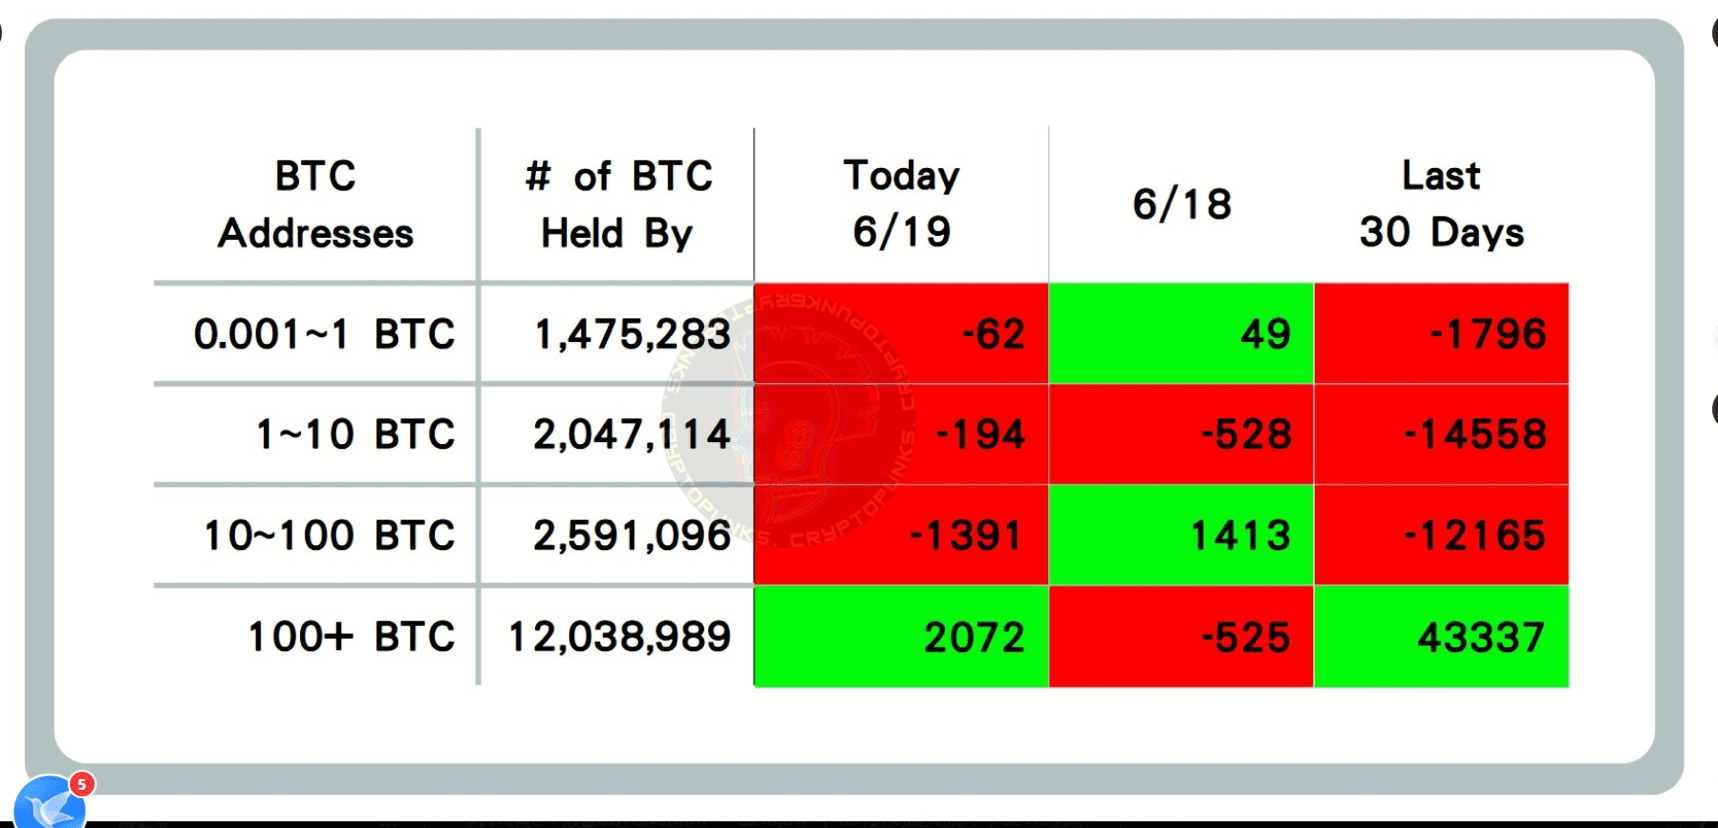
Data explanation: Represents the changes in on-chain flow for ≤ 1 BTC, 1-10 BTC, 10-100 BTC, and 100+ BTC, which can reflect a kind of market sentiment among retail, large holders, and institutions.
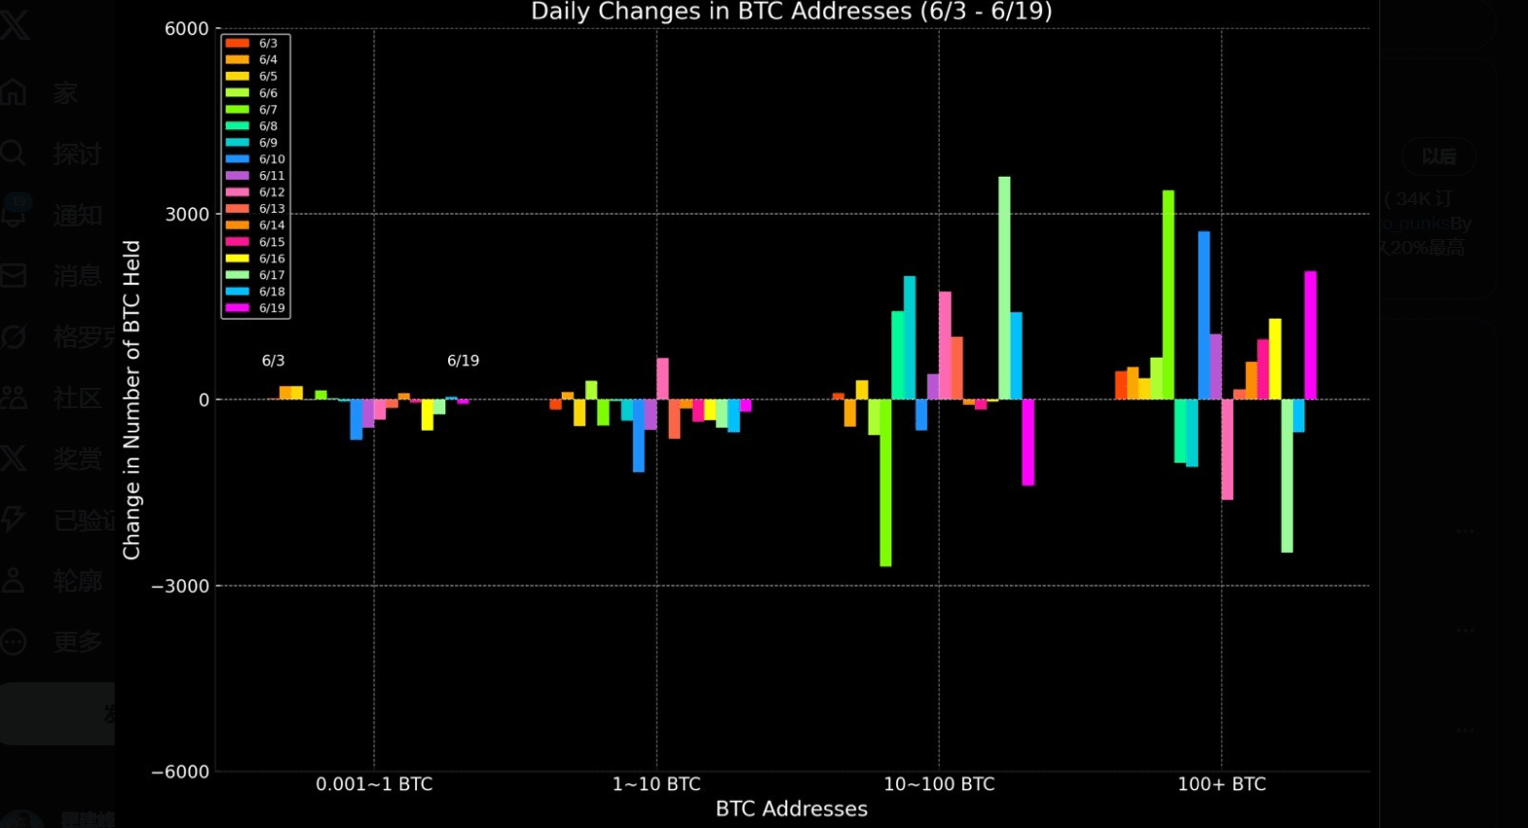
Data explanation: This data reflects the changes in on-chain flow within a week for ≤ 1 BTC, 1-10 BTC, 10-100 BTC, and 100+ BTC, which can intuitively reflect the flow trends of BTC among the market's retail, large holders, and institutions.
When an extreme situation occurs in on-chain data, a reversal often follows (for example, if large whales with over 100 BTC appear to be buying in large quantities while others are selling, the probability of Bitcoin rising significantly increases, and vice versa). It is also necessary to analyze in conjunction with other on-chain data and technical indicators.
6. MVRV realized market cap ratio MVRV > 1.
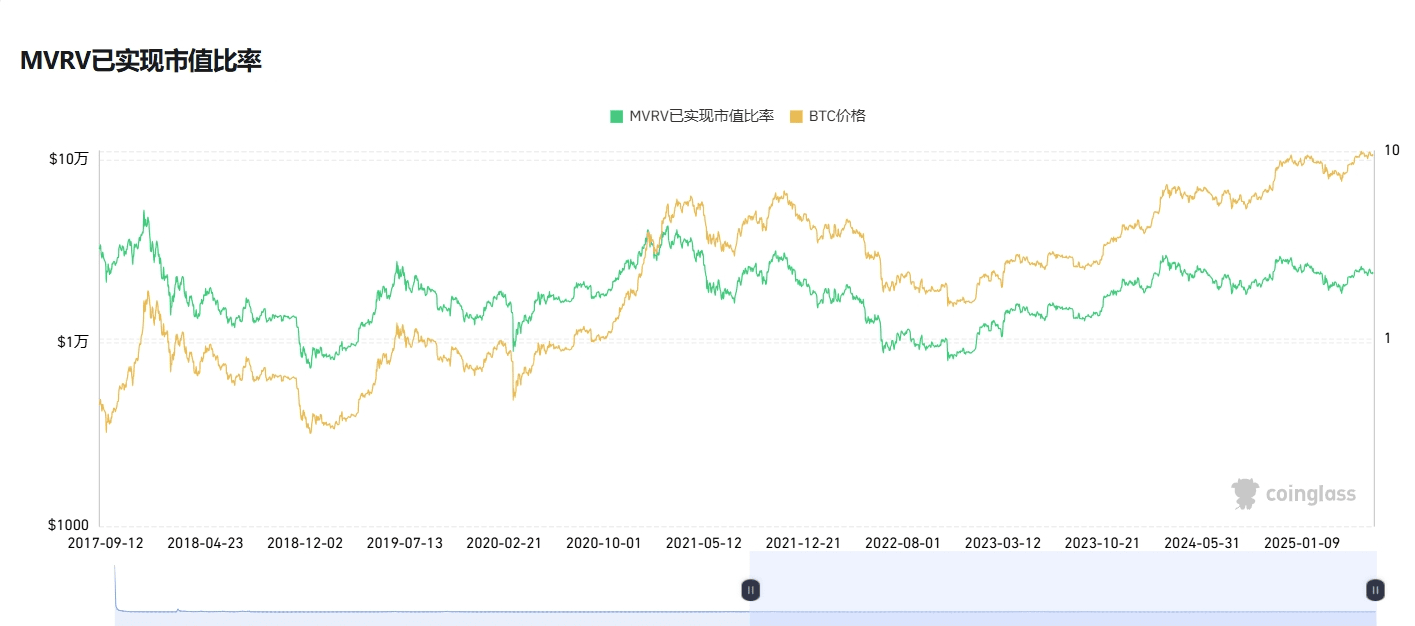
**MVRV realized market cap ratio indicator explanation: The MVRV realized market cap ratio is a metric used to evaluate the cryptocurrency market (especially Bitcoin), which can help assess whether an asset is overvalued or undervalued and identify potential market tops and bottoms.
MVRV > 1
When the ratio is greater than 1, it indicates that market prices exceed realized prices, meaning most holders are in profit. This may indicate an overheated market, especially when MVRV reaches historical highs, which could signal a market top.
MVRV < 1
When the ratio is less than 1, it indicates that market prices are below realized prices, meaning most holders are in a loss state. This may indicate that the market is undervalued, especially when MVRV reaches historical lows, which could signal a market bottom.
7. Altcoin Season Index 22 Whether it is in altcoin season: No, still in a sluggish state.
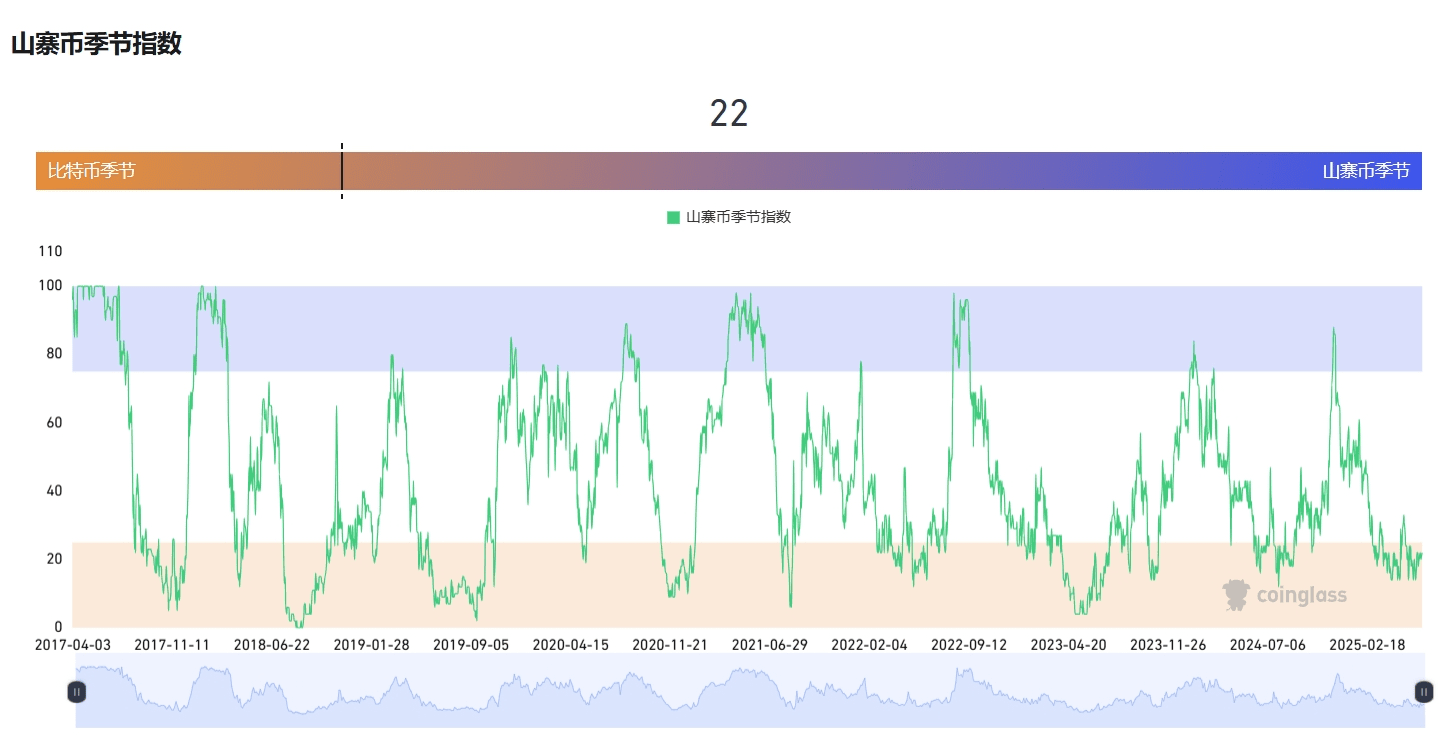
**Altcoin Season Index Explanation: The Altcoin Season Index is a metric used to measure the performance of non-Bitcoin cryptocurrencies in the market. It is typically used to determine whether altcoins are outperforming Bitcoin over a specific time period, helping investors understand market trends and investment opportunities.
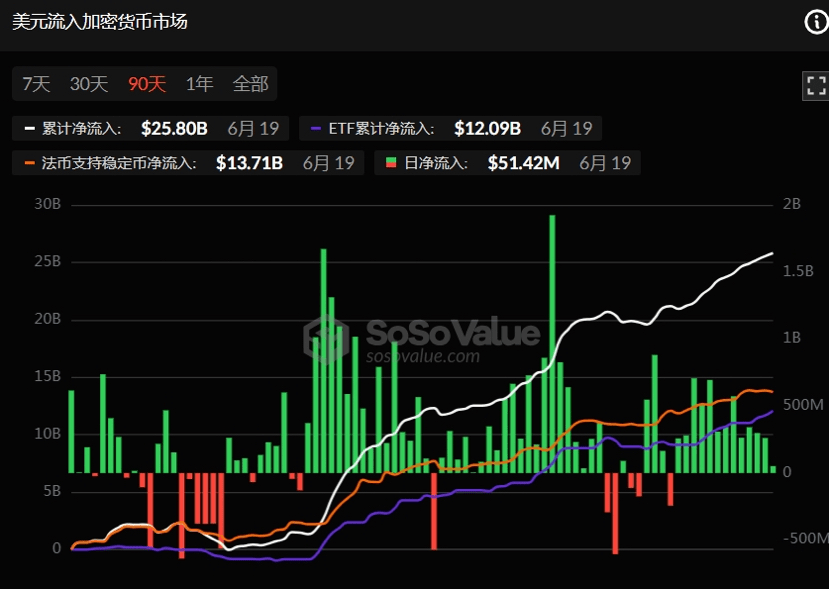
8. Dollar inflow into the cryptocurrency market slows after continuous inflows.
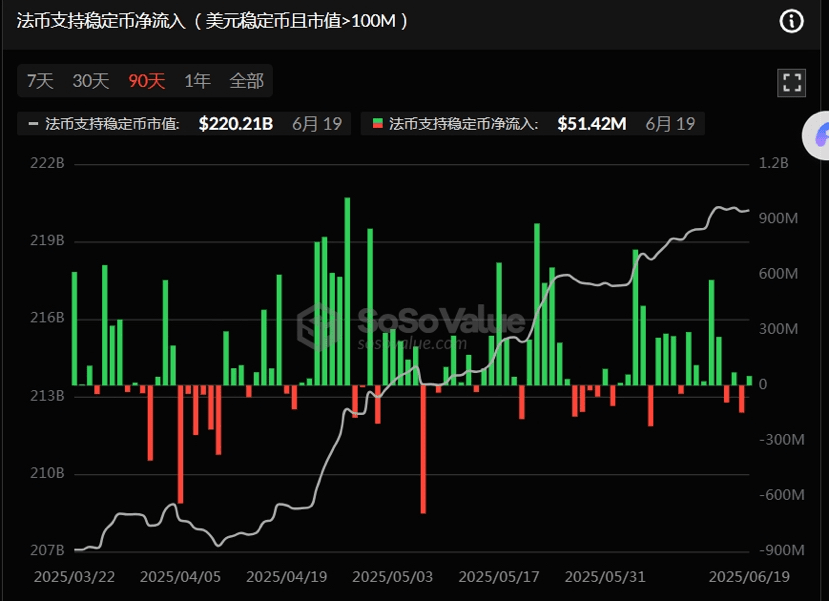
9. Fiat-backed stablecoin net inflow (USD stablecoins and market cap >100M) small inflow.
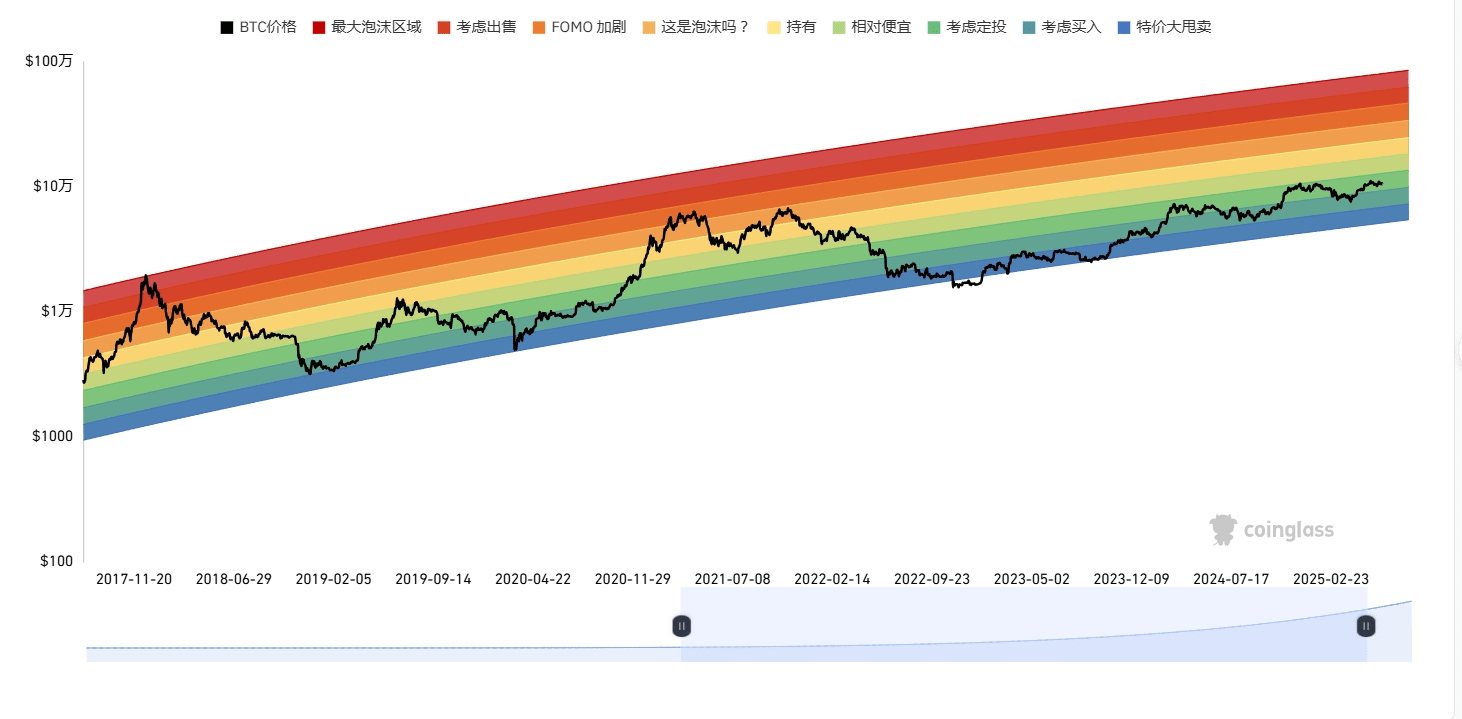
10. The rainbow chart shows that BTC has no signs of topping.
The above data only represents the perspective of on-chain data to predict BTC volatility trends and market sentiment, and does not represent any investment advice. Please make careful decisions!!

I am Mingzhu, follow me for daily sharing of real-time on-chain data and dynamics to help friends predict decisions. Exciting content not to be missed, welcome to leave comments for discussion.
