When investing in the cryptocurrency world, you should prepare first, enter the market steadily, and avoid being reckless.
The market has been trading sideways at a new low, and it is the right time to invest heavily.
Sell decisively when the price goes up, and buy boldly when the price goes down. Be cautious when trading during the sideways period.
Long-term sideways trading, with sideways movement replacing decline, hold on to the chips in your hands tightly, and wait for the moment to rise.
Be cautious of rapid increases and be ready to lock in profits at any time, as a crash may be imminent.
Don't panic if the market is slowly declining, and gradually add to your positions to spread the cost.
When the price is consolidating at highs and lows, wait patiently; when the price is sideways at a high level and then rises higher, sell decisively without hesitation; when the price is sideways at a low level and hits a new low, it is a good time to enter with all your position.
Don’t sell when the price goes up; don’t buy when the price goes down; during the sideways period, it is better to wait and see.
Buy at the negative line and sell at the positive line, go against the trend and show your heroic qualities.
Buy boldly when there is a big drop in the morning, sell decisively when there is a big rise in the morning, don't chase highs when there is a big rise in the afternoon, buy the next day when there is a big drop in the afternoon, don't sell at a loss when there is a big drop in the morning, and take a break if there is no rise or fall.
The purpose of covering a position is to protect the principal, while expecting huge profits is greed.
The calm market has become turbulent, and we need to be cautious about the subsequent trend. There will be a correction after the sharp rise, and the K-line triangle holds a mystery.
For an upward trend, look at the support; for a downward trend, look at the resistance. It is not advisable to operate with a full position, and you will run into problems if you act alone.
The market is unpredictable, so you should know when to advance and retreat. You should enter and exit in an orderly manner and look for opportunities. Cryptocurrency trading is actually about cultivating your mindset, and greed and fear should be abandoned.
Be cautious when chasing ups and downs, and wealth will come naturally if you stay calm. There are two keys to success in the cryptocurrency circle: have coins in your hands and hold them firmly.

The biggest difficulty in trading is not the fear of losing money!
So how do you overcome your fear of losing money?
The great philosopher Bertrand Russell once said: The fastest way to overcome your fear is to do what you fear. Are you afraid of losing money? Then practice deliberately losing money.
Step 1: Prepare 100U
Step 2: Lose all the 100U within one week. But this does not mean you can do it blindly, you cannot open it blindly, you cannot blindly increase the leverage, you cannot blow up your position, you must strictly set stop loss, and you must strictly execute according to the opportunities in your trading system.
Aren’t you afraid of losing money? Don’t you trust your trading system?
Come on! The best way to eliminate fear is to face it, so lose as much as you can! This 100U is for you to lose. If 100U is not enough, you can get another 100U. When you feel numb to losses, you will succeed. At that time, you will understand what I often say, "Losing money is the norm, and missing out is also the norm. Only when you accept this, making money is possible for you."
Only by losing again and again, and playing games with yourself again and again, can you be reborn and overcome the fear of loss. Then from now on, whether it is holding a position or entering the market, you will not hesitate.
I’ll tell you a secret: if you really do as I said above, it is highly likely that you will not lose all your money, and you may even double your capital.
So at that time, you will involuntarily want to increase your capital investment, but when you use 1000U or 10000U to go all in
You will find that your old habit comes back again: What should you do if you are still afraid of losing money?
Question 1: What should I do if I’m still afraid of losing money?
Sizing your positions appropriately
Question 2: What is the right size?
A position that allows you to sleep well
Question 3: When can I increase my position?
When you can still sleep well after enlarging
But please note! The deliberate practice method I just taught you requires you to have your own trading system. If you don’t even have a trading system, then you have no right to be afraid of losing money!
I have used 90% of the indicators on the market, but I only love this set of cryptocurrency indicators. It is worth deep learning and collection (suitable for everyone)
The Bull Flag pattern is probably one of the first chart patterns you come across when learning chart analysis, it is a simple pattern that works great. However, many educational resources often focus on how to identify a Bull Flag rather than how to actually trade it.
In this guide, you will learn the following:
(1) An accurate method to spot the Bull Flag pattern to avoid confusion in your trading.
(2) How to identify a bull flag setup that has a higher probability of success (rather than randomness).
(3) Three bull flag trading strategies that are effective in both bull and bear markets.
KIRK Bull Flag on the Daily Time Frame

Nonetheless, the bull flag is made up of two parts, with the pole being the most prominent part, as shown in the image below.
RELIANCE bull flagpole on the daily time frame

Next is the logo, which is where confusion can arise, as shown in the image below.
RELIANCE bull flag on the daily time frame

So, let's explore this phenomenon, if you observe a pole, the price suddenly drops sharply as shown in the figure below.
NVDA’s sharp move on the daily time frame

This phenomenon clearly reveals that the market movement does not conform to the characteristics of a bull flag pattern. On the contrary, this is a sign that the breakout we observed is actually a misleading false breakout, as shown in the figure below.
NVDA false breakout on the daily time frame

So what exactly are we looking for? We are looking for a series of candlestick patterns that show indecision, as shown in the figure below.
NVDA indecisive candle on the daily time frame
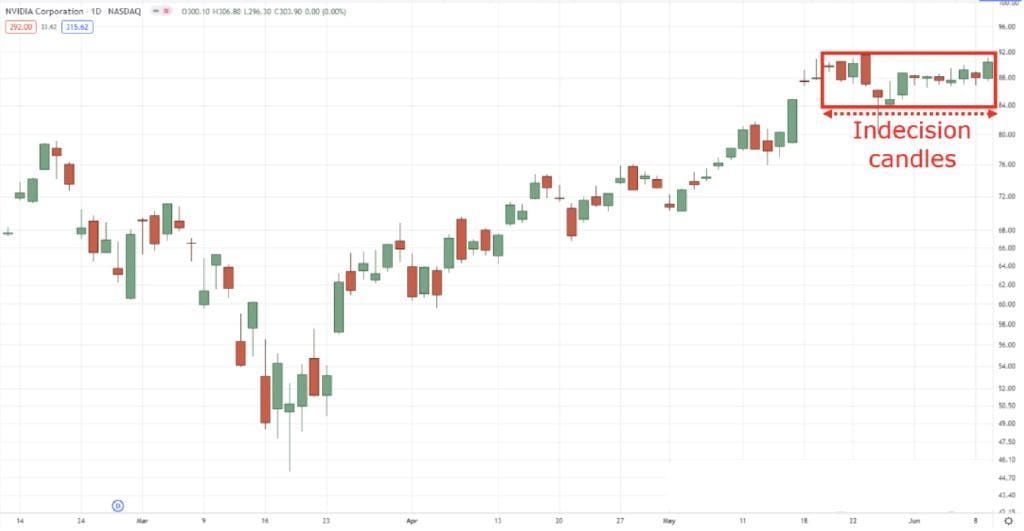
You may ask, why should you care about this indecisive market behavior? This is because if a series of candlesticks showing uncertainty appear after a period of strong market movement (i.e., a market pole), it indicates that sellers are trying to push prices down, while buyers are still maintaining control of the market. Therefore, if you observe a rapid decline in prices after a market pole is formed, you need to observe for a period of time to confirm that sellers have not yet taken control of the market.
That’s why we have other chart patterns like the ascending triangle, which can be used when the price needs more time to form a clear trend, as shown in the chart below.
Potential ascending triangle on the INFY daily time frame

I don't expect us to always focus on the same perspective, as the Bull Flag pattern is a highly subjective trading concept, which means that the two of us may observe different patterns from the same chart, but this does not necessarily mean that our interpretation is wrong. Even so, if our analysis is consistent more than 50% of the time, then I can assume that you are following the right analytical path.
I have shown you examples of successful and failed Bull Flags because the reality is that not all patterns are 100% accurate and our goal is to learn how to accurately identify them. So let's put our previous discussion aside for now and dive into the details of how to accurately identify the optimal Bull Flag setup.
3. How to find the best bull flag pattern on the chart
Imagine that I show you two white shoes, but what if I tell you that shoe A is made by Nike and shoe B is made by an unknown knockoff brand? In this case, you might be inclined to choose the shoes made by Nike because you know that Nike brand shoes are proven to be durable and can withstand long-term use.
The same is true when looking for bull flag patterns. Just because you have identified a possible flag pattern, it does not mean that it necessarily constitutes a high reward-to-risk trade setup. As you can understand, bull flags can sometimes form within an established downtrend, as shown in the chart below.
QQQ Bull flag pattern on the daily time frame downtrend

Alternatively, the pattern may form at a more obscure location within a price range, as shown in the chart below.
ROKU Bull Flag on the 4-hour timeframe

At this point, you may be wondering: So, please guide me on how to identify those bull flag setups that can bring huge returns. Of course, I can't guarantee that you will get huge profits, but identifying high-quality bull flag setups usually involves the following three elements: bull flag + uptrend, bull flag + below resistance, bull flag + trend reversal, and the key is to combine the chart pattern with price action. Next, let me show you my intentions and explain the diversity and application of this chart pattern.
(1) Bull Flag + Uptrend
The most common interpretation of the Bull Flag pattern is that it is used to identify the right time to enter an established trend.
KIRK bull flag in uptrend on the daily timeframe

That's why you may hear some traders say: I missed that breakout, it seems I have to wait for the market to pull back. Does this situation sound familiar? However, the key is that you need to be clear about the type of trend you are trying to capture and develop specific trading rules for it. Specifically, when identifying short-term trends, you can consider using the 20-period moving average as a reference; for the judgment of medium-term trends, the 50-period moving average may be a suitable indicator; and when analyzing long-term trends, the 200-period moving average is often used as an important reference standard. You can choose to trade any of the above trends, but in order to maintain the consistency of your trading strategy, it is recommended that you first focus on trading one trend and master its skills by completing 30 to 50 related trades.
(2) Bull Flag + Below Resistance
Range-bound markets are undoubtedly one of the most challenging types of trading environments, as they can go through periods of contraction and expansion, often with plenty of misleading breakouts.
Alibaba’s complex range on the daily time frame

However, it would be ideal if there was a way to accurately predict when a range-bound market will turn into an uptrend. In a range-bound market, one should wait for the price to form a bull flag pattern below the resistance level, as shown in the chart below.
AMZN below resistance on the daily time frame

The pattern suggests that sellers are having trouble pushing prices down beyond the resistance area, while buyers are showing a willingness to sustain the breakout. So, what should we make of the downtrend? How can you identify the potential for a trend reversal signaled by a bull flag? Let’s explore the answer to this question next.
(3) Bull Flag + Trend Reversal
As you may remember, I introduced you to the concept of three trends earlier. With this technique, you will be able to effectively identify trend reversals, whether they are short-term, medium-term or long-term downtrends. Indeed, we are focusing on the downtrend because we plan to use the Bull Flag pattern to identify trend reversals, as we discussed earlier. At this point, the first step you need to take is to identify a downtrend and wait for the price to break through the resistance level of this trendline, as shown in the figure below.
ETSY structural breakdown on the daily timeframe

Second, wait for the price to form a bull flag pattern, as shown in the chart below.
ETSY bull flag pattern on the daily time frame

Likewise, once a Bull Flag pattern forms, it not only indicates that the downtrend structure has been broken, but it also suggests that a "trend reversal" process is underway, which in turn indicates to us that an uptrend may be about to form. Now, I know that I may have given you the impression that these signals are the "holy grail" of trading, guaranteed profits, however, like any pair of shoes, they can still malfunction or have issues, and no trade is 100% guaranteed, which is why we need to manage risk.
Now that you understand where a Bull Flag pattern may appear, how do you manage your trades when you place them? Should you set a fixed profit target? Should you use a trailing stop? In the following pages, I will share with you some practical trading strategies that will provide answers to these questions.
4. Bull Flag Pattern Trading Strategy That Works in Bull and Bear Markets
Before we dive into the specific strategies, let me introduce you to the basic rules of entry triggering, which will be the common principles followed in the three strategies we are about to discuss. The rules are as follows:
Wait patiently for the price to reach the "highest close" level from the market extreme point (i.e. above the highest wick of the candlestick chart), as shown in the chart below.
JNJ highest closing price on the daily time frame

Subsequently, the entry is performed at the opening of the next candlestick, as shown in the figure below.
Bullish flag pattern entry trigger on the JNJ daily time frame

For the trading strategies I am about to show you, the entry trigger rules remain consistent because the entry plays a relatively small role in the overall trading equation, which suggests that the art of trade management is what determines the success of your trades, not the specific method of entry. Therefore, you should not be overly focused on how to enter the Bull Flag pattern precisely. With that in mind, let's get started.
(1) Strategy 1: Bullish Flag Trend Continuation Strategy
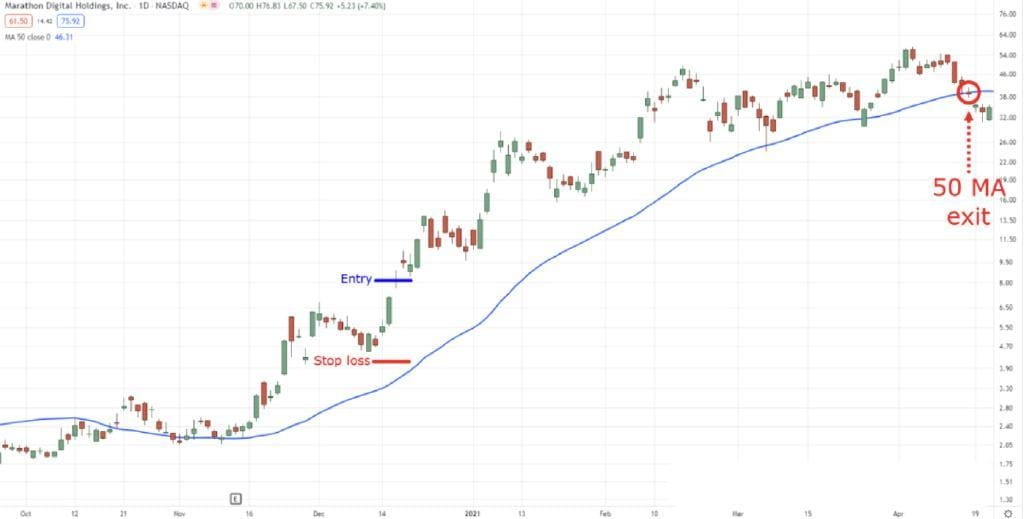
Assuming your goal is to capture the medium-term trend, you will use the 50-period moving average as a reference. Currently, you expect the price to be above the 50-period moving average, as shown in the figure below.
Price is above the 50-period moving average on the MARA daily time frame

You should then wait patiently for a suitable bull flag pattern to form and set your stop loss below the lowest point of the flag pattern, as shown in the figure below.
Entering a bull flag pattern on the MARA daily time frame
 Of course, any trading strategy without an exit rule is incomplete. In this case, you should consider using the 50-period moving average as a basis for your trailing stop, which means that you will hold your trade until the price closes below the moving average, as shown in the figure below.
50 MA Trailing Stop Exit MARA Daily Time Frame
I understand that this strategy looks very basic, but that is as it should be, as the more random variables you introduce into your trading strategy, the harder it becomes to discern what is working and what is not (and what needs further improvement or optimization). Nonetheless, if you are a trend following trader, this strategy will be a great fit for you.
(2) Strategy 2: Bull Flag Range Breakout Strategy
Your technical analysis skills will be put to the test when using this strategy, and by this point you should be proficient at drawing support and resistance levels. Remember, the strategy currently being discussed is a range breakout strategy, which means you need to identify a range-bound market and accurately mark its support and resistance levels, as shown in the chart below.
FCEL support and resistance levels on the daily time frame
 After you have successfully mapped out a trading range, the next step is to watch to see if the price hits the support area and forms a valid bull flag pattern at or below that area, as shown in the chart below.
FCEL bull flag setup on the daily time frame

At this stage, we cannot yet predict what type of trend will form if the market continues to develop, and I recommend setting your profit target below the next resistance area identified on the chart, as shown in the figure below.
Bull Flag pattern with fixed take profit on FCEL daily timeframe

Likewise, you should already be fairly proficient at drawing support and resistance levels, so if you're interested in improving your skills at marking these key levels on your charts, here's a guide.
(3) Strategy 3: Bull Flag Trend Reversal Strategy
Keep it objective, but this strategy is probably my personal favorite of the three I've covered because of its simplicity. Since this is a trend reversal strategy, you're looking for a downtrending market environment, so the harder the market gets hit, the better (and that's the most attractive part of this strategy), as you can see in the chart below.
U Downtrend on the daily time frame

Once the market price breaks above the upper trendline resistance, you would then expect the price to form a bull flag pattern at this location, as shown in the chart below.
Bullish flag on the U-Daily time frame

Bull Flag Entry and Stop Loss on U-Daily Time Frame

Let me reiterate that if a bull flag pattern does not form, then the trade should not be taken because the absence of the pattern indicates that the price level is not effectively supported and therefore the possible breakout is a false alarm. Finally, I recommend a strict trailing stop strategy, such as using the 20-period moving average as a reference, because the current trend may never advance further or the market may be forming a new trading range, as shown in the chart below.
20 MA exits on U daily timeframe

Therefore, you should close your position as soon as your trailing stop is hit instead of setting a fixed profit target.
You may be thinking: Does this strategy work in the Indian market? Does it work for Forex? Does it work for cryptocurrencies? The answer to all of these questions is yes. But it is important to note that in order for this strategy to truly be effective in expanding your trading portfolio, you must implement strict risk management measures, establish clear market selection criteria, and consistently execute trades according to your trading plan.
5. Conclusion
The following is an overview of the key points of this guide:
(1) The Bull Flag pattern consists of a significant up move (i.e., market extreme point) followed by a series of hesitant candlesticks that form the flag.
(2) Before trading the Bull Flag pattern, it is crucial to first identify the overall trend of the market price.
(3) The Bull Flag pattern can be used to capture trend continuation, trend reversal, and breakouts in range-bound markets.