
Daily K Trend Analysis: Bitcoin broke down on Friday and closed with a doji, experiencing slight consolidation over the weekend, with the volatility range controlled within about 1%. After a straight surge at the market open on Monday, there was no retracement pattern, and market sentiment quickly shifted. Given the ineffective candlestick from last weekend and the explosive surge on Monday, it is suggested to operate at key points today, especially reducing positions at reversal points to avoid similar risks. If the U.S. stock market opens with a sell-off tonight, MACD will show continuous weakening, and the support level of 101,400 will become key.#比特币走势分析
ETH Ethereum is not suitable for chasing longs, as the moving averages are entangled with no bullish arrangement. A short could be attempted near 2,700 on a rebound.#以太坊走势观察
Previous Review: Last Monday's similar market behavior provided important reference: After the drop on Friday, a direct explosive rise occurred on Monday, leading to stop-loss at around 107,500 for short positions. This week, lessons need to be learned to adopt a position reduction strategy at key reversal points to avoid repeating past mistakes.
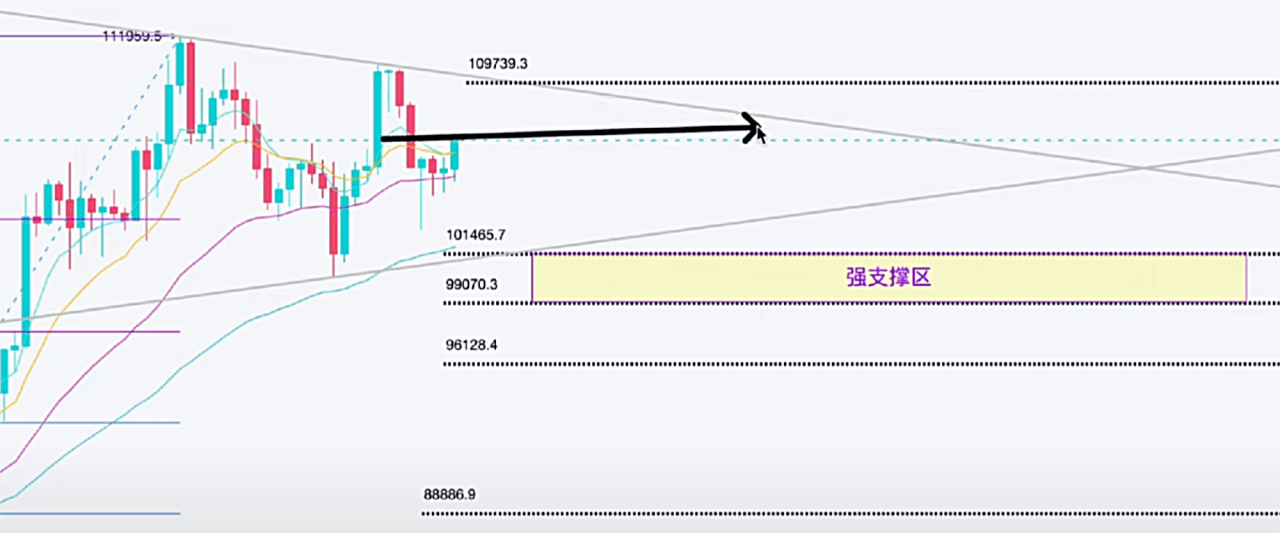
Resistance Level 1: 109400 (4-hour downtrend line + bearish bat pattern)
Resistance Level 2: 107500 (0.618 retracement + bearish Gartley pattern)
Support Level 1: 101450 (uptrend line + 0.88 support + ABC correction wave 100% position)
Support Level 2 spot level: 98900-97300 (1.13 false breakdown position + flat type correction wave breakout bottom; large-scale bullish Gartley + small-scale bullish Gartley overlap)$BTC
$BTC
For more detailed point analysis, please watch today's market analysis video, which contains detailed explanations! Follow Aleng to study candlesticks, and let’s meet at the peak together! Pay attention to avoid getting lost, and get the latest point interpretations daily!