Cryptocurrency market dynamics and data analysis
1. Overview of core data
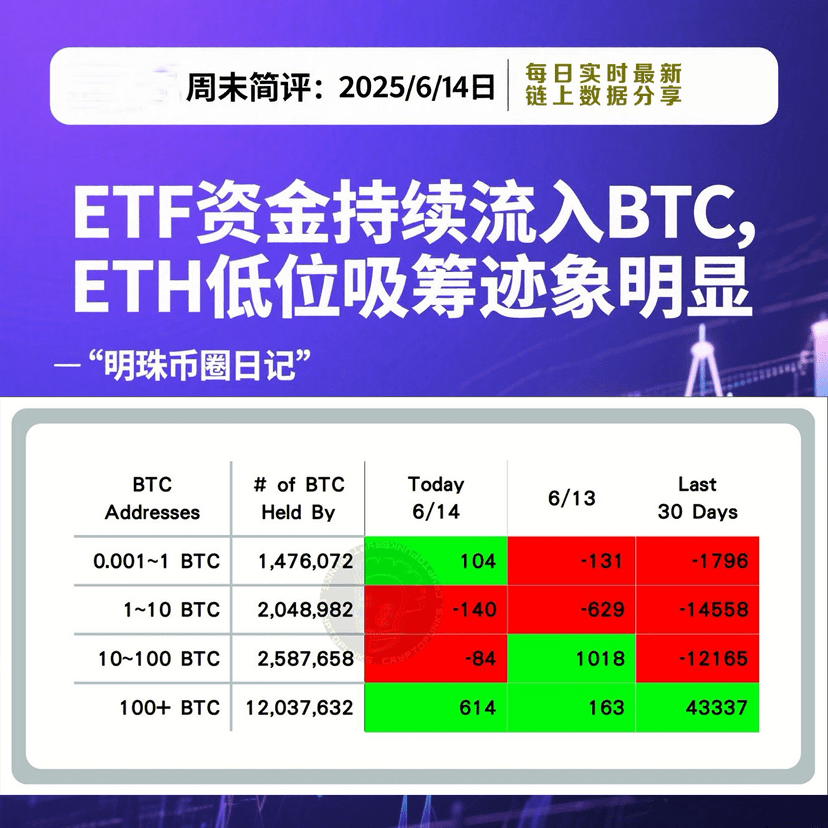
Bitcoin ($BTC) on-chain data (6/14): 100+ BTC whale movements: small net buy (overall on-chain movement is small).
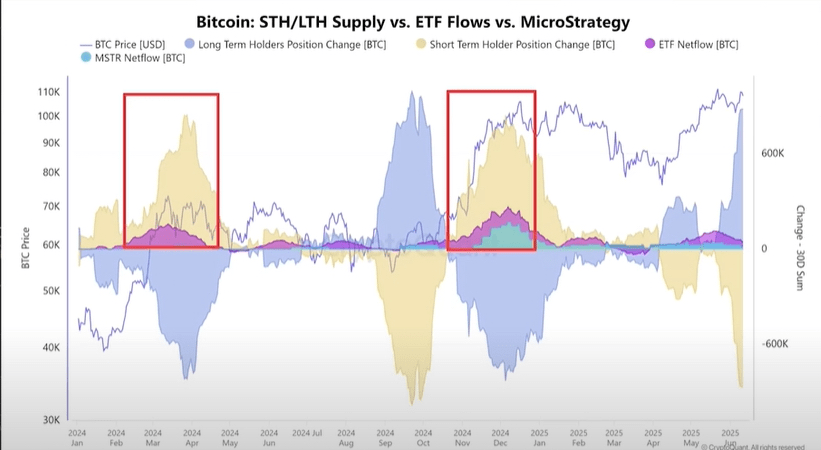
Spot ETF Flows (6/13):$BTC ETFs: Net inflows of +$301.7 million (significant inflows).
$ETH ETF: Net outflow -$21 million.
Spot ETF fund flows (6/13):
$BTC ETFs: Net inflows +$86.3 million.
$ETH ETF: Net inflows of +$112.3 million.
US ETH spot ETF weekly data (as of the week of 6/07-6/14):
Cumulative net inflow: US$528.2 million.
2. Market Characteristics and Interpretation
ETH shows low-level accumulation signal:
The on-chain behavior of whales indicates a willingness to buy during price declines.
In the short term, we need to pay attention to the breakthrough of the key pressure level of $2,700 and the subsequent ETF fund flows.
Money Flow and Price Correlation:
A significant increase in the amount of USDT transferred to exchanges has been observed recently (particularly during the Asian session) (from a long period below $1 billion/day to around $1.5 billion/day).
This is related to expectations for Sino-US trade negotiations and Asian investors' buying behavior, which contributed to the price increase during the Asian trading session.

Market volatility amplification and investor behavior:
The sharp price fluctuations lead to an increase in turnover rate.
Some investors who recently bought at the bottom chose to leave the market due to losses.
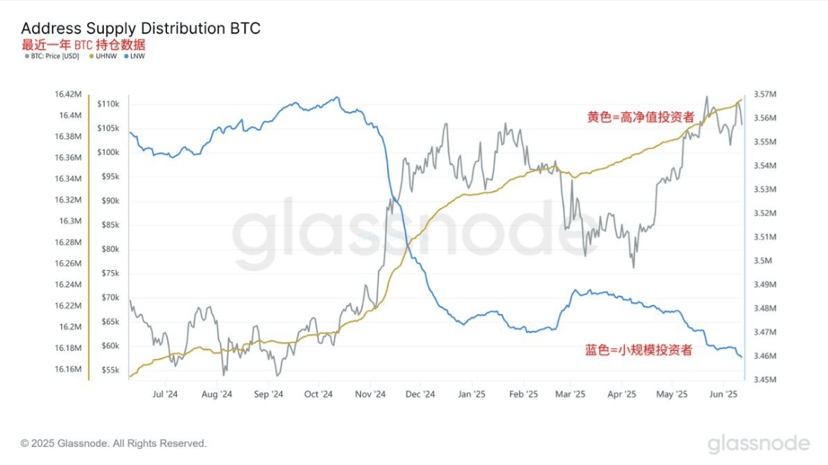
Long-term holders (HODLers) remain indifferent to short-term fluctuations, and on-chain data continues to confirm the stability of their holdings.
Exchange dynamics and signals:
Coinbase ($BTC Stock): Large withdrawals of BTC from Coinbase were observed during the price drop. This is often interpreted as a potential signal of bullishness from US institutional/large investors (reducing sellable supply).
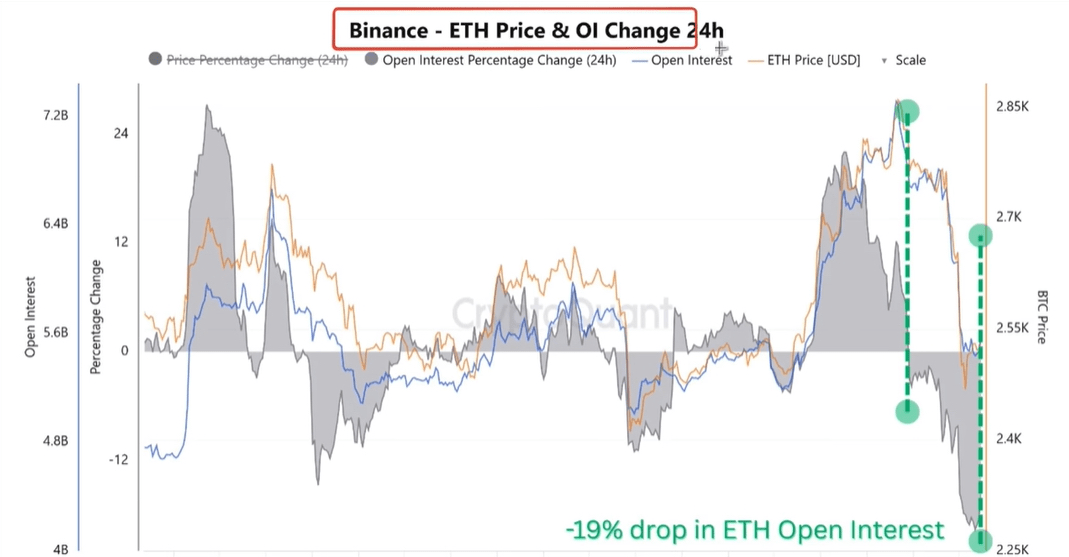
Changes in ETH holdings: Despite a price drop of about 15%, overall ETH holdings fell by 19%, indicating that this round of decline is more like deleveraging during the rise rather than a pure large-scale sell-off.
Potential risk events:
Eastern Time June 14 (Trump’s birthday/weekend): Be wary of the impact of possible unexpected events (“unexpected events”) on market sentiment.

3. Focus of the derivatives market
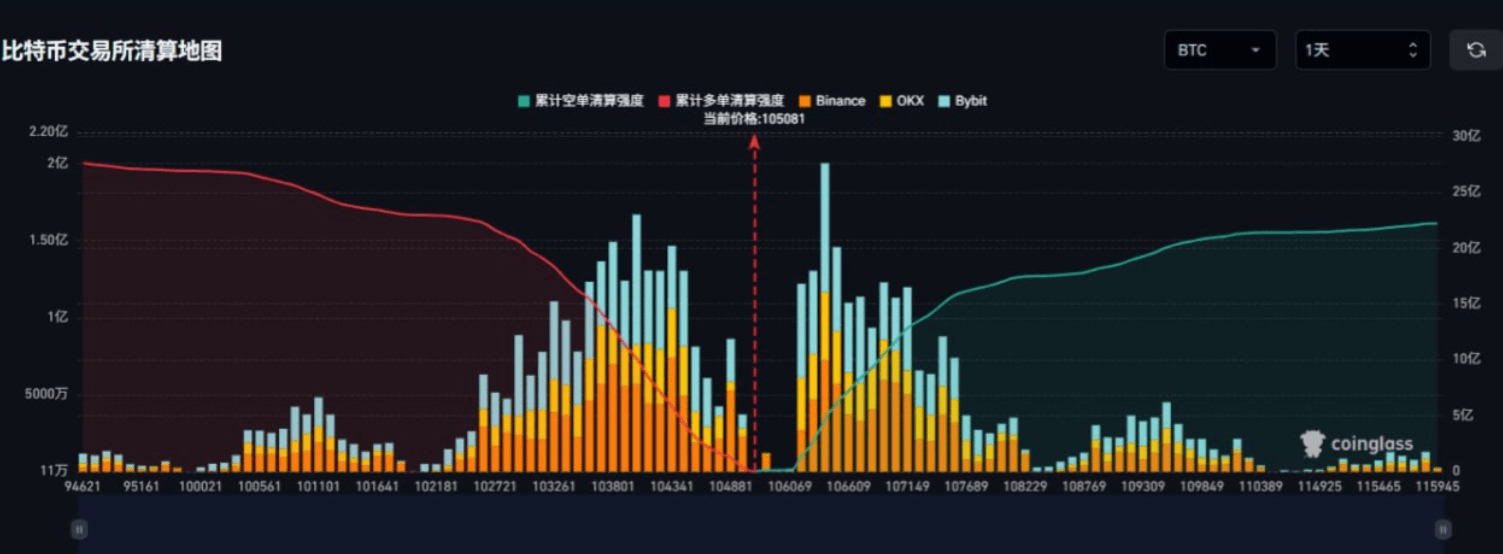
Mainstream CEX liquidation heat map: It shows that there are currently two relatively concentrated liquidation areas:
Around $104,000: Accumulated long order liquidation pressure of about US$1 billion.
Around $106,400: Accumulated short order liquidation pressure of approximately US$467 million.
(Note: These price levels are trigger points for potential increased volatility)
4. Historical rules and market sentiment reference
Binance Net Open Interest Pattern: Similarities are observed in the recent declines caused by the Israel-Iran conflict and the Trump-Musk conflict. The historical pattern has reversed, and the market has the expectation that "it may also reverse this time."
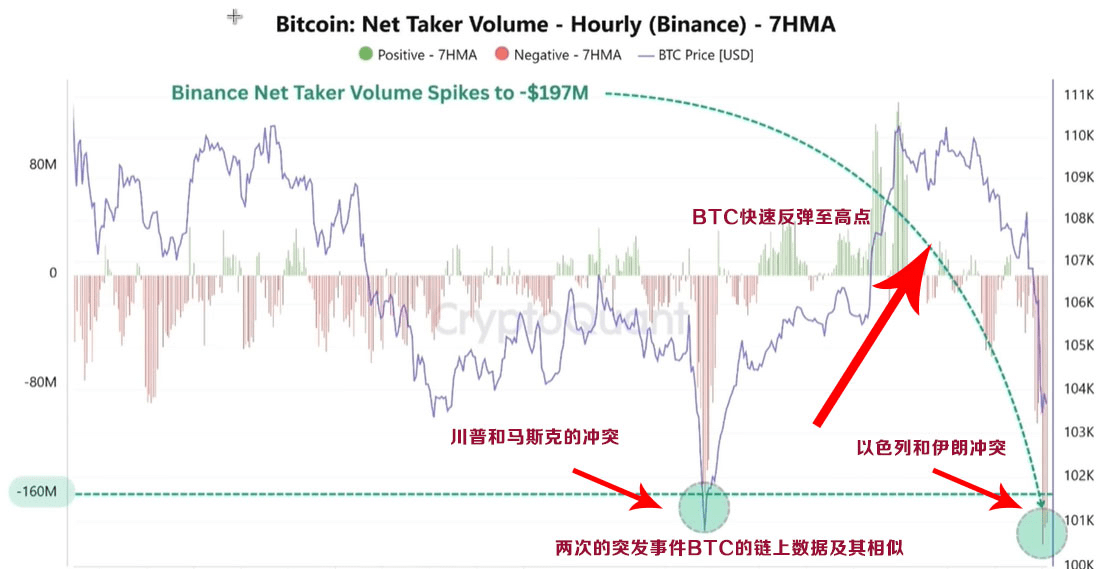
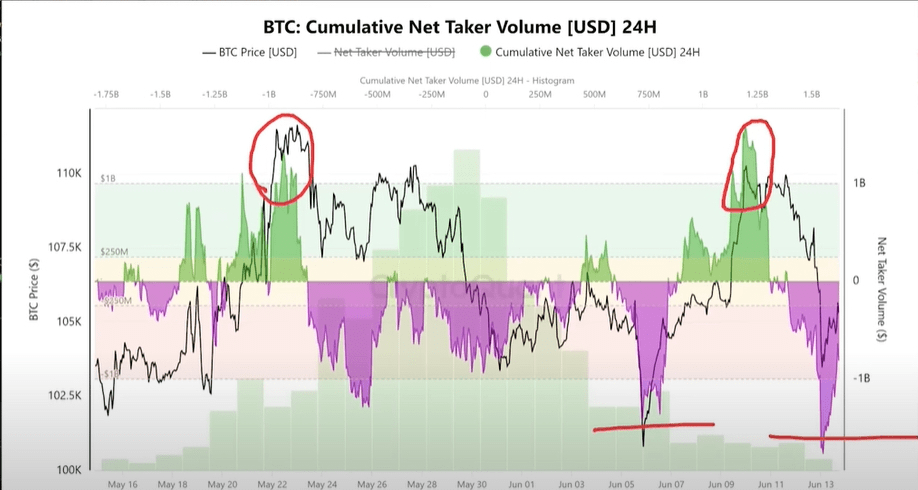
Changes in BTC active net taker volume
Key points:
BTC ETF continues to attract strong funds (especially on June 14), and is the current core supporting force.
ETH shows signs of being accumulated by whales. The ETF has positive weekly inflows but daily outflows. We need to pay attention to the breakthrough of key levels.
Market volatility increased significantly, leading to increased turnover and stop-loss for some short-term investors, but long-term holders remained stable.
Increased capital inflows into exchanges, particularly in Asia, drove local gains.
Coinbase withdrawals are seen as a potential bullish signal.
The decline in ETH is accompanied by a larger decline in holdings, pointing to deleveraging.
Pay close attention to key liquidation levels ($104K, $106.4K) and geopolitical/event risks (such as Trump’s birthday weekend).
Market participants look to historical conflict patterns and look forward to a potential rebound.
1. Greed and Fear Index Today: 52 Neutral Increased from yesterday

** Greed Panic/ Greed Index Interpretation
The behavior of the cryptocurrency market is very emotional. When the market is rising, people tend to be greedy and have a fear of missing out, and when the market is falling, they react irrationally by selling their cryptocurrencies.
With the help of the fear and greed index, we can help our friends get rid of the influence of their own emotional factors and make irrational judgments as much as possible.
There are two states:
Extreme fear indicates that investors are overly worried and could be a buying opportunity.
Being too greedy suggests that investors are too excited and the market may be due for a correction.
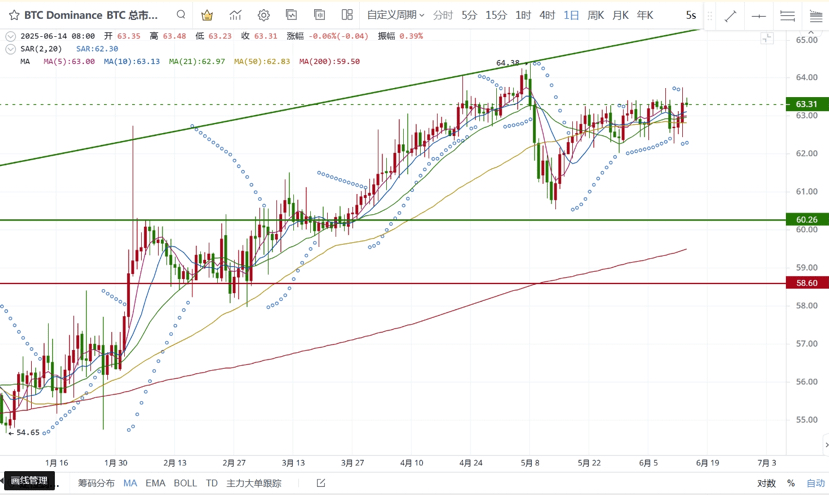
2. Bitcoin’s total market share: 63.30, the same as yesterday
**Bitcoin's total market share is a core indicator to measure Bitcoin's relative influence in the entire cryptocurrency market. This indicator not only reflects Bitcoin's short-term market position, but also reveals changes in capital rotation, investor sentiment and macro trends.
Bitcoin market share is a barometer for judging the market stage:
Early stage of bull market: market share increases, and funds are allocated to Bitcoin first.
Mid- to late-stage bull market: Market share declines, funds rotate to altcoins, triggering the “altcoin season”
Market thermometer: >60% = risk aversion; <40% = altcoin frenzy.
Fund flow chart: reveals the allocation preferences of institutions and retail investors (Bitcoin → stable, altcoin → high risk and high return)
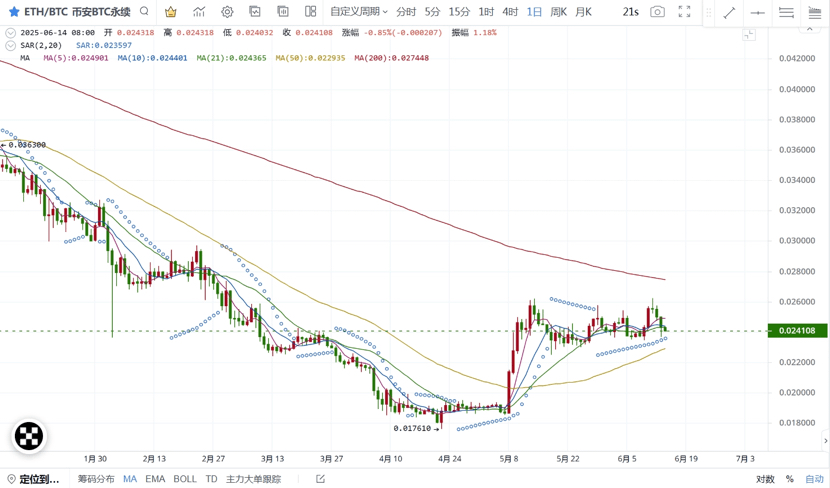
3. Bitcoin and Ethereum trading pair 0.024 Ethereum to Bitcoin trading pair fell back
**The Bitcoin/Ethereum trading pair is the “risk thermometer” of the cryptocurrency market:
Ratio rises → market prefers high-risk assets (signal of the start of the altcoin season);
Ratio decreases → funds flee to Bitcoin (characteristic of a bear market or early bull market).
4. ETF inflow and outflow data: The inflow rate of ETF data slowed down, and the inflow remained small.
**ETF inflow and outflow data description: Bitcoin ETF's inflow and outflow data is a core indicator for tracking institutional sentiment, market trends and fund rotation.
5. On-chain BTC retail, large and institutional buying and selling data statistics. The largest inflow of whales in two weeks
Thanks to @交易扑克大 for providing data collation and sharing

Data description: Represents the increase or decrease of on-chain flow of ≤ 1 BTC, 1-10 BTC, 10-100 BTC, and 100+ BTC respectively. This data can reflect the market sentiment of retail investors, large investors, and institutions.
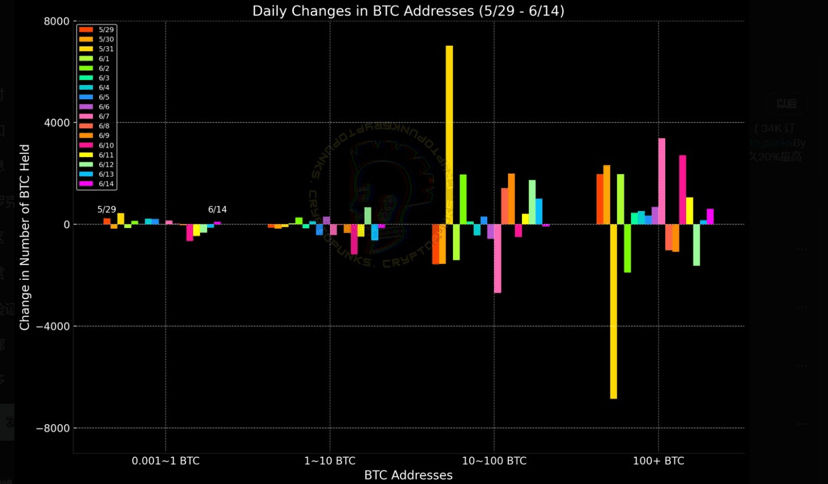
Data description: This data reflects the increase or decrease of on-chain flows of ≤ 1 BTC, 1-10 BTC, 10-100 BTC, and 100+ BTC within a week. This data can intuitively reflect the flow trend of BTC among retail investors, large investors, and institutions in the market.
When an extreme situation occurs in the on-chain data, a reversal often occurs (for example, if a large whale with more than 100 BTC on the chain buys a large amount, while others sell, the probability of Bitcoin rising greatly increases, and vice versa). At the same time, it is necessary to combine the analysis with other on-chain data and technical indicators.
6. US dollars flowed into the cryptocurrency market with a net inflow of $13.73B
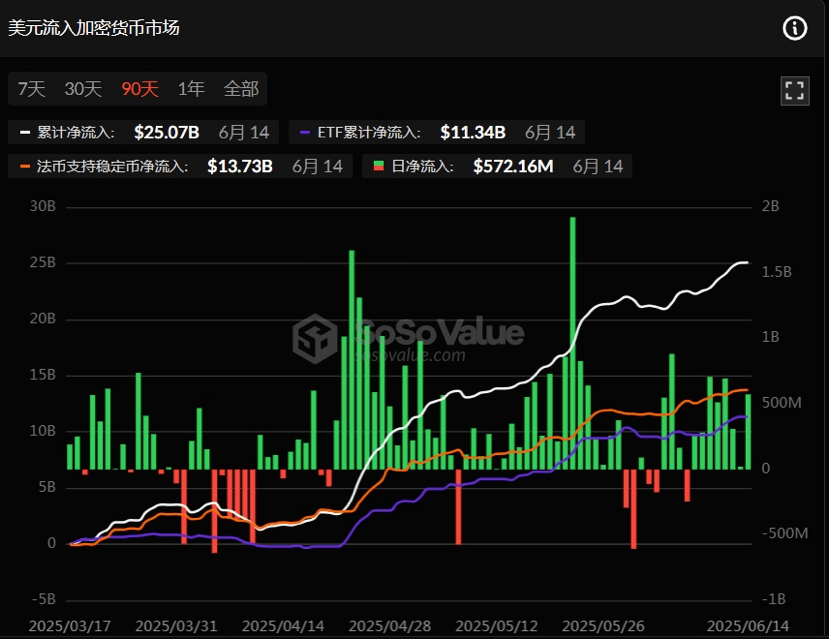
7. Net inflow of fiat-backed stablecoins (USD stablecoins with market value > 100M) Net inflow of $572.16M

The above data only represents the prediction of BTC volatility trend and market sentiment from the perspective of on-chain data, and does not represent any investment advice. Please make your decision carefully! !

I am Mingzhu. Follow me and I will share real-time data and dynamics on the chain every day to help my friends predict and make decisions. Don’t miss the excitement. Welcome to leave a message for discussion.
