I believe that excellent traders must have patience to endure prosperity! The cycle of 'five is poor, six is absolute' recurs every year. According to cycle theory, in a year of trading crypto, only a few months are profitable.
"Five is poor, six is absolute, and seven may not turn around." Every year in May, June, July, and August, I keep my positions empty.
So when is the right time to enter the crypto market?
1. Enter the market at the end of September and clear positions by the end of November.
2. Enter the market before the Spring Festival, clear positions in April.
Third, execute the two iron rules above, of course excluding individual small-cap coins played by main forces.
Next, you need to learn how to find hundredfold coins; combined with a bull market, that is a path to wealth.

Having been in the market for over ten years, one of my accounts has accumulated 30 bitcoins! The return on investment for this account has also reached...
Without further ado, let's get straight to the essentials:
What does naked K trading analyze?
Naked K analysis mainly consists of four major modules: trend, position, momentum, and signals.
These four core analysis segments are not isolated; they support each other, promote each other, and work together.
When responding to the ever-changing market, if we can conduct an in-depth analysis from these four dimensions, it will make our analysis more comprehensive and systematic, avoiding the impulsive behavior of rashly entering the market simply because we captured a trading signal, which is a common pitfall among novice traders.
So, how can we accurately grasp the pulse of trends?
When discussing trend analysis, three major elements must be remembered: structural layout, operational direction, and volatility level.
As for identifying naked candlestick trends, it mainly relies on classic technical theory to define trends.
From a structural perspective, when observing significant highs and lows continually rising, it can be determined as an upward trend; conversely, if highs and lows keep declining, it is deemed a downward trend; fluctuations positioned between highs and lows are categorized as a consolidation pattern.

Figure (2)
The biggest challenge in trend judgment is the categorization of levels and the transition of trends.
The categorization of trends at different levels involves the issue of primary and secondary rhythms. Beginners are often easily swayed by small-level trends, neglecting the primary trend, leading to confusion in trading direction. Is the trend conversion a correction or a reversal? It is not easy to judge because there are no absolutely quantifiable standards.
To resolve the issues of levels and trend transitions, my method is: define your primary trend and critical points.
Because the starting points for selecting trends differ, your perceived trend direction may not be the same as others'. Therefore, you need to define the trends you delineate, identify their primary trends, and then find the critical points of each trend level, which are usually horizontal lines and trend lines.
Is the price position high or low?
Keywords for position: support level, resistance level, risk-reward ratio
Why do you chase highs? Why do you always make small profits and large losses? This is related to the judgment of price positions.
If you always buy at resistance levels and sell at support levels, not only is the failure rate high, but the risk-reward ratio is also very low.
Position judgment is also very important: is the price high or low? The basic personal measurement standards are:
Support levels belong to low price levels.
Resistance levels belong to high price levels.
Because profit-taking settings are also based on support and resistance levels, thus:
Buy at support levels and sell at resistance levels to maximize the risk-reward ratio.
Buy at resistance levels and sell at support levels for the highest risk-reward ratio.
Unless you are trading breakouts, all buy orders at resistance levels are high position entries, and all sell orders at support levels are chasing dips.

This is based on determining price highs and lows using support and resistance levels. If you add the concept of trends, how would you judge high and low positions?
How to judge the conversion of momentum strength?
Keywords for momentum: trend movements, candlestick patterns, slope.
Momentum can be said to be the cornerstone of trend movement; without momentum, there is no existence of trends, so momentum analysis is also a very important module.
What is strong momentum, and what is weak momentum?
Strong momentum: trend movements, consecutive bullish or bearish candles, large bullish or bearish candles, steep slope.
Weak momentum: range movements, doji, small bullish and bearish lines, small slope.

An upward trend must have bullish momentum stronger than bearish momentum.
A downward trend must be characterized by bearish momentum being stronger than bullish momentum.
Range oscillation must represent a state of balance between bears and bulls, with narrow fluctuations indicating a trend of energy accumulation.
From strong to weak, trends represent a form of momentum.
The trend from large bullish candles to small bullish candles indicates a weakening bullish momentum.
A decreasing slope from large to small indicates that momentum is weakening, and vice versa.
The above is based on trends and price candlestick forms to judge the changes in price momentum, thus determining the direction of price movement in the market.
So, if we add a position, what is the special change in kinetic intensity analysis?
Is it reliable to enter the market based solely on signals?
Keywords: trend, position, momentum
When it comes to signals, many of us only think of launch signals like hammer lines, engulfing lines, etc.
When it comes to trading signals, they must be based on the three modules of trend, position, and momentum. If you analyze signals without considering the first three modules, you will find that the success rate is not high. This is why trading signals cannot be divorced from market conditions.
In my personal experience, sometimes I do not always wait for trading signals to enter because I have a good grasp of price trends, positions, and momentum.
Finally, this article discusses the four analysis modules of naked K, each of which covers many knowledge points. This requires a solid foundation, but regardless, the four modules constitute a large analytical framework. If we have not found the direction for analysis and trading, we might as well sort through the market using these four modules.
Additionally, there are several key technical levels worth noting:
1) Psychological support and resistance points - usually integer exchange rates, such as 1.00, 1.10, 1.20, etc. Many traders tend to set orders near these integers.
2) Fibonacci retracement levels - seeking potential levels for price retracement and trends. When used in higher time frames, significant Fibonacci levels (like the 61.8% retracement level) may become key technical levels where there could be a large number of open orders.
3) Pivot points - pivot points are points where market direction turns within a day. By simply calculating the previous day's high, low, and closing price, a series of points can be obtained to form key support and resistance lines. Range traders can use pivot systems to confirm potential reversal points, while breakout traders can use pivot systems to confirm key breakout points.
4) Dynamic support and resistance points - key technical levels are not necessarily fixed and can be dynamic. Moving averages are often used to determine dynamic key technical levels near EMA within 50 days, 100 days EMA, or Fibonacci EMA levels (like 144 days EMA).
5) The integrated area of support/resistance - these areas are the intersection of different important technical levels. For example, an ascending trend line may provide price support at a horizontal support level. This would form an integrated support zone of the ascending trend line and horizontal support.
How to determine which are retracements and which are trend reversals in trading?
Today, let's sort through the six methods for judging the end of a trend. When assessing the end of a trend, first, you must learn to judge the trend. In our previous articles, judging whether a trend has reached its end is not an immediate signal to go long or short; it is to prepare for a long or short position.
Without further ado, let's get to the essentials.
Two necessary conditions to judge that a trend is about to reverse.
1. Insufficient trend strength.
2. Strengthening contrary forces.
These two points must be remembered:
First Category of Indicators
1. MACD divergence.
As shown in the figure.

A downward price movement indicates divergence; everyone knows indicators have lag.
2. Moving averages.

Three moving averages EMA21, 55, 144.
Granville's Eight Methods Rule.
In the chart, there are three moving averages: long, medium, and short. When the short line crosses the fast line, you need to pay attention. You might say it's almost finished, so why bother? No worries, there are still methods.

Three moving averages EMA21, 55, 144.
When three moving averages intertwine, it is essentially the end of the trend.
Note that when using moving averages, they must be of the same period. What is the same period? If you observe intertwining in a 4-hour period, it does not mean it is also intertwined in a 1-hour period. Do what is appropriate for each period.
The above two are methods for indicator judgment.
Second category of price behavior.
3. In price behavior, leg 1 = leg 2.

In price behavior, it is often said that after a trend undergoes complex adjustments, if the upward momentum is strong, it should cover an equal distance.
In the chart, we view the colored line segment as a trend. After a complex adjustment, if the price does not cover an equal distance, it indicates that the upward momentum is waning. In the subsequent chart, we again treat the red line segment as a trend.
Continuing from the above chart.

Then, after a complex adjustment, if the price does not cover an equal distance again.
1. Insufficient trend strength
2. Strengthening contrary forces.
Does it conform to these two statements? It's just a metaphor similar to an old lady climbing a hill, getting more tired with each step.
4. Retracement frequency, retracement depth, upward slope.

By the naked eye, when the price retraces more frequently and the depth of the retracement increases, each upward push is weaker than the last, psychologically leading to an expectation that the price may reverse or enter a trading range. This method requires a certain foundational understanding of price behavior and some experience.
5. Major trend reversal.

Using the EMA20 moving average, when the average line is no longer carrying the price, and the price drops below the 20 moving average creating a gap, if the price does not break the previous high afterwards, we believe the price has mainly reversed.
The above three are some basic judgment methods for price behavior.
Third category.
6.. The Taoist Theory 123 Rule.
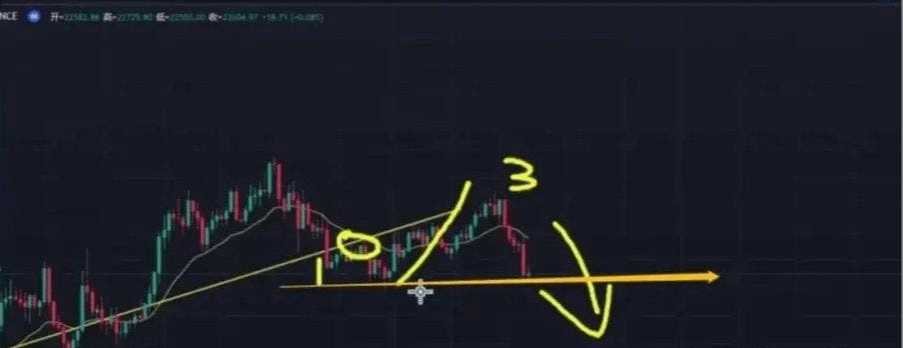
Taoist Theory 123 Rule.
1. First break the line
2. Do not break previous highs.
3. Break through previous lows.
There is an especially important point here: drawing trend lines well. There are countless ways to draw trend lines.
1. Always remember which segment of the trend you are drawing.
2. A valid trend line needs to be verified with 2 points before confirming with 3 points.
It is not just a casual drawing of a trend line; if it were that easy, the market would be filled with billionaires. Be more rigorous.
Summary
Today we categorized six methods to judge the end of a trend. Of course, there are many other methods like fractal theory and wave theory that can also be used for judgment. We only summarized six of them. I believe you only need to master one or two of these methods to be sufficient.
In trading, it ultimately becomes simplified; your charts will become cleaner, just like when we go to battle. It is not that the more weapons we carry, the higher our chance of victory; we might win with just a pistol or two landmines. The important thing is to master one technique to the extreme. Even if you only know one method, as long as you practice extensively, you can also make money and learn to judge. Remember, knowing more does not equate to practicing more.
My investment system is divided into six segments, ranked in order of importance based on my own experience.
First, energy management.
The goal of energy management is to help people focus better, have quicker reaction times, and improve recovery. Whether overall or in parts, correct perception and decision-making abilities are essential. Having abundant energy is like having a strong army, fearless and unstoppable.
1. The importance of physical and mental strength.
2. When your body is not well, you need to rest more.
3. Develop healthy habits
4. Cherish your energy and understand energy allocation.
Second, emotional management.
In the crypto space, a day is equivalent to ten years in the human world. The crypto space acts as an amplifier for wealth (negative), where everyone's fantasies of becoming rich are amplified by hundreds or thousands of times compared to those outside the circle.
The FOMO emotions in the crypto space, fear of missing out, and envy of others making money—all these emotions will ultimately turn into your anxiety. Your anxiety, or rather your emotions, will become the harvesting tool for the whales.
Therefore, in the crypto space, good emotional management is crucial; do not get arrogant in victory or discouraged in defeat.
As for why anxiety arises, my understanding is that it stems from unclear strategic investment goals. We only see others making money in the crypto space, but cannot correctly assess our own conditions, including capital, off-market earning ability, research capabilities, etc. When losing money or seeing others profit, it can create significant psychological impacts, leading to anxiety.
The more anxious a person is, the more distorted their investment actions become.
Moreover, the more anxious a person is, the more they want to take shortcuts and rely on others for the 'wealth code'.
The more one fails to establish their own investment system, the easier it is to become the 'leek' that gets harvested.
So how do we alleviate anxiety? I summarized three steps.
1. You must have a healthy body
Health always comes first! If you have a good body, you will eat well and sleep soundly. This leads to strong mental energy, focus, and you become your own god, minimizing anxiety influences. I have never seen someone with exceptionally good sleep quality suffer from anxiety. My roommate who introduced me to this circle once said he could fall asleep immediately as soon as he closed his eyes, which significantly improved his energy recovery. I have always maintained that good sleep is the foundation of his investment success, even if he himself might overlook this issue. As someone who has long struggled with sleep, I have come to recognize this perspective.
I have been diagnosed with depression and anxiety. I know that poor sleep can really drive someone to the edge of collapse, even leading to suicidal thoughts. Anxiety exacerbates sleep issues, creating a vicious cycle. Therefore, when anxious, one must find ways to improve sleep, which will gradually improve physical health. (Regarding this, I will share how Qian Chuan Bai improved his sleep when I have time.)
2. Establish investment strategic goals and execution strategies.
You must set investment strategic goals, and these goals should align with your situation, then formulate corresponding execution strategies. For instance, consider how much capital you have, what your strengths are, what type of investment operations suit your personality, what your worst-case scenario might be, and how you perceive your execution ability, while also considering the broader market trend context to set realistic strategic goals.
For example, if your capital is 200,000 RMB, you have little time, and your off-market earning ability is decent, your goal in the crypto space is to make a profit of around a million. Then, it's simple: your execution strategy should involve fewer operations, as you don't have much time or energy. You can buy most of your funds in ETH and allocate assets like SOL, and then not worry about it. During a bull market, multiplying your investment several times should not be a problem, allowing you to avoid short-term emotional impacts and focus on other things.
Even with a proper execution strategy, your 200,000 RMB capital can easily make several million in a year. As long as you find five hundredfold potential projects at the beginning of a bull market, buying four thousand each and holding them until the bull market, even if none yield a hundredfold return but only fortyfold, you would still end up with 20,000 * 40 = 8 million. The question is, can you find such projects and ultimately hold on to them?
However, if you say your goal is to take 200,000 RMB and turn it into ten million or even one hundred million in this bull market, then you need to consider whether you have the strength and action to match your goal.
Once strategic goals are clear, executing according to the established strategy helps you remain calm even when market conditions change, thus reducing emotional fluctuations and anxiety.
To combat anxiety, do as the instructor says: you do your thing, I do mine. Regardless of external influences, as long as you can grasp the major market trends and strictly follow a strategy that suits you, you will surely see the dawn of victory!
Third, the management of cognitive systems.
When your energy management and emotional management are in place, you will have a stable and continuous foundation for execution. At this time, you need to consolidate your understanding and establish your own crypto cognitive system.
The crypto space is a battleground; to make money, you essentially have to earn from those whose understanding is not as good as yours. It is very difficult to earn from the whales, so do not even think about it. Therefore, quickly improving your own understanding is very important; it is the core of making money in the crypto space. The crypto market is a game of quick recognition, where you buy low and sell high. If you can buy well, you are a disciple; if you can sell well, you are a master. If your understanding is in place, you can outpace many others, knowing when to buy and sell, giving you the opportunity to make wealth.