First, wait for high and low alignment. When the market is in a sideways consolidation phase, it's best to observe, because after consolidation, the market will change. It’s best to act after a clear trend emerges.
Secondly, do not cling to hot positions; positions should be frequently changed. From start to finish, it’s all about being empty at the end. All short-term popular positions are speculative; once the heat passes, funds will immediately exit, and if you lag behind, you’ll be left alone in the wind.
Third, a rising gap with hopes of a significant rise. If the K-line is slowly moving upwards, showing a high opening bullish candle with increasing volume, it indicates that the market is entering an acceleration phase. At this time, we must remain calm and hold onto our positions, as what awaits you is a significant profit.
Fourth, do not cling to large bullish candles; be decisive in exiting at the end of the trading day. Whether at high or low levels, after a large bullish candle appears, there will always be a pullback, even if it hits the limit; you should exit. We must guard against profit withdrawal.
Fifth, buy on the line of a bearish candle and sell on a bullish line, regardless of whether it's at a high or low. Here, the line refers to moving averages or important support or resistance levels. Short-term traders generally only look at daily moving averages and daily attack lines. I don’t like dragging my feet; short positions usually only hold for three days, at most not exceeding a week, no matter how good it is after that, it has nothing to do with me.
Sixth, do not chase highs, do not sell, do not jump into the water, do not buy, and do not move sideways. This can be said to be a basic principle for survival in the cryptocurrency market. If you want to survive for a long time in the cryptocurrency market, you must remember this sentence well.
Seventh, when buying, prepare in advance. It’s better to enter with a smaller amount than to enter with too much. No matter how confident you are, you should never invest all of your funds at once, because in the cryptocurrency market, the only constant is change. Before you enter, ask yourself four questions.
1. What is the reason for your purchase?
2. What is your operation plan?
3. What will you do after a decline?
4. After being trapped, what is your follow-up plan?
As long as you can anticipate everything and have a response to the facts, you will inevitably achieve stable profits.

Learn the 5-day line trading method, and you won't worry about short-term trading.
The 5-day line is actually the 5-day moving average, which refers to the average transaction price of a coin over 5 days, abbreviated as MA(5). Doesn’t it sound simple? The principle of simplicity often means that simple things are the most practical. The method for setting up the 5-day line is generally similar across trading platforms. Below, let’s take Huobi as an example to explain how to set up the 5-day line.

The default moving averages on the Huobi PC client are the 5-day line, 10-day line, 30-day line, and 60-day line. If you find it too cluttered, you can click the plus sign in the yellow box in the picture above and set it to only display the 5-day line.

5-day line buying and selling method
The rise or fall of coin prices generally follows the trajectory of the 5-day line, which can be divided into three trends: rising, falling, and flat. Below is the reference guidance for buying and selling points on the 5-day line. It’s important to note that the cryptocurrency market is ever-changing and influenced by various factors, including news and policies. The 5-day line works best when combined with Huahua's excellent teaching on K-lines and MACD.
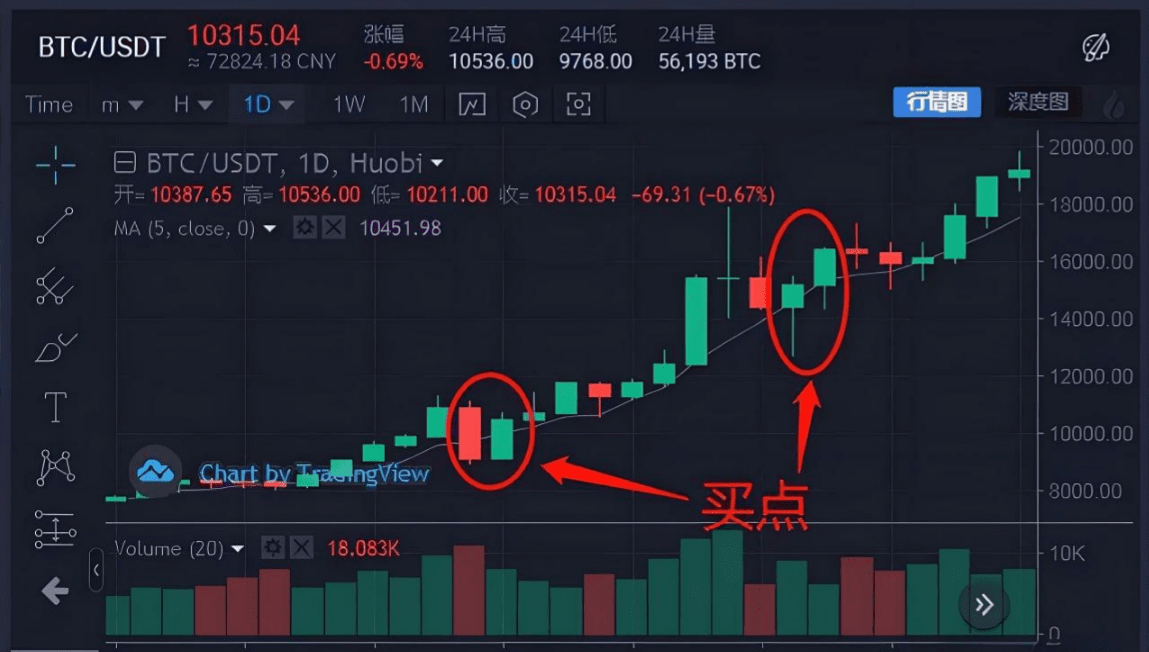
1. The 5-day moving average gradually flattens out and tilts slightly upwards, accompanied by the price of the coin breaking out upwards from below the 5-day line. The K-line shows a bullish candle piercing through the 5-day line and clearly standing above it. At this point, it is considered a buying point.

2. When the coin price is operating above the 5-day line, and after a pullback it drops below the 5-day line but then rises again, showing a bullish candle clearly above the 5-day line, at this point it is considered a buying point.

3. When the coin price is operating above the 5-day line and drops below it during a pullback, but the short-term 5-day line continues to show an upward trend, it is considered a buying point.

4. When the coin price is operating above the 5-day line and has risen significantly for several consecutive days, moving further away from the 5-day line, the same principle applies: extremes will reverse. Recently, investors have made substantial profits, and selling pressure from profit-taking could arise at any time. At this point, it is considered a selling point.

5. When the 5-day line gradually flattens from an upward trend, and the coin price breaks downwards from above the 5-day line, it indicates increasing selling pressure. At this point, it is considered a selling point.

Today’s learning prepares you for tomorrow’s trading. Only by continuously learning classic practical techniques and improving your accuracy in market analysis can you navigate the cryptocurrency market with ease and achieve long-term profitability, allowing you to earn money even in a severe bear market.
Let’s first talk about what the 5-day line is. The 5-day line is actually the 5-day moving average, which refers to the average transaction price of a coin over 5 days, abbreviated as MA(5). Doesn’t it sound simple?
The 5-day line is also known as the 5-day moving average. What is a moving average?
Moving averages are short for moving averages, reflecting the average cost of holding coins by the public over a period of time, and can also reflect the strength of coin prices and their running trends. The moving average indicator is one of the simplest and most practical technical analysis indicators, which is why investors find it relatively easy to grasp.
The principle of simplicity often means that simple things are the most practical and can bring unexpected gains to investors.
The method for setting up the 5-day line is generally similar across all trading platforms. Below, Huahua will explain how to set up the 5-day line on Huobi.

The default moving averages on the Huobi PC client are the 5-day line, 10-day line, 30-day line, and 60-day line. If you find it too cluttered, you can click the × in the second yellow box in the image above to delete the 10-day, 30-day, and 60-day lines, showing only the 5-day line. This way, the market view will appear simpler.

How to use the 5-day line trading method?
The 5-day line actually represents the average position price of players in the cryptocurrency market over five days. It reflects the psychological range of average prices, and serves as a short-term emotional window.
Therefore, every time the coin price hits the moving average, there will be a rebound or a rapid drop, representing a support or resistance level.
In general, it can be thought that during an upward trend (bull market), when the coin price pulls back to the 5-day line, it is an opportunity to increase positions; it is an opportunity to go long.
In a downtrend (bear market), when the coin price rebounds to the 5-day line, it is an opportunity to reduce positions. It is a chance to open a short position.
The principle of simplicity is very practical for investors with little technical foundation.
The rise or fall of coin prices generally follows the trajectory of the 5-day line, which can be divided into three trends: rising, falling, and flat.
Below, Huahua will provide screenshots and use images and text to apply the 5-day line trading method as a reference guide for buying and selling points. It is important to note that the cryptocurrency market is constantly changing and influenced by various factors, including news and policies. The 5-day line trading method works best when combined with the "Double Line Combination Trading Method" taught by Haige.
Partners who have not learned the "Double Line Combination Trading Method" can find Huahua for free access.
Use the 5-day line trading method to determine buying points:
1. The 5-day line gradually flattens out from a downward trend and tilts slightly upwards, accompanied by the price of the coin breaking out upwards from below the 5-day line. The K-line shows a bullish candle piercing through the 5-day line and clearly standing above it. At this point, it is considered a buying point, and futures can be bought long.

2. When the coin price is operating above the 5-day line, and after a pullback it drops below the 5-day line but then rises again, showing a bullish candle clearly above the 5-day line, at this point it is considered a buying point. Futures contracts can be bought at this time.

3. When the coin price is operating above the 5-day line, and during a pullback it drops below the 5-day line, but the short-term 5-day line continues to show an upward trend, it is considered a buying point. Futures contracts can be bought long.
Use the 5-day line trading method to determine selling points.
1. When the coin price is operating above the 5-day line, after several consecutive days of significant gains, and moves further away from the 5-day line, the same principle applies: extremes will reverse. Recently, investors have made substantial profits, and selling pressure from profit-taking could arise at any time. At this point, it is considered a selling point. Futures contracts can be shorted at this time.

2. When the 5-day line gradually flattens from an upward trend, and the coin price breaks downwards from above the 5-day line, hovering around the 5-day moving average, it indicates increasing selling pressure. At this point, it is considered a selling point. Futures contracts can be shorted at this time.

The 5-day line trading method is the most suitable short-term technique for beginners to learn and master. Even those with zero foundation can quickly get started because...
A simple moving average quantification indicator can help overcome our psychological fears and greed.
In the trading process, technology is not the biggest enemy; the biggest enemy is often your own inner greed and panic.
Things to overcome in trading
1 - Forced trading
I used to constantly feel the need to trade, even before I achieved profit and stability.
Day after day, I continuously make trades that don’t align with my plan.
The only way to help me stop is to strictly follow my trading plan as if it were a checklist.
If the market behaves this way... → then I will do this...
This method eliminates my confusion in trading decisions, allowing me to confidently handle charts.
2 - Distraction
Trading requires your full attention. Without focus, you may make costly mistakes, such as entering the wrong position size or mistakenly shorting when you intended to go long (this has happened many times, haha).
To maintain focus, designate a specific time and place for trading to minimize distractions.
Put your phone in another room and set it to silent or "Do Not Disturb." This way, you can avoid distractions and focus on your trades.
3 - Self-doubt
Doubting your trading decisions may lead to missed opportunities. Trust in your strengths and believe that your plan will work. Don't expect your trades to fail just because you are on a losing streak. Keep a journal. Record all your trades, regardless of the outcomes. List your thought processes and review them regularly. This will help you build confidence in yourself and your strategy.
4 - Hesitation
Overthinking your trades after a series of losses can cause you to miss opportunities. This hesitation may paralyze you, making it difficult to leverage your advantages. To address this, before trading, balance your risk by understanding and accepting potential losses. Use strict position sizing and stop-loss orders to manage your risk effectively. If you are a beginner, practice with a demo account to build confidence before transitioning to a small live account or self-trading firm account.
5 - Impatience
Impatience often leads to forced trading. Many novice traders hastily trade before waiting for the market to reach higher time frame PD arrays. This impatience leads to premature entries and exits, resulting in avoidable losses.
My suggestion: use alerts. They help you avoid over-focusing on charts and prevent low-probability trades. Set them at your HTF levels and only open your charts when triggered.
6 - Focus solely on gains and losses
Over-focusing on gains and losses (PNL) can cloud your judgment. As Yoda said: "Train yourself to let go of everything you fear to lose." In trading, regardless of the outcome, following the process is crucial. Remember that your sequence of gains and losses is random. Therefore, set process-oriented goals and celebrate executing your plan, not just for making profits.
7 - Negative self-talk
Belittling yourself will destroy the confidence you have built. This may lead you into a cycle of poor performance. Challenge and replace these thoughts with positive affirmations. Remind yourself: "In the long run, I will win."
Have you learned these basic technical indicators for swing trading in the cryptocurrency market?
Every indicator has its limitations and lagging properties. It is best to combine multiple indicators with various information from the broader environment, especially since the cryptocurrency market involves factors controlled by large players, which can be relatively more complex.
Swing trading indicators can be classified into three categories: oscillators, trend indicators, and volume indicators. Oscillator indicators can show the overbought and oversold conditions of K-line local prices, providing qualitative price layouts. They are more suitable for short-term operations, with representative examples being KDJ and RSI. I recommend that those with no foundational knowledge should first read articles to understand the meaning and usage of each indicator.
Trend indicators can define trends over a period of time and linearize price fluctuations. Typical examples are MACD and MA. Generally speaking: a golden cross or death cross on a 15-minute chart can predict half a day's trend; on a 30-minute chart, it can predict a day's trend; on a 60-minute chart, it can predict a two-day trend. In general, the smaller the selected cycle, the more accurate the buying and selling price levels.
Energy indicators are derived from trading volume data, with VOL being the most common. VOL is composed of volume bars and moving averages. If the closing price on a given day is higher than or equal to the previous day's closing price, the volume bar is red; otherwise, it is green. VOL can provide a clear view of the relationship between volume and price. This is a basic usage.
Golden Cross and Death Cross
(1) Golden Cross
A MACD golden cross occurs when the DIF line (white line) crosses upwards through the DEA line (yellow line), forming a crossover, and the DIF must be above the DEA while moving upwards. At this point, the bulls have the advantage. The MACD golden cross is a good buying signal for the medium to long term. However, if the golden cross occurs while both the DIF and DEA are below the zero axis, it indicates that although the bulls are currently dominant, caution is needed to prevent a pullback.
(2) Death Cross
A MACD death cross occurs when the DEA line (yellow line) crosses downwards through the DIF line (white line), forming a crossover, and the DIF must be below the DEA while moving downwards. At this point, the bears have the advantage. The MACD death cross is a good selling signal for the medium to long term. If a death cross occurs and the zero axis is above, there are two possibilities: it could be a temporary pullback before continuing to rise, or it could be the beginning of a major correction. Top divergence and bottom divergence.
Divergence, literally, refers to deviating from the predetermined or normal track. In the cryptocurrency market, it indicates that when the price of a coin is in an upward or downward trend, technical indicators move downwards or upwards, with the indicators not following the price movement, which is called divergence.
Essentially, this is due to certain reasons causing the price and indicators to show different trends, leading to the phenomenon where indicators cannot synchronize with price movements.
Divergence is divided into two types: top divergence and bottom divergence.
Top divergence refers to a situation where the price of a coin is continuously rising, but the MACD indicator shows a pattern where peaks are getting lower, indicating strengthening bearish forces, and it is a good signal to exit.
Bottom divergence refers to a situation where the price of a coin is continually falling, but the MACD technical indicator's DIF line is declining less than the price of the coin, or even rising, indicating strengthening bullish forces and a good signal to catch the bottom.
PS: The DEA line is more accurate, but it requires a longer cycle and takes more time.
Overbought and oversold
(1) RSI indicator: The strength indicator theory posits that any significant price increase or decrease fluctuates between 0-100. Based on normal distribution, RSI values usually fluctuate between 30-70, with 80 or even 90 being considered overbought. This value may be even higher in the cryptocurrency world, leading to a natural price correction. When the RSI value drops below 30, it is considered oversold, and the price is likely to rebound.
(2) KDJ indicator: A K value below 20 and a D value below 30 indicate an oversold area. Generally, the price of the coin may rise, and the chances of a rebound increase, providing an opportunity to enter. A K value above 80, a D value above 70, and a J value greater than 90 indicate an overbought state. Generally, the price of the coin may fall, and it is advisable to sell at the right time.
Insights on swing trading
In fact, trading swings are not as complicated as they seem. In summary, it's about buying at low points, selling at high points, comprehensive analysis with multiple indicators, paying attention to take-profit and stop-loss, avoiding frequent operations or large positions, and controlling risk.
The difficult part for retail investors is determining the entry and exit points. It’s not particularly difficult to judge these points; there are many news items that everyone knows about, like Litecoin halving. However, many retail investors want to buy at the lowest point and sell at the highest point, fearing getting trapped or cut, and the focus is on greed, always hoping the price will hold for a bit longer.
Therefore, to swing trade, first recognize the overall market trend. Determine whether it is a bull market or a bear market, and whether the overall market is in an upward or downward trend. Next, confirm the risk and reward ratio of the coin you want to buy, and finally, understand whether you are operating on a large swing, medium swing, or small swing. Have a mental benchmark for take-profit timing and price ranges.
The biggest taboo in trading swings is greed. Being greedy can easily lead to missing the best take-profit range. Avoid eating the head and tail of the fish, don't seek to buy at the lowest point, and don't wait to sell at the highest point. By doing so, the downside is that profits are not maximized, and sometimes you might let a big fish slip away, leaving many regrets; the upside is that the risk factor is lower, safety is higher, and the mindset is winning, always keeping the initiative.
Dingang's top ten advantages:
1. Cooperation platform
Supports mainstream global platforms, with funds in your own account, safe and reliable.
2. Trading coins
All listed coins on supported platforms can be easily traded.
3. Market analysis
Multi-dimensional comprehensive big data intelligent analysis of market conditions, 24-hour full-network monitoring
4. Take-profit strategy
Innovative unlimited tracking take-profit strategy, monitoring the highest point of the current stage, selling only when there is a pullback.
5. Supplementary order strategy
Cloud big data real-time analysis of market conditions, real-time intelligent calculation and adjustment of supplementary strategies.
6. Simple operation
One-click to start the robot; just choose a strategy for fully automatic intelligent trading, freeing your hands throughout the process.
7. Intelligent protection
Intelligent prevention of waterfall crashes and downward trends. A 3-second drop triggers an automatic pause for new orders, and a downward trend stops supplementary orders, making it safer in a bear market.
8. Intelligent recommendations
Official multi-dimensional analysis of big data, recommending currently suitable trading coins.
9. Emotional control
Execute strategies strictly, judge signals strictly, and avoid the influence of subjective emotions.
10. Opening conditions
Multiple conditions for building positions can be chosen; positions can be built directly, stopped, or built again during a downtrend pullback, making it more humanized and intelligent.

Eight essential rules to follow in cryptocurrency investment
1. Believe that a bull market is likely to come. If you don't believe it, then don't consider anything and take all your money out; of course, you might say you believe it is likely to come, but since it is a possibility, what if it really doesn't come? If you exhaust your life and the bull market never comes, what then? Let me calculate it for you. If you invest 500 monthly in Bitcoin, you will need to invest around 300,000 RMB in BTC over your lifetime. Based on current prices, that’s about the cost of a car. If you think this 300,000 will significantly change your life, then don’t dollar-cost average; go change your life instead. After all, investment is meant to improve life. If you think the impact is not significant, 300,000 will let you live your life with hope for the future. Having some hope in life is always good.
2. If a bull market comes, which projects are likely to surge? This statement is redundant. In a bull market, any project can surge; the smaller the project, the more it can surge. You might ask how much return counts as high; 5 times is considered high, right? But in the cryptocurrency world, 5 times is nothing. So, in fact, the key isn’t what project it is, but can you really catch a wave of a bull market? Can you? Absolutely not. If you keep your funds outside the market, when you see a slow rise, you’ll think it’s a rebound and won’t realize it’s a bull market. Once the bull market is confirmed, you’ll feel the increase is already so high, and you might think it’s ready to drop. So, you’ll miss a perfect bull market. To summarize, entering the market during a bear market is the most stable way to catch a bull market.
3. What to do if you can’t catch the lows in a bear market? If you know how to catch the lows, do you know that Newton got caught while trying to catch the lows? Never think about catching the lows; in a bear market, it is slow, and no one knows where the bottom is. Those analysts are fools; I should get applause for saying this, right? The cryptocurrency market and the Chinese stock market are places where no analysis is needed, okay? If you can’t catch the lows but need to enter the market, what to do? Dollar-cost average.
4. What to do if the projects for dollar-cost averaging die in a bear market? In the cryptocurrency market, a large number of projects are generated every day, and many die every day; it’s very normal. After all, after cashing out, officials still have to go to clubs with models; who has time to care about you? So, what projects are likely to survive the bear market? Bitcoin is definitely one, and the top ten mainstream coins are basically reliable. Of course, you might say that it’s unnecessary to talk about these high-market-cap coins. Fine, let me mention a reliable project I know, CoinKey. It’s absolutely reliable and definitely won’t die. Oh, by the way, there are platform coins; I personally think the most stable one is HT, which is closely aligned with the government.
5. Should we believe in 100x coins? Before a coin becomes a 100x coin, it doesn’t even know it is a 100x coin. That’s how it is. The success of a 100x coin requires many factors, and many are coincidental, which cannot be analyzed. So-called 100x refers to going from obscurity to becoming a cryptocurrency celebrity, from the lowest price to the highest price range. By the time you can access it, it might have already increased by 10 times, meaning that the 100x coin at your point is at most a 10x coin. You might say, what if I buy it when it is unknown? But when it is unknown, aren’t you afraid it might die? Out of 100 dead coins, there might be 1 100x coin, are you sure you can pick it? In a bear market, choosing such junk coins is either foolish or foolish; don’t be foolish. 100x coins are hard to come by; don’t even think about it.
6. Is the buying price important? We’ve just discussed the dollar-cost averaging strategy in a bear market. Since it’s a bear market, it doesn’t matter where you dollar-cost average, and since it’s dollar-cost averaging and not catching the bottom, what are you afraid of? What I want to say is, if you believe a bull market will come, the buying position really doesn’t matter; what matters is the selling position and strategy.
7. Bull market entry strategies. There are two types of operations in a bull market: One is to hold onto your Bitcoin and the projects you are optimistic about during a bear market, waiting to cash out at a certain point; the other is to swap your Bitcoin for junk coins and then earn back Bitcoin after the junk coins surge. In a bull market, junk coins tend to rise faster than Bitcoin. This strategy is not mine but was said by Wu Jihan. The existence of junk coins is to help us earn more Bitcoin. The first strategy is obviously more stable; as long as you set a moderate target for growth, you can basically cash out successfully. The second strategy carries more risk, as you must wait for the bull market to be confirmed before doing this. When will the bull market come? Even the bull market doesn’t know when it will come. So, this risky move might just waste the Bitcoin you’ve painstakingly dollar-cost averaged. I think Wu Jihan thinks this way primarily because he has a Bitcoin-centric mindset. He only cares about how much Bitcoin he has and not the price of Bitcoin itself. He will cash out but will have a substantial bottom line. Additionally, he knows which junk coin to pump. But us regular folks are mostly helping others earn Bitcoin. Otherwise, do you think that's how others earn their Bitcoin? So, this statement is very insightful but not suitable for ordinary people. Of course, you might ask if you can try this; absolutely, you can. If the bull market comes, and you cash out that much money, contributing to the bull market, what’s wrong with letting others take a little profit?
8. Where is the selling point for the dollar-cost averaging strategy?
First, remember that you will never sell at the highest point; thus, don’t regret it. What you should regret is that the bear market lasted a month, and you didn’t sell a single coin.
Take those project coins I’m optimistic about; now it's less than 2 cents, it rose 20 times, at 5 dimes. My strategy is to sell in batches, take a bit at 5 times, a bit at 10 times, and then when it drops 20% in one day, just clear out.
Again, taking the junk coins I’m preparing to invest in, when Bitcoin rises by 3 times, buy 1000, don’t sell, and when it drops by 20% in one day, clear out directly. It’s just like that. What if it drops by 20% right after buying? Just clear out, no iron-clad execution means you’ll always be a follower.
9. Summary
Yesterday I saw a very truthful statement: are we buying coins just to break even? Buying coins is for taking a gamble. If it's just to break even, then it’s better not to enter this circle. In today's society with stable social classes, we don't have many choices. Sometimes, we can only take a leap of faith within our means.
Of course, you might ask, what if I miss the bull market? There are many things you might miss; it’s all cyclical. No need to rush; whenever you make money, it’s still making money. Don’t go against market trends and risk your own downfall; this way, you can see the next cycle.


