Entering the market from 500,000 to 1,000,000 to 3,020,000. By the third year, it reached 5,900,000. In August of the fourth year, it reached 3,780,000. By November, it was over 7 million. Until the previous few years, it was easy to withdraw 30 million in the cryptocurrency market.
That time was my darkest moment. In just a few months, I experienced a fall from the peak to the bottom. But it made me realize that the previous smooth sailing was not without luck. So, I feel that if I really want to continue on this trading path, I need to study hard, not just understand the basics but also analyze news and study technical indicators.
If you do not conduct in-depth research and reasonably plan how to manage your money, your funds will only be depleted.
In the end, as a retail investor without a solid foundation, you will only happily enter and leave in despair. After cutting off all contact with classmates and friends for three years, staying at home, reviewing day and night, and sometimes sleeping on the keyboard due to exhaustion, I finally achieved financial freedom through cryptocurrency trading.


To achieve stable profits, these ten rules must be kept in mind!
1. Don't let unrealized profits turn into losses. Once you have more than three points of unrealized profit, set a protective stop loss near the opening price, ensuring that you do not lose your capital. In the cryptocurrency market, gaining more than three points is easy, especially with small altcoins. At this time, you can slightly widen your take profit level and consider using a trailing stop loss, especially in a bear market, where it is essential to take profits regularly to protect your gains from being taken away. Normal people cannot withstand the feeling of unrealized profits turning into losses; they begin to think about what to do with the profit, what to buy, and then suddenly, unrealized profits turn into unrealized losses, feeling like they have fallen from heaven to hell. Those whose minds are not strong cannot endure this, and their emotions can be easily influenced, affecting their decision-making and judgment, leading them to make some foolish decisions. By the time they wake up to the reality, they find their account funds have mostly evaporated, regretting it deeply.
2. Don't let small gains turn into big losses! Just like playing baccarat, if I go in today with chips of one or two hundred and win 500, I am satisfied and retreat. The next day I win another 500 and retreat again, feeling delighted. When the third day comes, it doesn’t go as smoothly; I go in and lose 500, feeling unwilling, I continue to gamble, wanting to recover my losses. I bet 500 and lose 1000; the profits from the first two days are gone. Then, feeling unwilling again, I continue to gamble, throwing 500 and 1000 chips randomly, and end up losing tens of thousands. This is a typical case of winning a little and losing a lot. Embrace the trend, go with the flow; the buying price isn't about being lower, but about being more suitable. You won't gain an advantage just because the buying price is cheap, as there is no bottom in a downtrend. Give up on worthless coins; trend is king.
3. In fact, in speculative markets, being able to adapt is the wrong approach. Use a fixed trading system and let the trading system deal with changes. It doesn't matter how many methods you use; what matters is if you use one method a thousand times without change. Staying put is the best defense; often, the times you are most reluctant to let go are when you make the most mistakes. This point, you should ponder seriously!
4. Patience is the foundation of making money. You may need to learn for a long time and be deceived countless times before knowing what the cryptocurrency market is like. It's okay; cherish every experience of being deceived, as these are all lessons on the investment path.
5. When the price of coins enters a stable upward channel, each pullback is a temporary stop, a good opportunity for us to get on board. No coin rises continuously; pullbacks are like a compressed spring, aiming to jump higher. 6. Artificially judged bottoms are usually not bottoms, but rather halfway up the mountain. The true formation of bottoms is observed through emotions and funds, so never blindly catch a bottom; often, 9 out of 10 attempts will lead to losses.
7. When holding a profitable position, close the position when you reach your psychological point, do not try to capture it all. Also, pay attention to position size and leverage control; learn to strictly control your position according to the leverage of the products you trade combined with your own capital.
8. Use moving averages: short-term operations generally refer to the 5-day, 10-day, and 20-day moving averages. When the 5-day moving average crosses above the 10-day and 20-day moving averages, and the 10-day moving average crosses above the 20-day moving average, it is called a golden cross, indicating a buying opportunity. Conversely, it is called a death cross, indicating a selling opportunity.
9. A poor mindset in cryptocurrency trading will lead to losing everything even with millions. Trading in cryptocurrency is a psychological game, a competition of intellect among millions, a fierce psychological battle.
10. Finally, of course, keep learning about cryptocurrency investment knowledge, enrich yourself, and summarize every day. As the saying goes, practice is the only criterion for testing truth. Only through a lot of real trading can you truly consider yourself a beginner in trading.
I will also share a set of my own practical strategies, with an average win rate of 80%, which is quite a rare achievement in the cryptocurrency trading world.
One of the most accurate indicators of MACD.
1. MACD is the most commonly used indicator by advanced traders.
The MACD indicator plays a very special role in technical analysis; it can be said to be an essential part of learning technical analysis. Its importance can be summarized in the following points.
First, the MACD indicator is the most effective technical indicator tested by historical trends and is also the most widely used indicator.
Second, the MACD indicator is derived from the EMA moving average indicator and has very good application effects in grasping trending markets. Trend investors generally need to refer to this indicator in practice.
Third, the top and bottom divergence of the MACD indicator is recognized as the best method for 'buying the dip and selling the peak', and this method is an important tool for the concretization of trend theory and wave theory.
Fourth, many veterans have had such an experience: when they first entered the field, they started learning the MACD indicator and then gradually discarded it. After a long period of study and comparison, especially after practical verification, they finally returned to the MACD indicator. This shows the uniqueness of this indicator.
Fifth, the application of the MACD indicator in quantitative trading is also very widespread.
It is these advantages that make the MACD indicator the most commonly used technical indicator by professional traders.
2. The concept and calculation of the MACD indicator.
The MACD indicator, or the Exponential Moving Average Convergence Divergence indicator, was created by Gerald Appel to track price trends and analyze K-line buy and sell opportunities. This indicator is commonly used in trading software and is known as the 'king of indicators'. As shown in [Figure 1].

The MACD indicator in the cryptocurrency market consists of the DIF fast line, DEA slow line, MACD histogram, and zero axis, this 'three lines and one axis'. Investors analyze prices through the crossing, divergence, breakouts, support, and resistance of these 'three lines and one axis'. The MACD indicator has become the preferred indicator in many trading software, indicating its wide application, which also indirectly shows that this indicator is one of the most effective and practical ones tested by history.
Third, the golden cross and death cross of the MACD.
"Golden Cross" and "Death Cross" patterns are extremely important shapes in technical indicator analysis. The golden cross pattern, also known as the golden crossover, refers to a shorter-term indicator line crossing above a longer-term indicator line (of the same type), signaling a potential short-term buying opportunity. If the golden cross appears after ① a rapid decline during a downtrend; ② after a pullback during an uptrend; ③ after a consolidation during an uptrend, particularly when it appears at a stage low, it becomes a more reliable buying signal.
The death cross pattern, also known as the death crossover, refers to a shorter-term indicator line crossing below and through a longer-term indicator line (of the same type), signaling a potential short-term selling opportunity. If the death cross appears after ① a consolidation during a downtrend; ② after a rebound during an uptrend; ③ after a rapid increase during an uptrend, particularly when it appears at a stage high, it becomes a more reliable selling signal.
Having understood the golden cross and death cross patterns, we can take a closer look at the golden cross and death cross of the MACD indicator line. The appearance of a golden cross and a death cross at different positions reflects different market meanings.
Case 1: Buying point of a low-position golden cross.
If the DIFF line and DEA line golden cross occurs below the zero axis and is far from the zero axis, this golden cross is called a low-position golden cross. Investors can regard this golden cross as just a short-term price rebound. Whether the K-line can form a real reversal still requires observation and confirmation with other indicators.
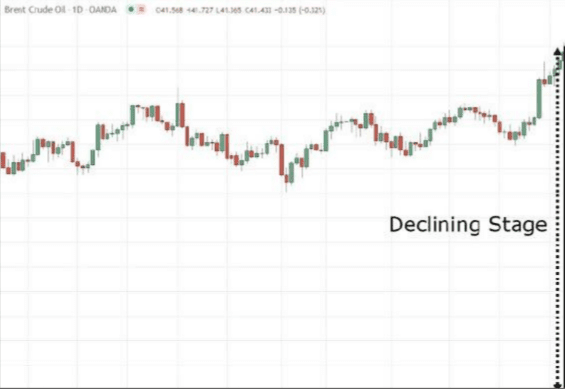
However, the market is not continuously in a downtrend; eventually, it will begin to show signs of strength, which is when we return to the first phase of the market (the accumulation phase).
3. Value Area
You have mastered how market structure provides you with a framework to know what actions to take under different market conditions - whether to buy, sell, or stay on the sidelines. Therefore, the current question is, where do you buy and sell? First, you need to understand what a value area is; the value area refers to the area on the chart where potential buying or selling pressure may occur, which may include: support and resistance levels, moving averages, etc.
(1) Support and Resistance Levels
A support level refers to an area of value where potential buying pressure may intervene and push the price up. A resistance level refers to an area of value where potential selling pressure may arise and cause the price to drop. Here is a specific example.

(2) Moving Average
The moving average is an indicator of the average historical price on a chart. In trending markets, prices may follow the moving average as it reveals potential buying (or selling) pressure, thus forming a value area. Here is an example.
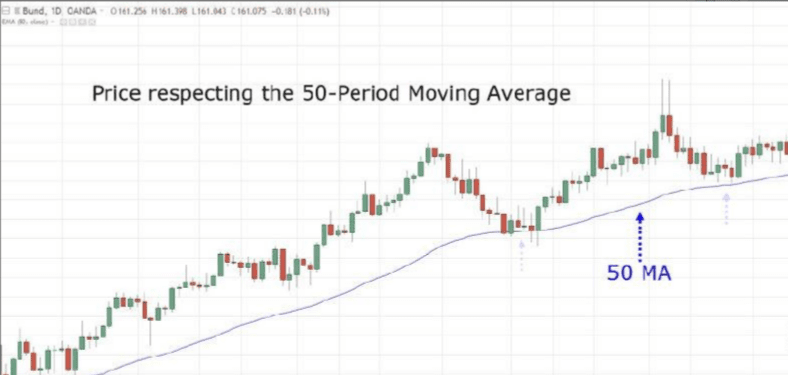
Obviously, looking for buying opportunities when the price falls back to the moving average is not a bad strategy. Remember, the value area is not limited to support and resistance levels or moving averages, as it can also extend to trend lines, trend channels, etc.
4. Entry Triggers
Market structure guides what actions you should take (buy, sell, or stay on the sidelines), while the value area indicates where you should buy and sell. The current question is, when do you enter the trade? This is the purpose of entry triggers, which tell you when to enter the trade. Thus, you can utilize the following two techniques: structural breakouts, false breakouts.
(1) Structural Breakout
Structural breakouts are a reversal price action pattern that allows you to enter the beginning of a new trend with lower risk. Here are the key points you need to look for:
1) Observing an ascending trend close to a resistance level in a higher time frame (you want the resistance area to attract sellers' attention in the higher time frame).
2) The price fails to make a higher high but makes a lower high (which provides us with a reference point to set the stop loss).
3) Short when breaking below the swing low or support level.
(and vice versa), here is an example.

(2) False Breakout
False breakouts are a reversal price action pattern that allows you to buy low and sell high. Here’s how it works: 1) Look for strong bullish momentum entering resistance (the larger the candle, the better).
2) Let the price break through the extreme highs of the resistance level (so that more traders buy the breakout).
3) Wait for a false breakout pattern, where the price suddenly reverses and closes below the resistance level.
4) Short when the next candle opens.
(and vice versa), here is an example.

5. Stop Loss
We have introduced your trade setup, including market structure, value areas, and entry trigger factors. However, the reality is that even the most ideal trade setup can lead to losses, which is why it's important to know when to exit the trade before conditions worsen; this is the purpose of a stop loss, to protect your trading account from significant losses in a single trade.
The question now is: where should the stop loss be set? Your stop loss should be set at a level that, if reached, would invalidate your trade setup (or 'break' it). If you buy at a support level, expecting buying pressure to intervene and push the price up, your stop loss should be set below the support level. If the price breaks below the support level, it means your initial assumption was wrong, and you should exit the trade.
Therefore, the question is whether you will set your stop loss below the support level or give it some buffer space.
My preference is to provide a buffer below the support level of 1 ATR (Average True Range) to prevent 'stop hunting'. Here’s how to operate specifically:
(1) Identify the lowest low point of the support level;
(2) Determine the current ATR value;
(3) Subtract the current ATR value from the lowest support price point - this is your stop loss point.
As shown in the figure below.

Now, you can apply this concept not only to support and resistance levels but also to any form of value area.
This is an example of a moving average. If you buy near the moving average and expect buying pressure to intervene, your stop loss should be set below the moving average. Because if the price falls below the moving average, it means the moving average is no longer 'respected', and your trade setup will be invalidated, as shown in the figure below.

As shown in the figure above:
On August 19, 2019, at 09:30, the 5-minute K-line chart of BTC shows Bitcoin breaking above the 30-day moving average, indicating that an upward trend has begun to form. For a period afterward, the price has been running almost consistently above the 30-day moving average.
On August 19, 2019, at 14:00, the MACD indicator formed a golden cross near the zero axis, indicating that the market is about to experience a significant upward trend. Investors can confidently buy.
Case 3: Buying point of a high-position golden cross.
If the golden cross of the DIFF line and DEA line occurs above the zero axis and is in a region far from the zero axis, this golden cross is called a high-position golden cross. High-position golden crosses generally appear during a consolidation in the K-line's upward process, indicating that the consolidation has ended and the K-line is about to resume its previous upward trend. Therefore, once a high-position golden cross appears, it is a good signal to increase positions and buy.
In practical terms, once an upward trend is established, and the K-line rises slowly and sustains this for a long time, once the MACD indicator forms a high-position golden cross, it often indicates that the K-line is about to accelerate upward.
Because of this, a high-position golden cross can also be used for swing trading. Investors can use the MACD indicator to continuously target upward swings in an uptrend.

6. Market Structure in Higher Time Frames
We have introduced your trade setup, including your entry and stop loss strategies. Next, let us explore the market structure in higher time frames, as it helps you determine whether to hold your profitable trade longer or to only capture short-term fluctuations in the market.
(1) Counter-trend trading.
Suppose you are shorting in a 4-hour time frame and your trade is profitable; however, in the daily time frame, the market shows an upward trend. In this case, what action should you take?
1) Option 1: Stick with your short trade, hoping the market continues to favor you.
2) Option 2: Exit your short trade at the recent swing low because the market may reverse against you.
There is no absolute right or wrong in these two choices. However, for me, I tend to exit trades at the recent swing low because the market may reverse and continue its upward trend (in the daily time frame). Now, let's reverse this scenario.
(2) Trade in the direction of the trend in higher time frames.
Suppose you are holding a long position in a 4-hour time frame, and the market is rapidly moving in your favor, while in the daily time frame, the market is also showing an upward trend. In this case, how would you respond?
1) Option 1: Hold your long position, hoping the market continues to favor you.
2) Option 2: Exit your long position at the recent swing high because the market may reverse against you.
In this case, I tend to continue holding my long position because the higher time frames are also favorable to me. When I mention 'continuing to hold', I am not suggesting you hold your position indefinitely; rather, it is to track my stop loss to ensure that if the market continues to move in my favor, I can go along with the market trend.
7. Maintain low volatility in higher time frames.
Markets move in cycles of volatility, experiencing transitions from low volatility periods to high volatility periods; this process is cyclical. Therefore, when the market is in a low volatility state, it often indicates that a significant change in the market is about to occur. Investors should be prepared accordingly. To illustrate with a specific example, suppose you are holding a long position in a 4-hour time frame and the market is rapidly moving in your favor. Meanwhile, you observe that the daily time frame is forming an accumulation pattern, which is a form of low volatility price action that appears like a 'squeeze'. In this case, what action should you take?
1) Option 1: Hold your trade, hoping for increased volatility to further push the market in your favor.
2) Option 2: Exit your trade at the recent swing high because the market may reverse unfavorably.
8. Conclusion
Here is an overview of the key points of this guide:
(1) The market structure provides a framework guiding what action you should take - whether to buy, sell, or stay on the sidelines.
(2) The value area helps determine where to buy and sell (e.g., support and resistance levels, moving averages, etc.).
(3) Entry triggers inform you when you should buy and sell using specific price patterns (such as price rejection, candlestick patterns, etc.).
(4) Your stop loss should be set at a level that, if reached, would invalidate your trade setup (or when your value area is 'broken').
(5) Trends in higher time frames can help you decide whether to capture short-term fluctuations or ride long-term trends. If you find that the trend in the higher time frame contradicts your expectations, seize the opportunity to take profits; if the trend supports your trading direction, go with the trend.
(6) If the higher time frame is in a low volatility environment, hold part of your position because if volatility expands in your favor, you may catch a significant market move.
Playing around in the cryptocurrency market is essentially a battle between retail investors and whales. If you do not have cutting-edge news or original information, you can only be cut! If you want to layout together and harvest the whales together, feel free to join.$NXPC $SOLV #加密市场回调 #以色列伊朗冲突


