Sharing another historical trend of Bitcoin during the past two bull and bear cycles.
In the chart below, we can see from the peak of the 2013 bull market to the bottom of the subsequent bear market and draw a Fibonacci sequence, discovering that the price of the next round of the 2017 bull market will fall between 1.618 and 2.414 of this sequence expanding upwards.
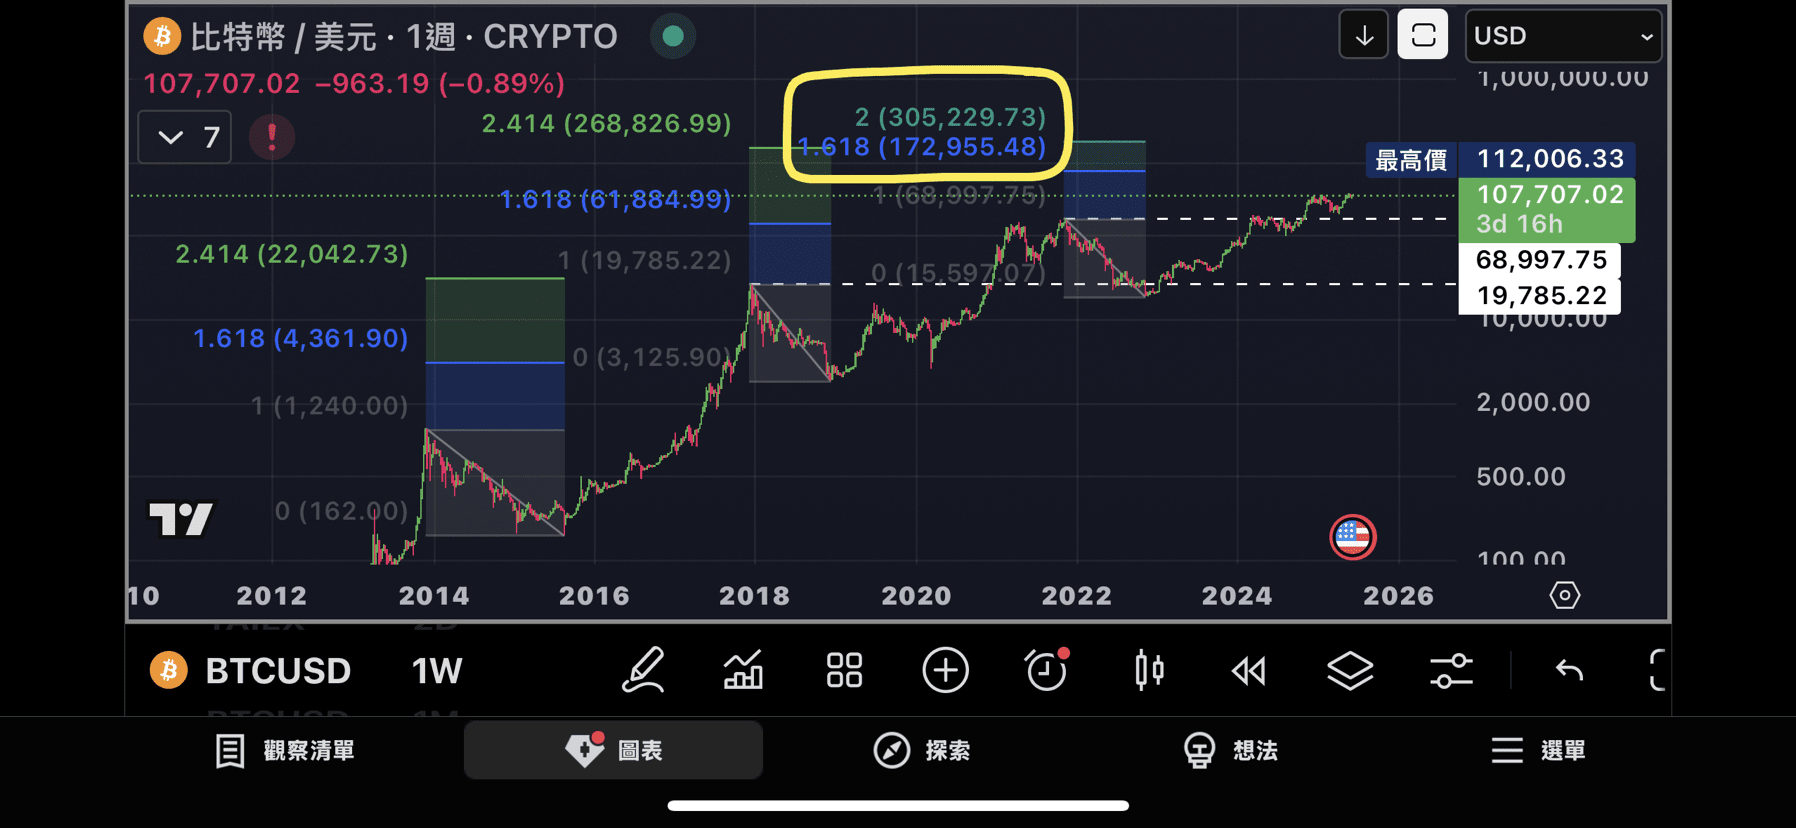
Similarly, drawing Fibonacci from the 2017 bull peak, we will find that the peak of the bull market in 2021 also falls between 1.618 and 2.414.
Following this inertia and deducing astonishingly similar history, we can find that the price of the bull market peak in 2025 will fall between 170,000 and 300,000 USD, starting from the bull market peak of 69,000 in 2021 down to the bottom of 15,000.
When the whole market is FOMO, we will have a bottom line in our hearts.
Selling is the hardest! Harder than buying the dip!
Here is a reference for everyone on the peak escape position!