I saw it shared by a foreign expert and found the historical similarities amazing
Just sharing
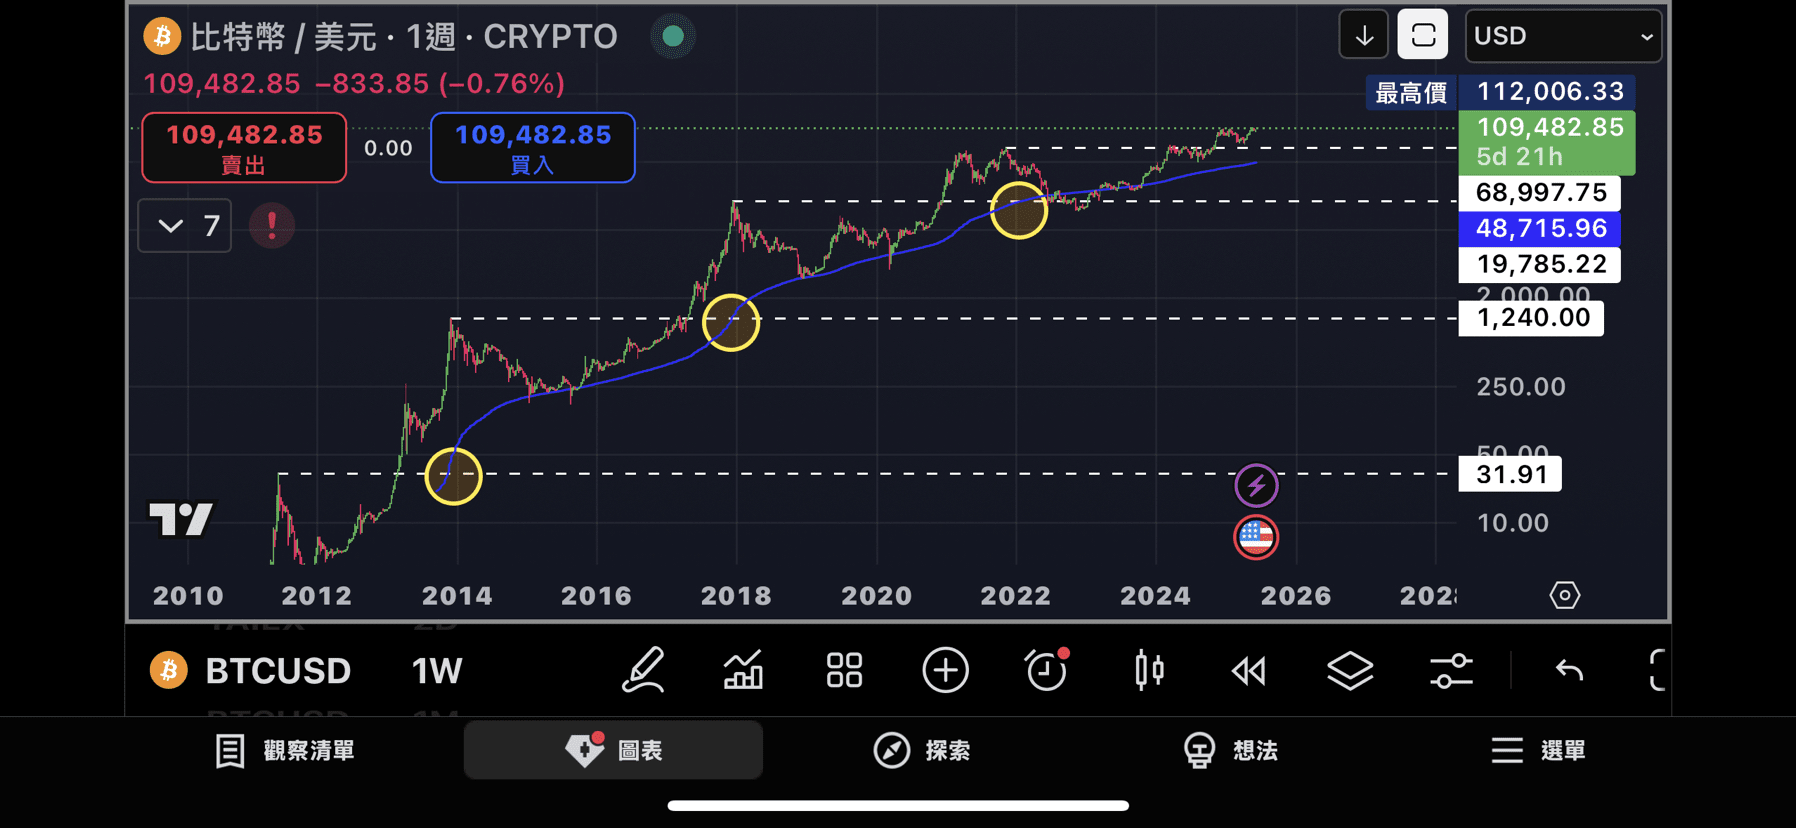
In the first image, the blue line is the 200-week moving average,
The white horizontal dashed line is the bull market peak of each round
Every time the blue moving average crosses above the previous bull peak
It will be the peak of this bull market
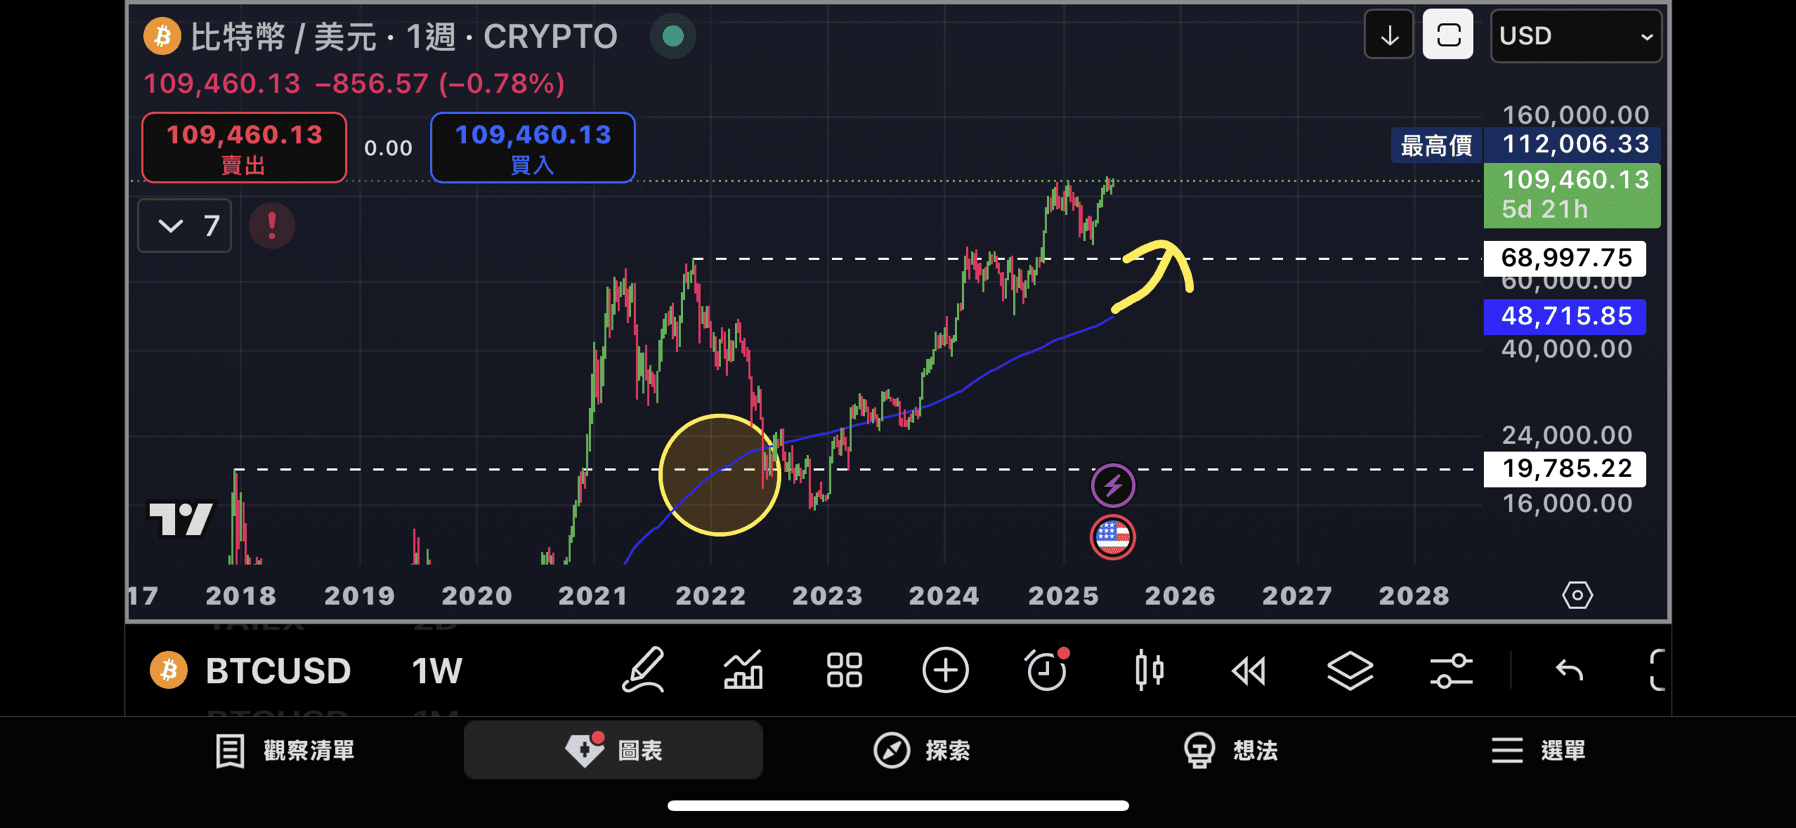
The second image is an enlarged view
If estimated according to this calculation
The 200-week moving average needs to cross above the previous bull peak of 69,000
The timing is likely to fall in the fourth quarter of this year
Maybe around September, October to December
It also coincidentally aligns with my previous estimate of the peak time of this bull market
It's really amazing! History is always remarkably similar
And I still think the peak of this bull run will be between 170,000 and 250,000 USD
We will wait and see 😎
Share with everyone, hope everyone can successfully escape the peak at that time 😇