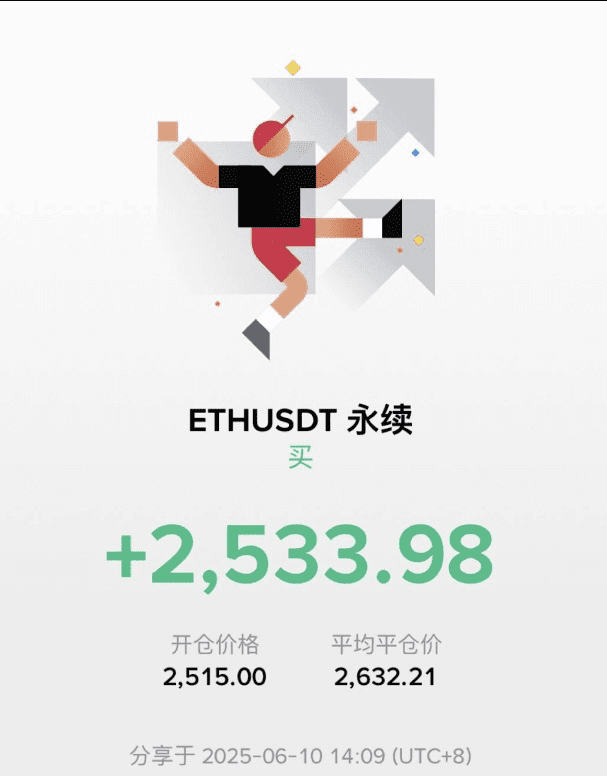
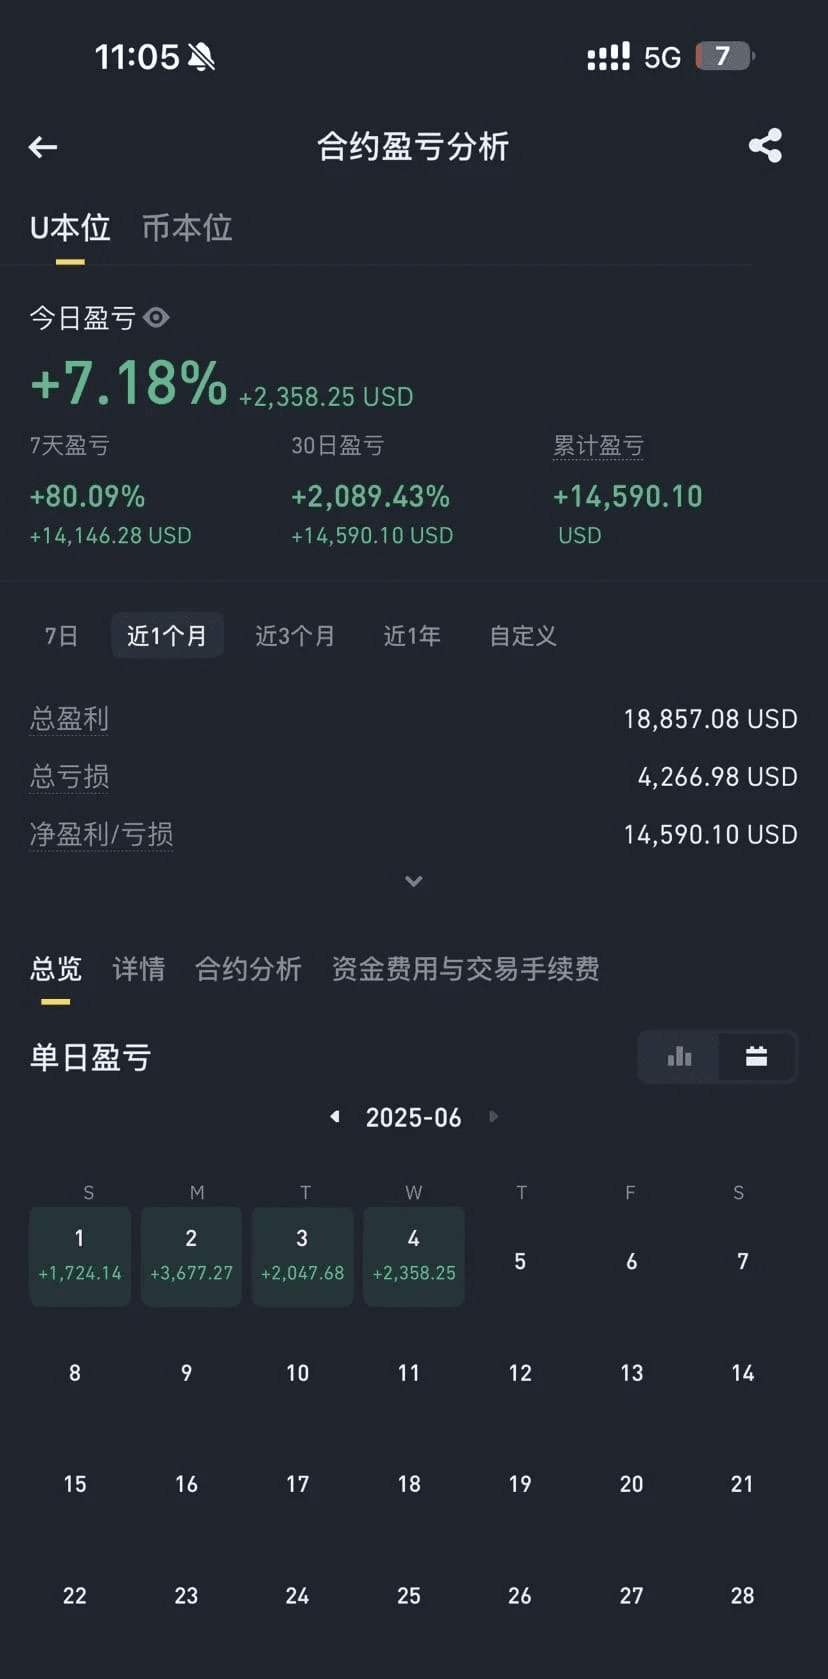
After much thought, I decided to share my short-term strategy, starting with 50,000 in the crypto market and achieving 53.98 million in just two years! [Check the comments section]
If you are currently at a loss and want to treat trading cryptocurrencies as a second career in the future, please read carefully; you will definitely gain something. I recommend saving this!
I went from a big loss to financial freedom, achieving a 2000 square meter villa and a Land Rover + a small Rolls Royce in Shanghai! [Be sure to check the comments section]
With ten years of experience, I tell you that if you do not understand 'trend candlesticks,' do not enter the market! Otherwise, you will definitely lose! (With illustrations)
Before learning about candlesticks, let's first understand the two-line reversal pattern.
What is a two-line reversal pattern? Let's understand this pattern in three steps.
First step:
Bearish two-line reversal: a bullish candlestick followed by a bearish candlestick; bullish two-line reversal: a bearish candlestick followed by a bullish candlestick.
Of course, this situation appears too frequently on the chart! It is almost meaningless, so don't rush.
Let's look at the second step:
1. The two-line reversal pattern is prominent, not hidden within a consolidation range.
2. The two candlesticks in the two-line reversal pattern, whether rising or falling, strongly push in the corresponding direction.
3. The two candlesticks have a large area of overlap.
At this point, some investors may feel slightly confused: what counts as a 'breakthrough'? What counts as a 'strong push'? What counts as a 'large overlap'?
This seems to reflect the differences between Eastern and Western approaches. Just like in cooking, a Chinese chef might say to add a little salt or a moderate amount of soy sauce. But how much is a little? How much is moderate? This undoubtedly has to be based on experience. In contrast, a Western chef would use a scale to tell you how many grams of salt, how many grams of sugar, etc.
Both methods have their pros and cons; the quantitative approach of foreigners is easier for beginners to grasp. However, when the environment changes, overly rigid doctrines lack flexibility. To help everyone master this strategy more quickly, I will still use the foreign quantitative method, and you can optimize it in practice (I will provide examples again at the end).
If we want to quantify the above-mentioned 'breakthrough,' 'strong push,' and 'large overlap,' we need to introduce a concept called 'typical price':
Typical price = (high + low + close) ÷ 3. From the formula, we can see that the so-called typical price refers to the average of the high, low, and close of a candlestick.
In trading, we do not need to calculate the typical price ourselves. Here I will share a simple method: use the moving average indicator to view the typical price. The specific method is to open the parameter settings of the moving average indicator and set the 'time period' to 1, selecting 'Apply to' as Typical Price (HLC/3):
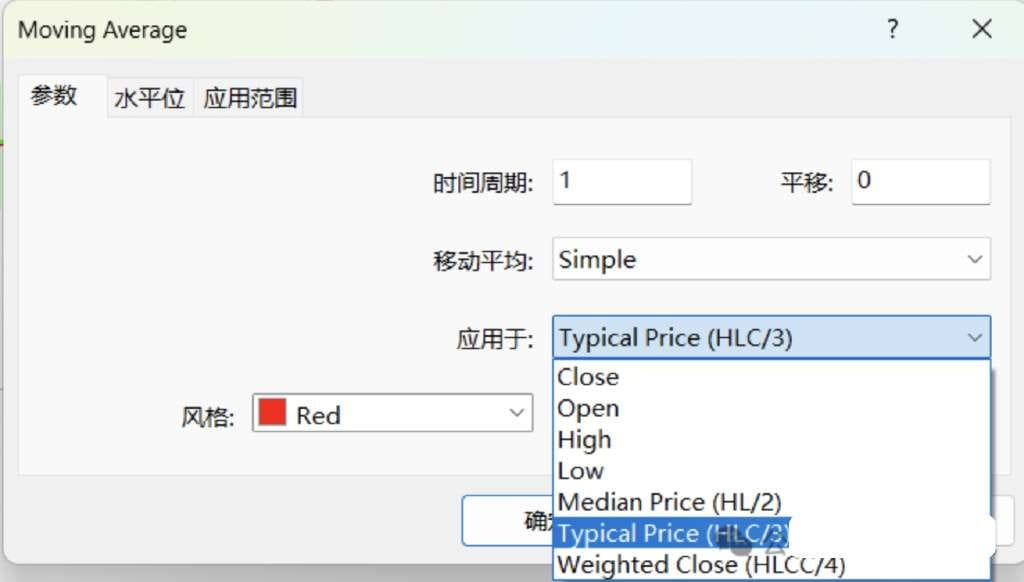
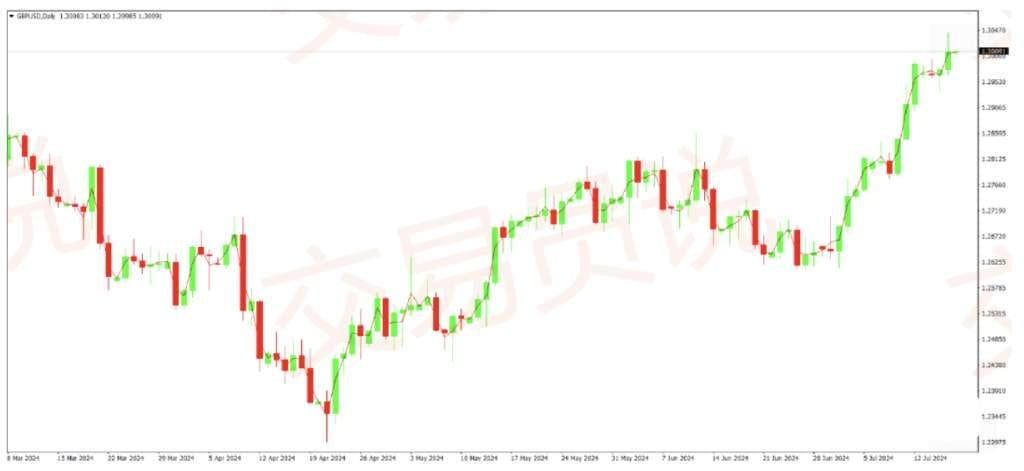
We chose the daily chart of GBPUSD and set it up as follows:
Next, we will get to the core essence of this strategy.
After understanding typical prices, let's further elaborate on the third step. For convenience, we refer to the first candlestick in the two-line reversal pattern as candlestick B and the second candlestick as candlestick C:
1. How to define 'breakthrough': In a bullish reversal, the typical price of candlestick B must be lower than the low of the previous candlestick (i.e., candlestick A); conversely, in a bearish reversal, the typical price of candlestick B must be higher than the high of candlestick A.
2. How to define 'strong push': Both candlestick B and C must be trend candlesticks (I will detail the trading strategy of trend candlesticks later; here you only need to know its definition: the body occupies more than 50% of the entire candlestick length).
3. How to define 'large overlap': The typical price of candlestick B must be within the range of candlestick C, and likewise, the typical price of candlestick C must also be within the range of candlestick B.
After grasping the essence of the two-line reversal, we can start looking for entry signals:
When a bearish two-line reversal pattern appears, if the price breaks below the low of candlestick C or B (taking the lower of the two), that is our opportunity to enter a short position.
When a bullish two-line reversal pattern appears, if the price breaks above the high of candlestick C or B (taking the higher of the two), that is our opportunity to enter a short position.
Several classic cases
Next, let's introduce a few typical two-line reversal pattern cases.
Taking the 1-hour chart of gold as an example, we have marked four bullish two-line reversal patterns (in the oval area) and two bearish two-line reversal patterns (in the rectangular area). Among them, there are more typical ones (B and C) and less typical ones (A and D). Let's analyze them one by one:
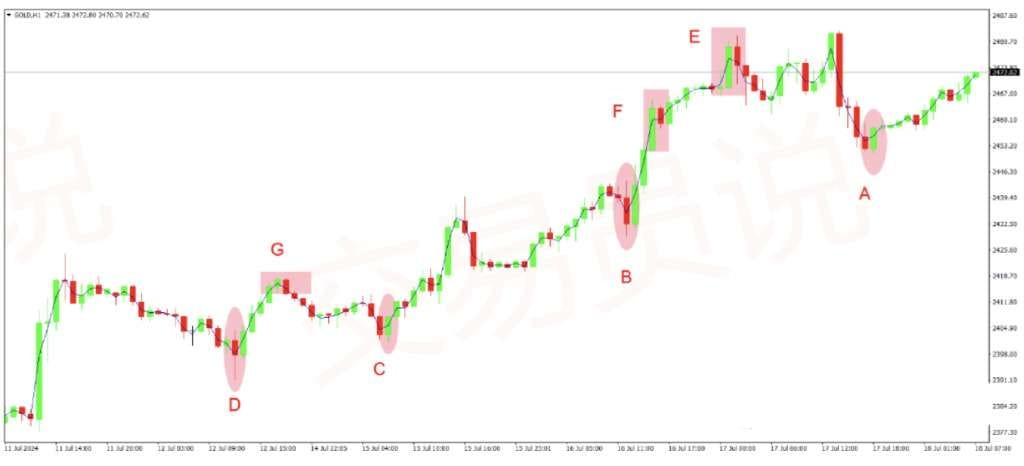
In the picture, after the four bullish reversals A-D appeared, there were good rebounds, but only B and C belonged to relatively typical two-line reversals. In both combinations, the typical price of candlestick B is lower than that of candlestick A, both are trend candlesticks, and their typical prices also encompass each other's ranges.
The reason A does not meet the criteria lies in two points:
First, the typical price of candlestick B is not lower than the low of candlestick A;
Second, candlestick B is not a trend candlestick.
The reason D does not meet the criteria lies in the second point that candlestick B is not a trend candlestick.
In the figure, among the three bearish reversal patterns EFG, E failed to meet the strict standard of the two-line reversal pattern because candlestick C does not constitute a trend line.
F and G meet three conditions, but F did not trigger an entry signal after it appeared, as it did not break below the low of candlestick C. Only G barely met the three conditions, and the subsequent pullback was also very weak.
From this case, we can see the first usage of the two-line reversal pattern: under the condition of maintaining an upward trend on a larger time frame chart, the two-line reversal pattern provides a good signal for the beginning of a short-term pullback and a bottom signal, reminding us of the opportunity to buy on dips for long positions.
Now let's look at the second case, which is the daily chart of EURUSD. In the figure below, I have marked more two-line reversal patterns. It is important to note that although many turning points appear in the form of two candlestick reversals, not all turning points meet the standard of the two-line reversal pattern:
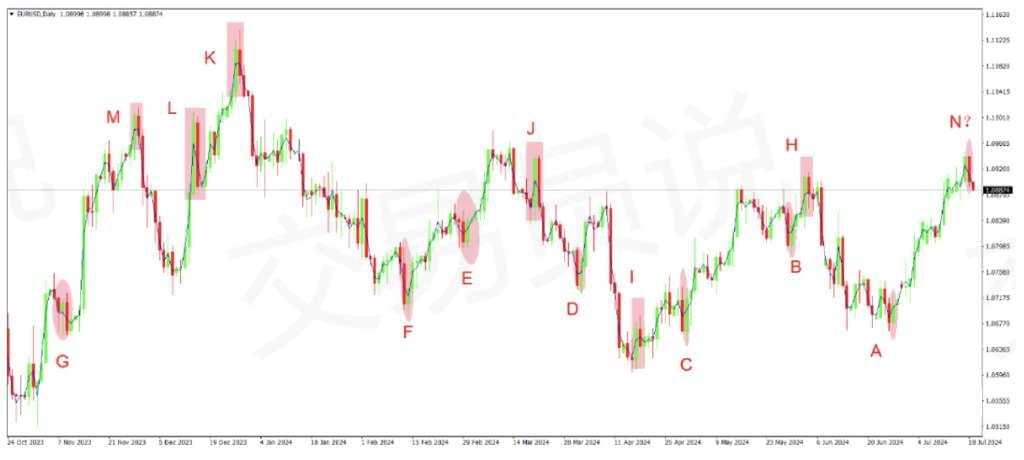
In the bullish two-line reversal pattern shown in the figure, except for E and G, all meet the requirements of the two-line reversal pattern. The reason is that they do not meet the condition of 'the typical price of candlestick B being lower than the low of candlestick A.' In the bullish two-line reversal pattern, I does not constitute a two-line reversal pattern because it does not meet the condition of 'the typical price of candlestick B being higher than the high of candlestick A.'
Of course, there is also a new signal here, which is the position N in the figure. Since this signal has not yet been validated, I added a question mark. Everyone can pay attention to whether EURUSD will experience a pullback in the coming days.
Let's look at the third case, the weekly chart of crude oil:
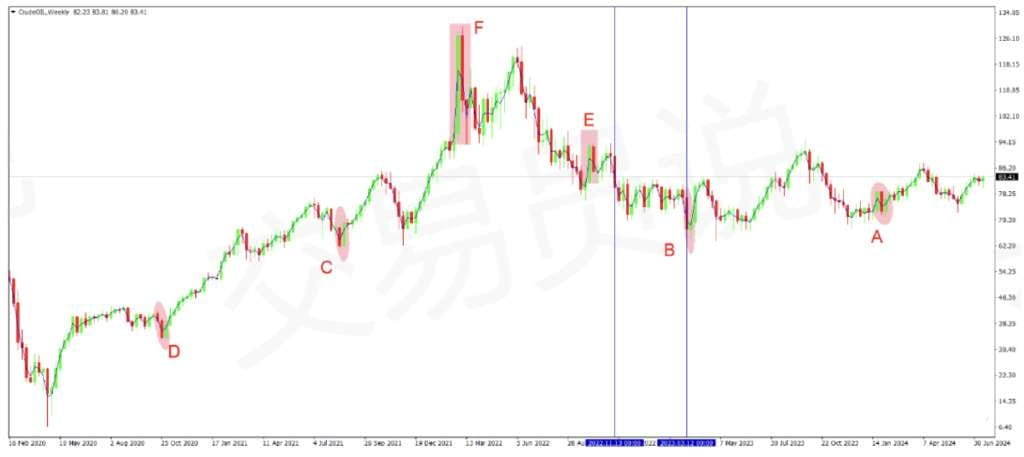
The bullish two-line reversal within area B in the picture is not standard because candlestick C is not a standard trend candlestick (the body occupies less than 50% of the candlestick's length). Apart from that, the bullish two-line reversal within the rectangular area is a relatively standard two-line reversal pattern.
This chart reveals a crucial aspect of the two-line reversal, which sets it apart from ordinary bullish engulfing patterns, etc. Since November 13, 2022, oil prices entered a consolidation phase, during which multiple bullish engulfing patterns appeared, but none of these patterns met the standard for a two-line reversal.
In other words, the two-line reversal pattern is essential in naked candlestick trading, serving to exclude false signals within consolidation ranges.
Both Eastern and Western approaches have their strengths and weaknesses.
Of course, no strategy is 100% successful. We have also marked some failed reversal signals on the chart, such as A in the crude oil chart, which involves the strengths and weaknesses of both Eastern and Western methods.
When we set the rules too rigidly, we may miss some trading opportunities. For example, in the 1-hour chart of gold, A and D, especially D's reversal pattern, deserve a careful review.
It does not meet the standard two-line reversal because candlestick B does not constitute a trend candlestick, as its body is less than 50% of the overall length. However, if we take a closer look, we can find that the body of candlestick B is not small. In candlestick language, the body expresses strength or weakness. Therefore, candlestick B actually meets the standard for a strong push. Additionally, the reason the body does not occupy 50% is due to the long lower shadow, but the lower shadow in candlestick language is often a bullish signal, consistent with the signal of this reversal pattern itself.
In addition to missing some true signals, we may also be confused by some false signals, such as A in the weekly chart of crude oil. This signal once formed a 'breakthrough' trend but quickly returned to the original consolidation range. From the chart, we need to wait for a break below this range before confirming the beginning of a downward trend.
In simple terms, rules are just to help us quickly understand strategies. Once we accumulate a certain level of experience, we can gradually optimize strategies in trading.
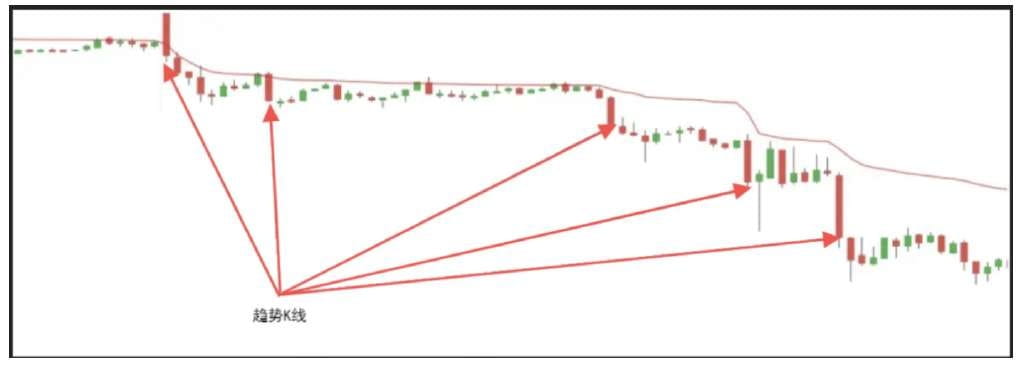
What is a trend candlestick?
A trend candlestick is a common candlestick pattern characterized by a long body and short shadows. It is also known as a wide-body candlestick.
Trend candlesticks do not have a fixed definition; their body length is mainly compared to the preceding and following candlesticks. When we see that the body of a certain candlestick suddenly becomes much larger than the bodies of the candlesticks before and after it, we say this is a trend candlestick.
The logic behind trend candlesticks appears only when the balance of power between bulls and bears is very uneven. Furthermore, the appearance of trend candlesticks often indicates that the price has reached a certain supply or demand area. Therefore, these candlesticks are often signals of supply/demand zones. So, what methods can we use to predict future price movements based on the appearance of this candlestick? Let's take an example. Suppose you opened a long position at a certain price level, and then you were very fortunate to see the price start to rise, forming a trend candlestick, and we have floating profits. In order not to let the floating profits turn into losses, what would you do? Yes, I believe many people would adjust the stop loss to near the entry price, so that even if the price reverses later, we will not incur a loss on exit.
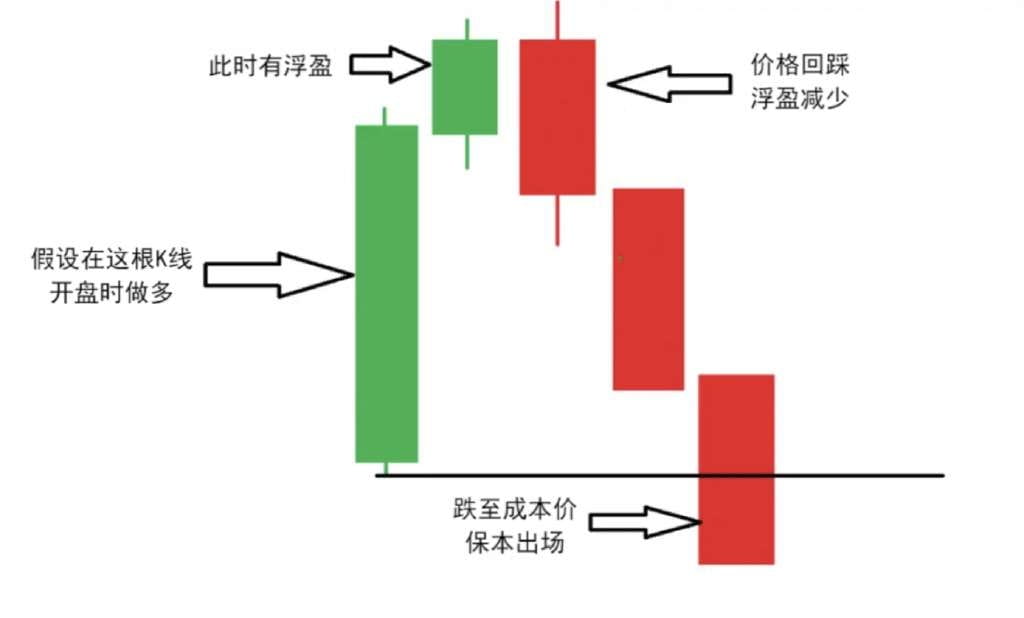
But soon after, the price starts to retrace and approaches our entry price.
What would you do at this point? To prevent profits from turning into losses, many people would exit after reaching the entry price, selling their positions, thus accelerating the reversal of the price movement.
After understanding the logic of trend candlesticks, there is one more thing to note: although trend candlesticks are important supply and demand zones, when the price approaches these zones, whether to go long or short should not be generalized. Instead, it should be combined with intraday bias and market liquidity distribution. Let's take my short-selling idea from February 5 as an example:
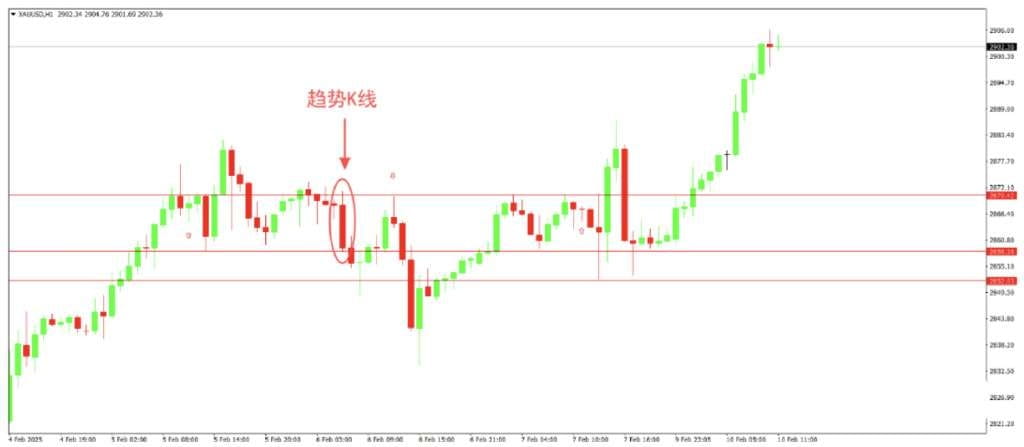
At that time, the price was already close to the high point of the previous trend candlestick. If the price continues to rise, many investors may fear that profits will be entirely given back and choose to close their positions, switching from short to long. In this case, the short side would face very rich liquidity (selling requires buyers; the more buyers there are, the faster sell orders are executed). Therefore, under the bias of a decline during the day, it's very likely that the high point of this trend candlestick is the reversal point for the price.
As for how to judge the intraday bias, I will provide a detailed introduction in another section of this course. Next, we will continue to introduce other uses of trend candlesticks.
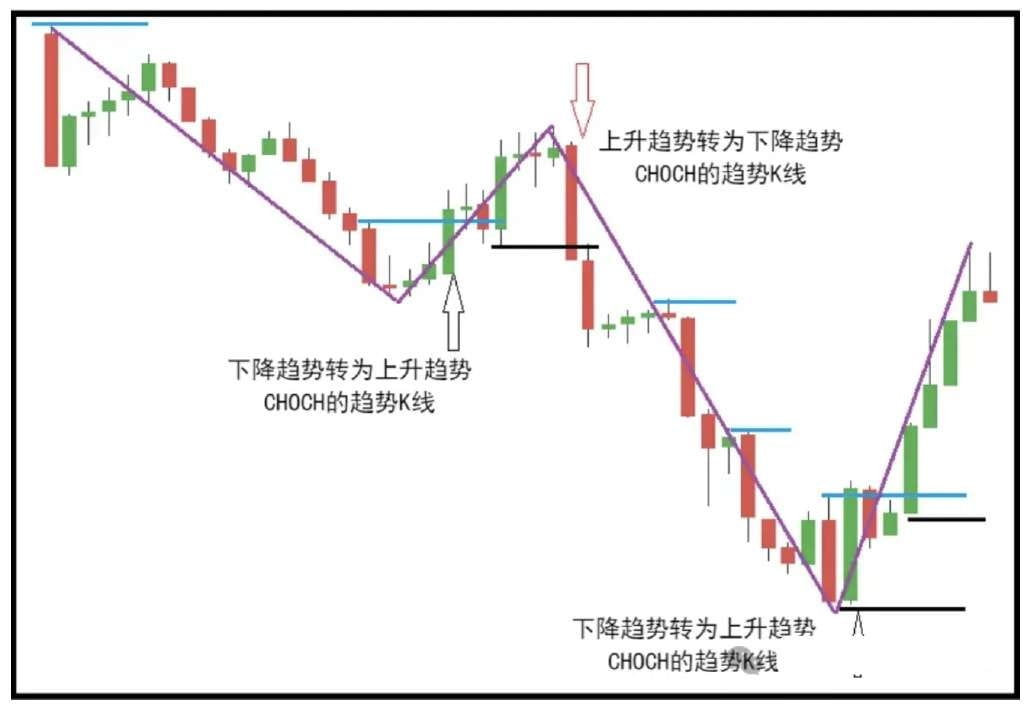
Trend candlestick usage: Breakthrough, identifying buy and sell peaks, and structural changes
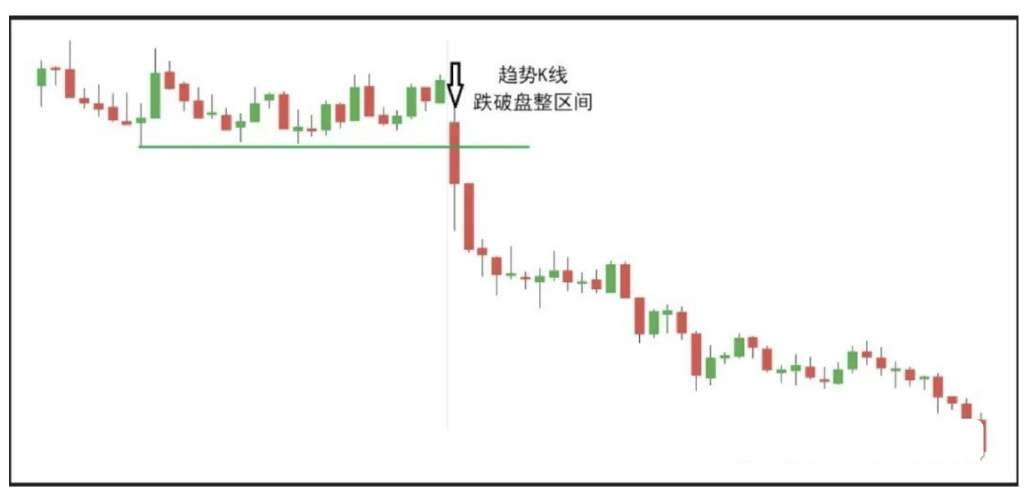
First, let's look at the first use of trend candlesticks, which is breakthrough. When the price enters a consolidation phase, the appearance of trend candlesticks often signals that the consolidation has been broken and that the price is about to embark on a new wave of movement.
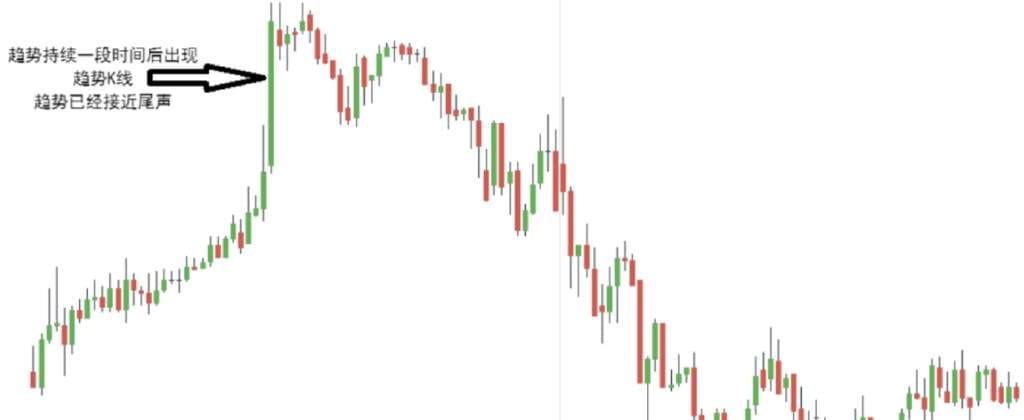
I will specifically explain the breakthrough trading strategy in the next article, but here we can first understand the function of trend candlesticks. The second use is to identify buy and sell peaks. When a trend has continued for a period, if a particularly obvious trend candlestick suddenly appears, it may signal that the trend is about to end and reverse.
The third use is what I mentioned earlier, CHOCH, which means structural change. Trend candlesticks can help us identify swing turning points and also aid in distinguishing between true and false trend reversals. For example, when the price retraces, how do we determine whether it is a temporary pullback or a change in trend? At this point, trend candlesticks play a significant role:
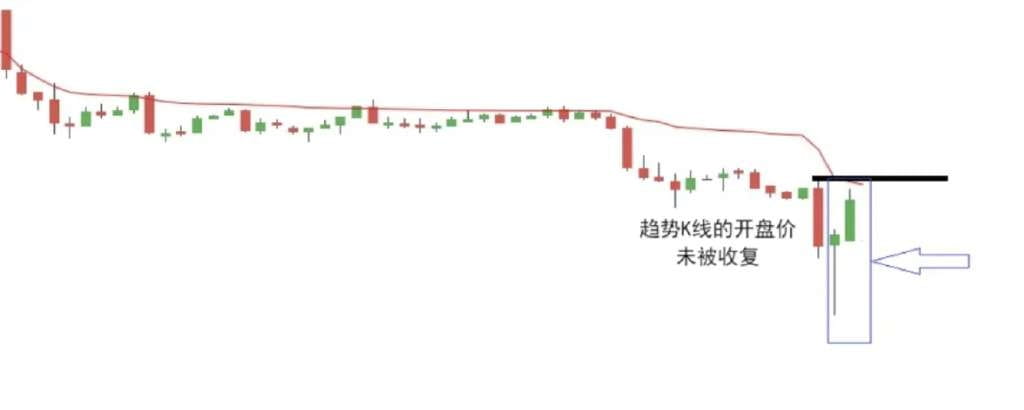
When the price breaks below the opening price of the trend candlestick, a reversal may occur. In the figure below, the price forms a morning star pattern. For beginners, it is easy to be deceived here, mistakenly thinking that the price is about to reverse. However, we can use trend candlesticks to make judgments. For example, the candlestick 1 in the figure has not been completely engulfed, so the reversal logic does not hold. Therefore, we cannot consider that the trend has reversed at this point. On the contrary, this may just be a profit-taking by the shorts, representing an opportunity to short at a high.
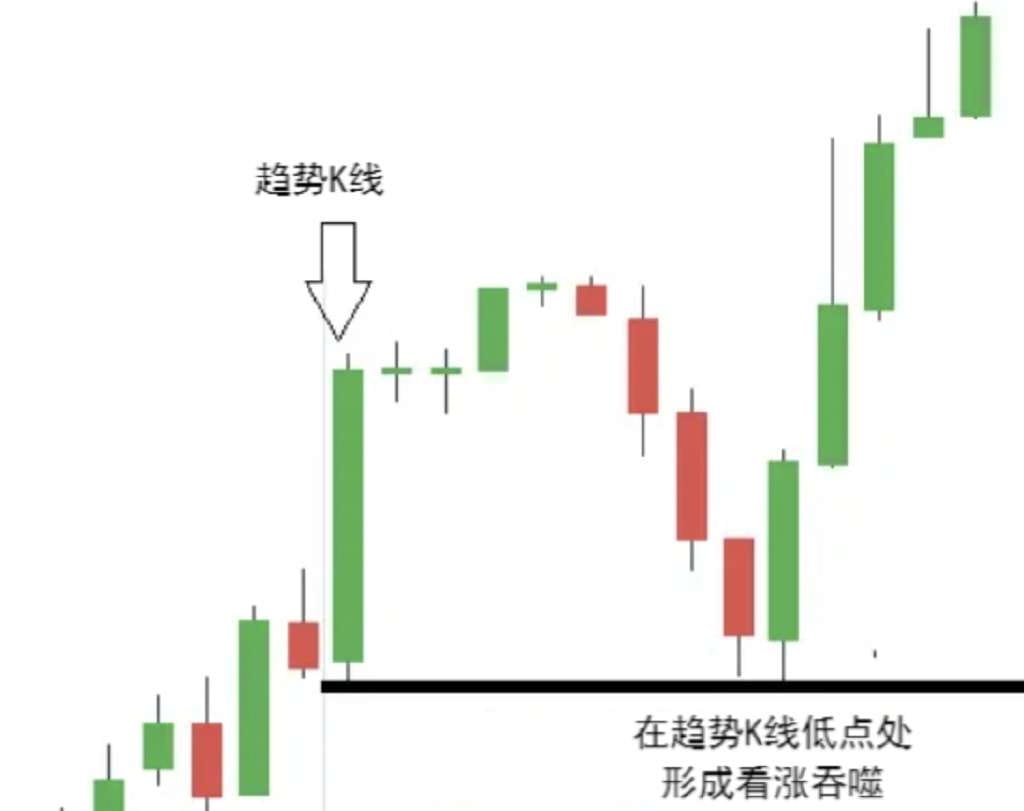
Similarly, if a reversal pattern appears when the price retraces to near the opening price of the trend candlestick, there is a high probability that the price may return to the original trend:
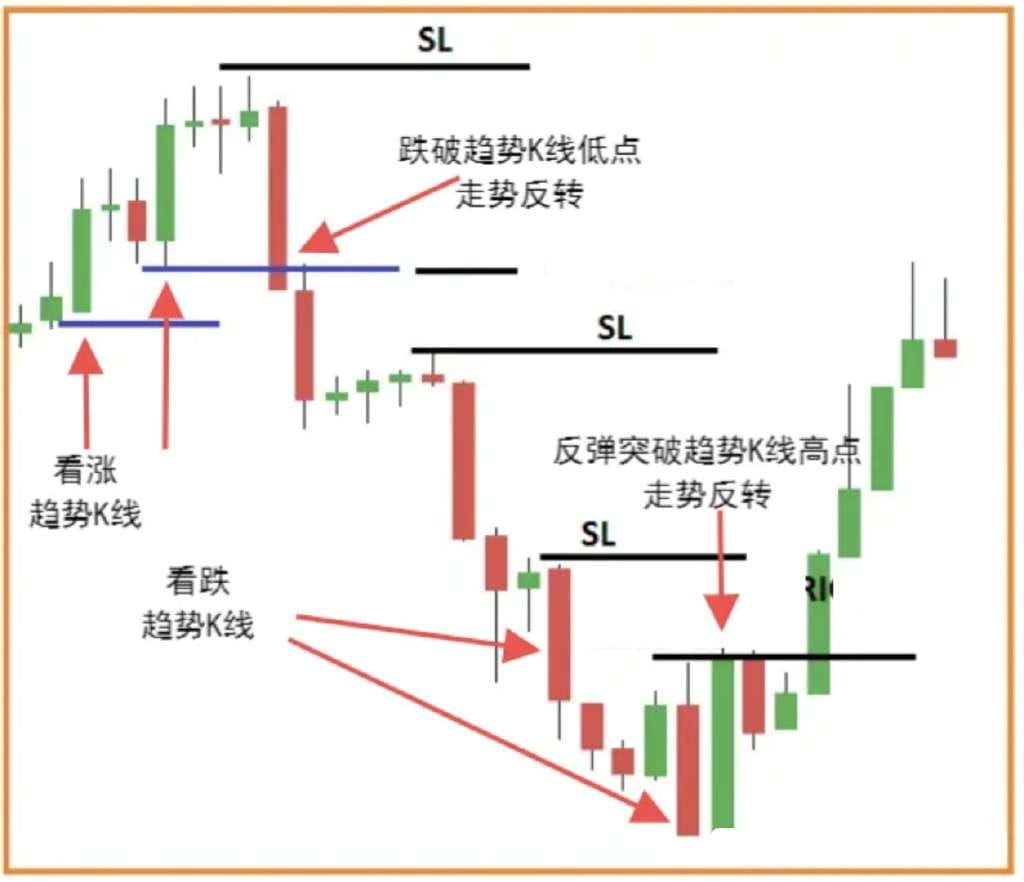
Let's look at another case where the price pushed for a reversal in the form of a counter-trend candlestick after touching the trend candlestick. Here, the low point of the trend candlestick forms a suitable stop-loss level.
[Check the comments section]
