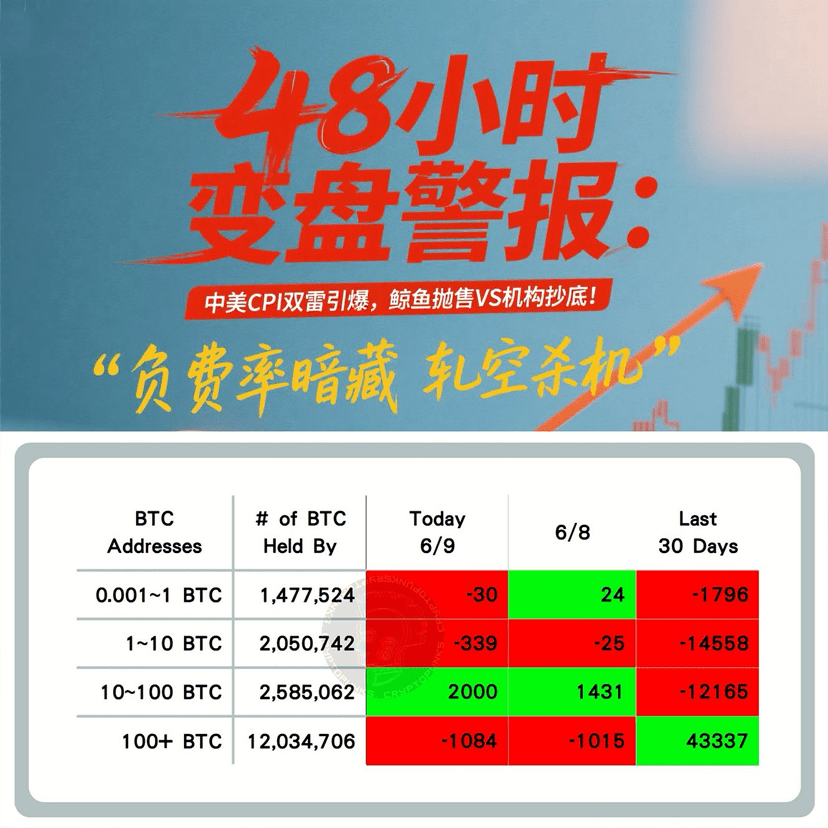
Special note: $BTC100+ big whales sold (sold for two consecutive days)
China-US negotiations + CPI announcement! BTC is about to choose a direction! This change may happen within 48 hours
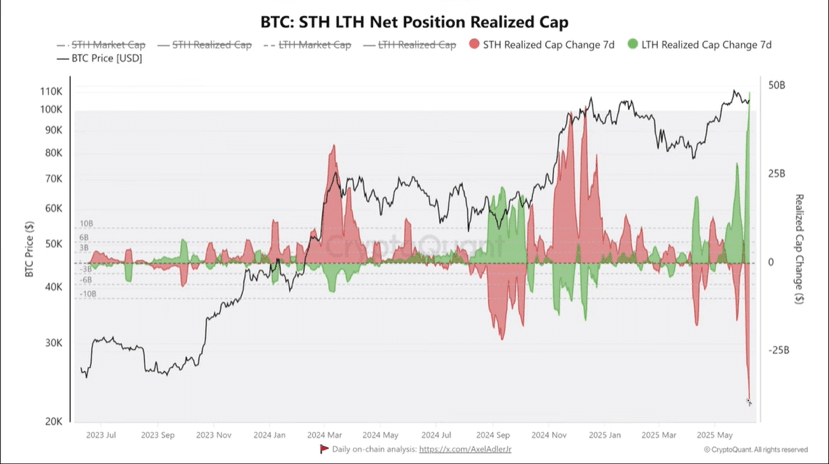
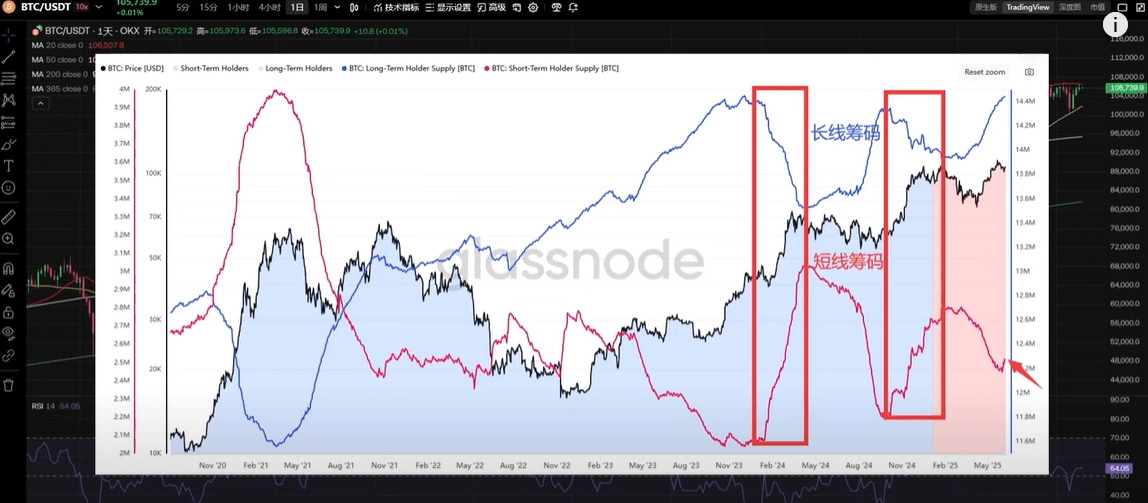
Short-term traders are selling aggressively, while long-term holders are buying aggressively.
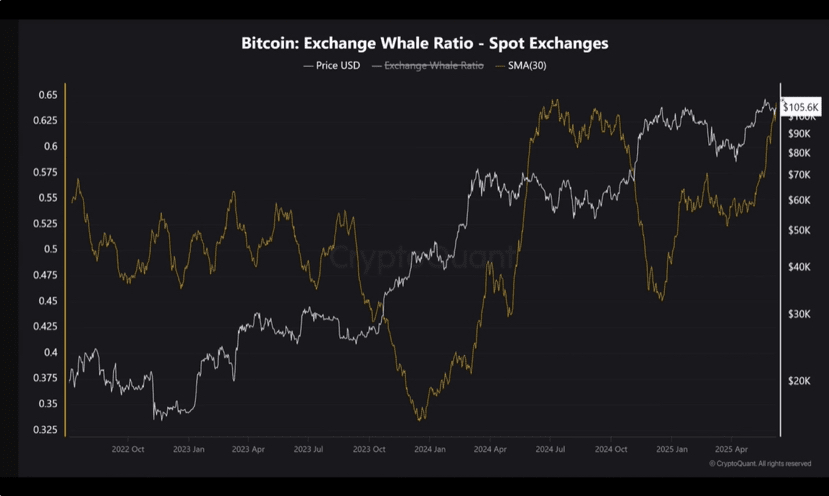
The proportion of BTC held by large whales on exchanges has exceeded 60%, approaching a new high
The exchange funding rate has turned negative
This week's trade talks between China and the United States on Tuesday
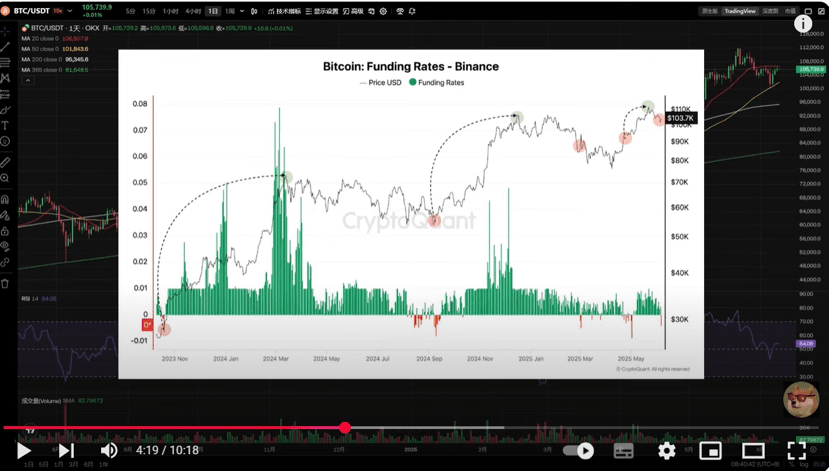

Funding rates have dropped significantly, exchange funding rates have turned negative, and short positions are increasing
 A large number of short sellers have started to short sell crazily again, the funding rate has shown a payment rate again, and the position level has increased. Will these short sellers become the fuel for BTC to rise?
Short-term traders are selling aggressively, while long-term holders are buying aggressively.
 The proportion of BTC held by large whales on exchanges has exceeded 60%, approaching a new high
BTC inflows and outflows from exchanges BTC continued to outflow from exchanges in large quantities, hitting a new low, but the outflow rate has slowed down.
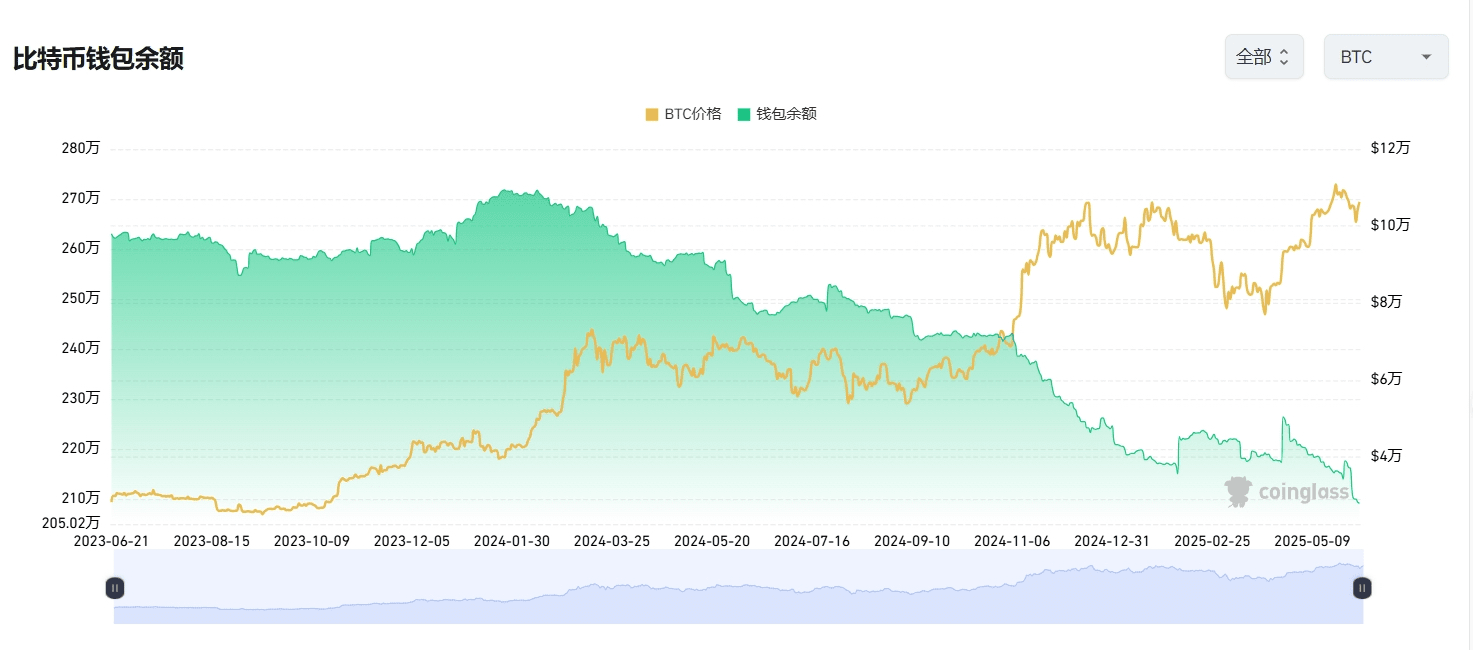
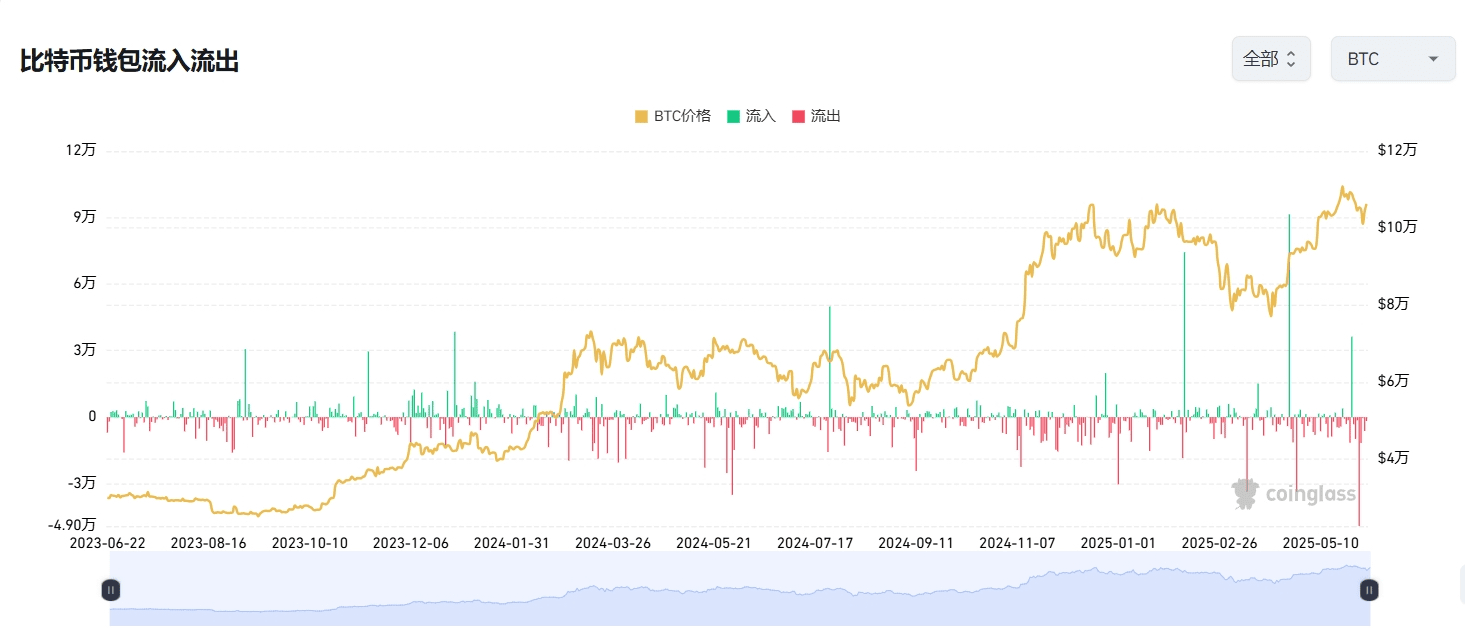
** Interpretation of the meaning of BTC inflow and outflow data
The BTC inflow and outflow of exchange wallets is a core on-chain indicator of the crypto market, directly reflecting the movement of major funds and market sentiment.
Inflow ↑ Holders deposit BTC into exchanges. Expected selling pressure increases. Beware of short-term declines.
Outflow ↓ Holders withdraw BTC from exchanges Increasing willingness to hoard/lock positions Indicates medium-term bullishness
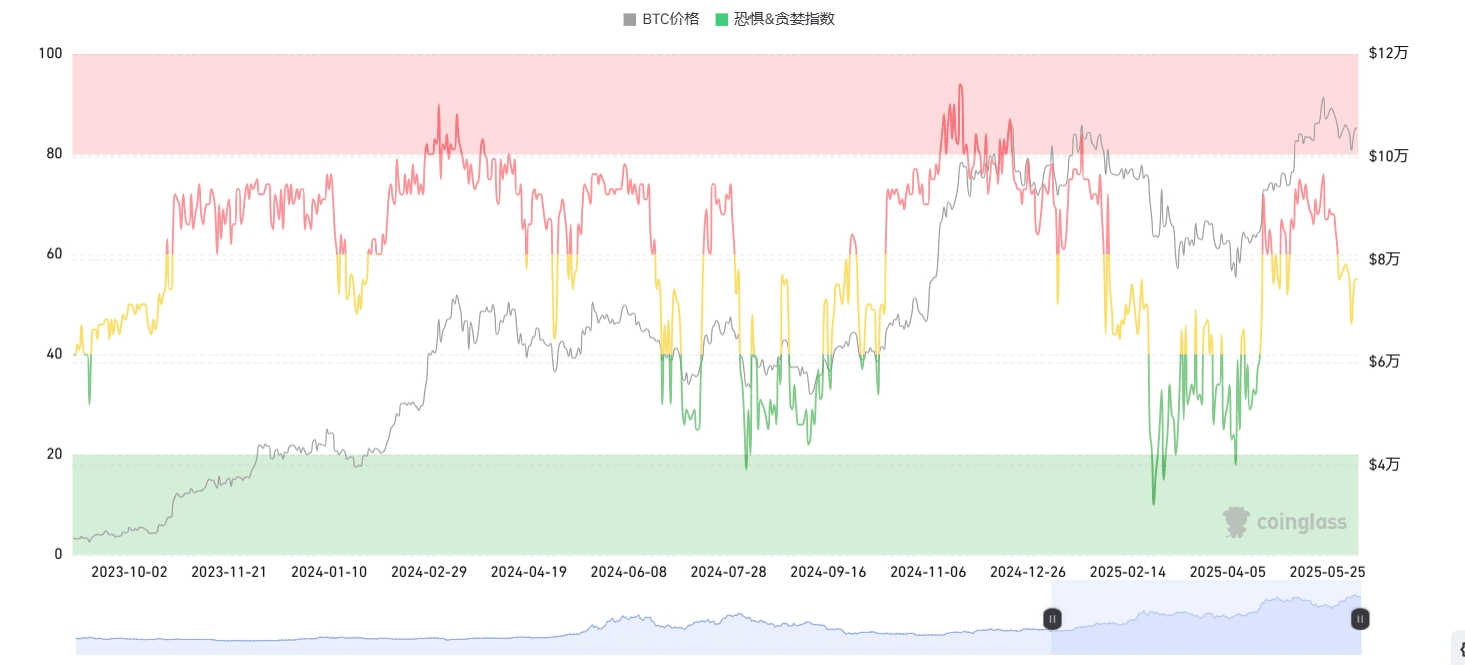
1. Greed and Fear Index Today: 55 Neutral Rising from yesterday
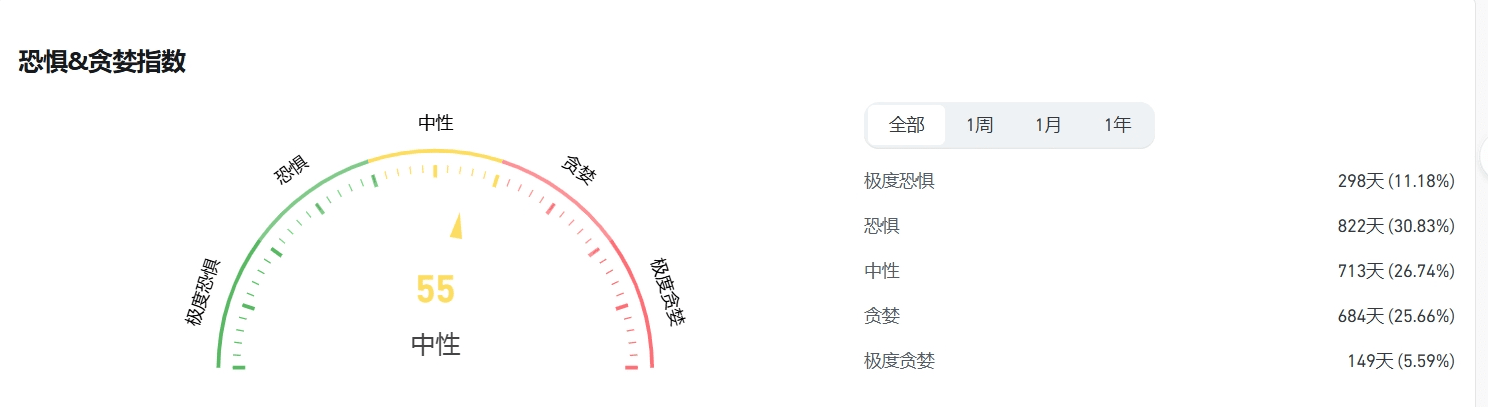
** Greed Panic/ Greed Index Interpretation
The behavior of the cryptocurrency market is very emotional. When the market is rising, people tend to be greedy and have a fear of missing out, and when the market is falling, they react irrationally by selling their cryptocurrencies.
With the help of the fear and greed index, we can help our friends get rid of the influence of their own emotional factors and make irrational judgments as much as possible.
There are two states:
Extreme fear indicates that investors are overly worried and could be a buying opportunity.
Being too greedy suggests that investors are too excited and the market may be due for a correction.
2. Bitcoin’s total market share: 63.49, slightly higher than yesterday
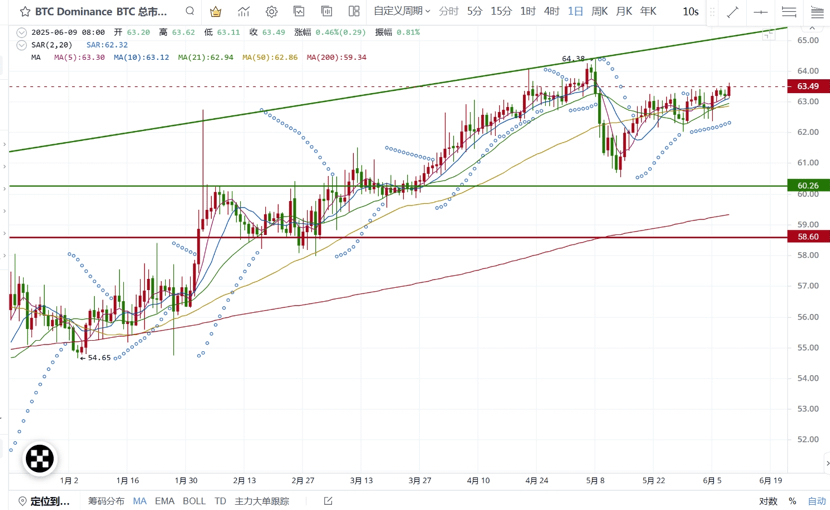
**Bitcoin's total market share is a core indicator to measure Bitcoin's relative influence in the entire cryptocurrency market. This indicator not only reflects Bitcoin's short-term market position, but also reveals changes in capital rotation, investor sentiment and macro trends.
Bitcoin market share is a barometer for judging the market stage:
Early stage of bull market: market share increases, and funds are allocated to Bitcoin first.
Mid- to late-stage bull market: Market share declines, funds rotate to altcoins, triggering the “altcoin season”
Market thermometer: >60% = risk aversion; <40% = altcoin frenzy.
Fund flow chart: reveals the allocation preferences of institutions and retail investors (Bitcoin → stable, altcoin → high risk and high return)
3. Bitcoin and Ethereum trading pair 0.023942 Ethereum to Bitcoin trading pair fell back
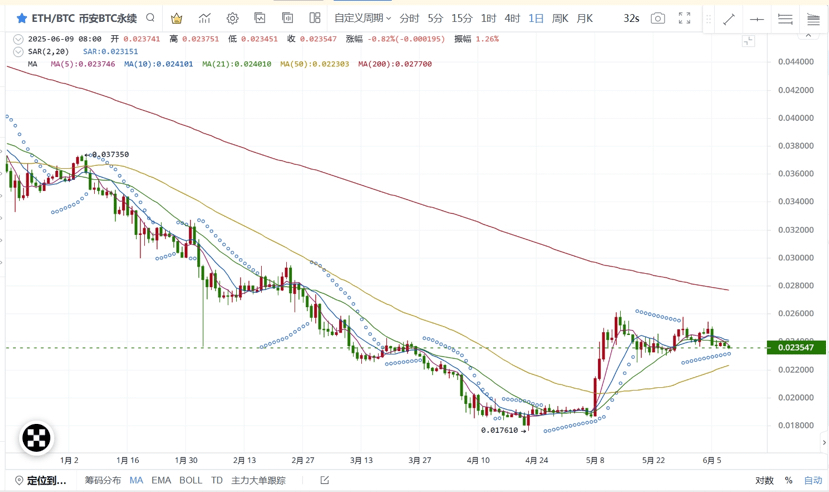
**The Bitcoin/Ethereum trading pair is the “risk thermometer” of the cryptocurrency market:
Ratio rises → market prefers high-risk assets (signal of the start of the altcoin season);
Ratio decreases → funds flee to Bitcoin (characteristic of a bear market or early bull market).
4. ETF inflow and outflow data: The inflow rate of ETF data slowed down, and the outflow remained small (data was closed on Friday)
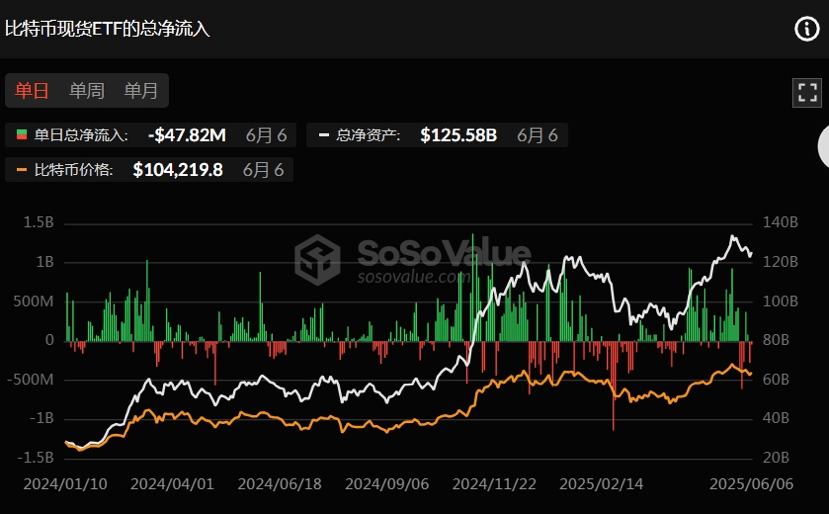
**ETF inflow and outflow data description: Bitcoin ETF's inflow and outflow data is a core indicator for tracking institutional sentiment, market trends and fund rotation.
5. Statistics of BTC buying and selling by retail, large and institutional investors on the chain. Large whales have been outflowing for two days.
Thanks to @交易扑克大 for providing data collation and sharing
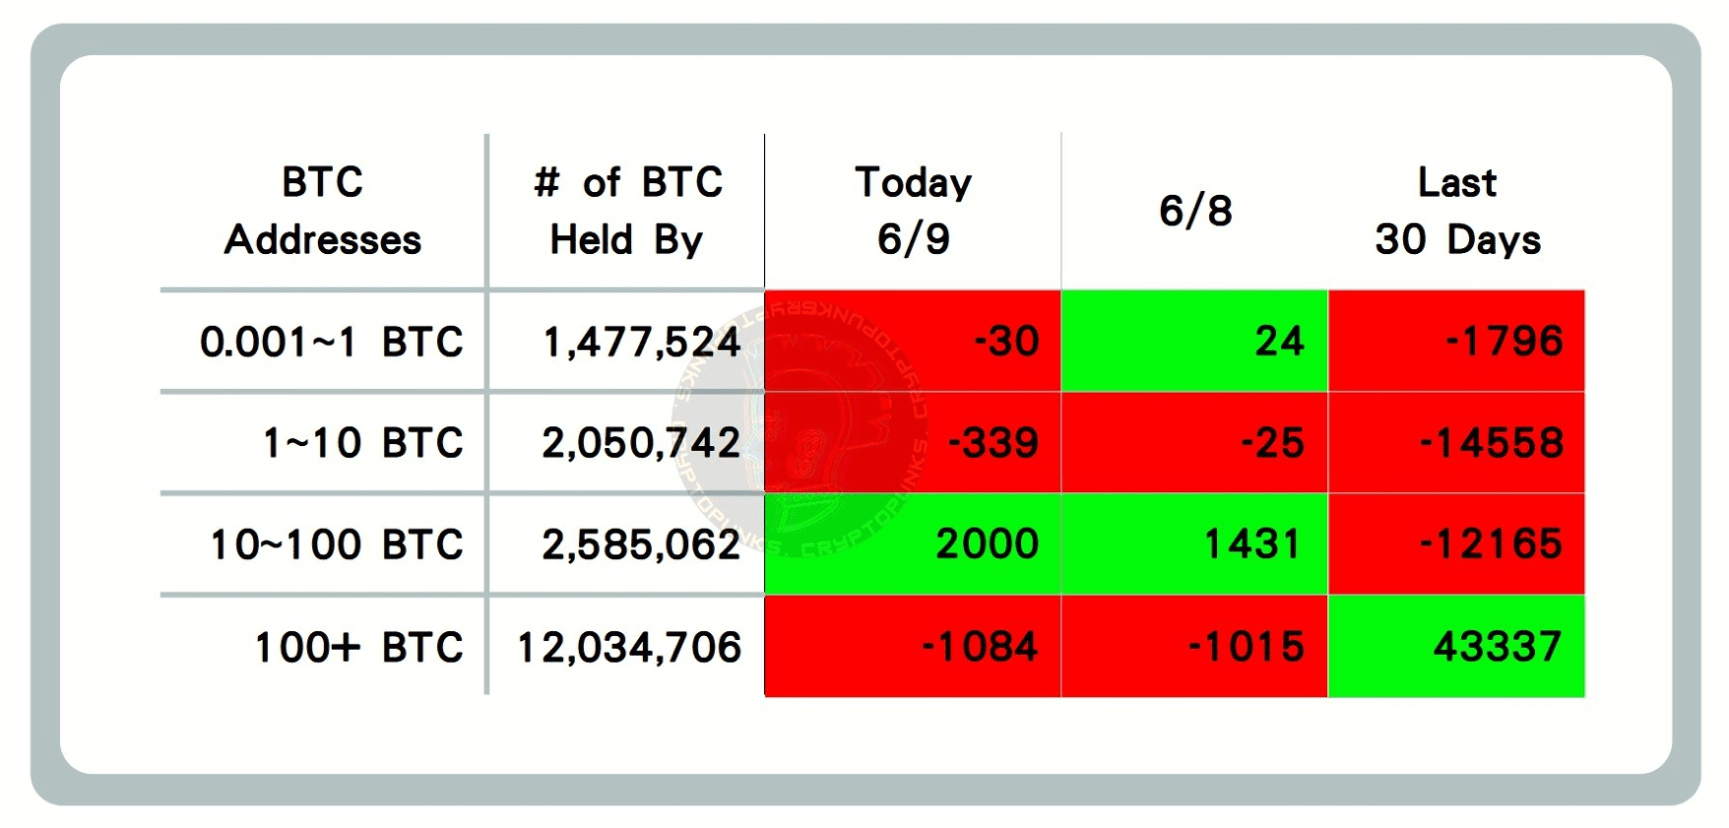
Data description: Represents the increase or decrease of on-chain flow of ≤ 1 BTC, 1-10 BTC, 10-100 BTC, and 100+ BTC respectively. This data can reflect the market sentiment of retail investors, large investors, and institutions.
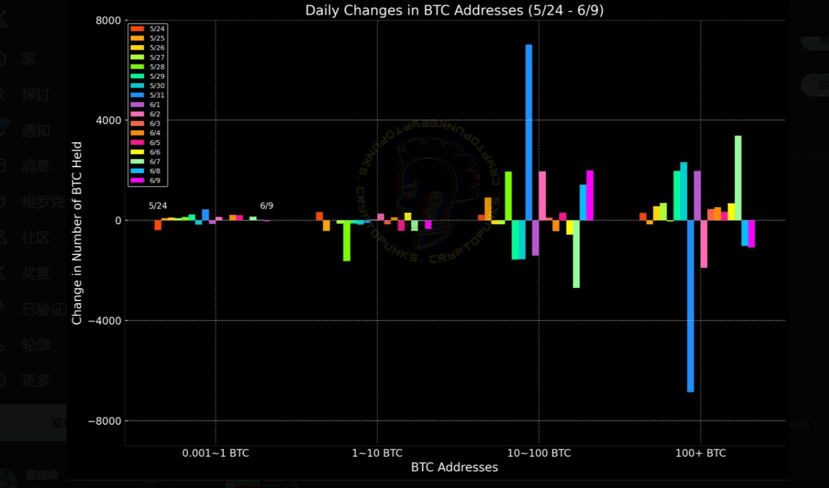
Data description: This data reflects the increase or decrease of on-chain flows of ≤ 1 BTC, 1-10 BTC, 10-100 BTC, and 100+ BTC within a week. This data can intuitively reflect the flow trend of BTC among retail investors, large investors, and institutions in the market.
When an extreme situation occurs in the on-chain data, a reversal often occurs (for example, if a large whale with more than 100 BTC on the chain buys a large amount, while others sell, the probability of Bitcoin rising greatly increases, and vice versa). At the same time, it is necessary to combine the analysis with other on-chain data and technical indicators.
6. MVRV realized market value ratio MVRV > 1
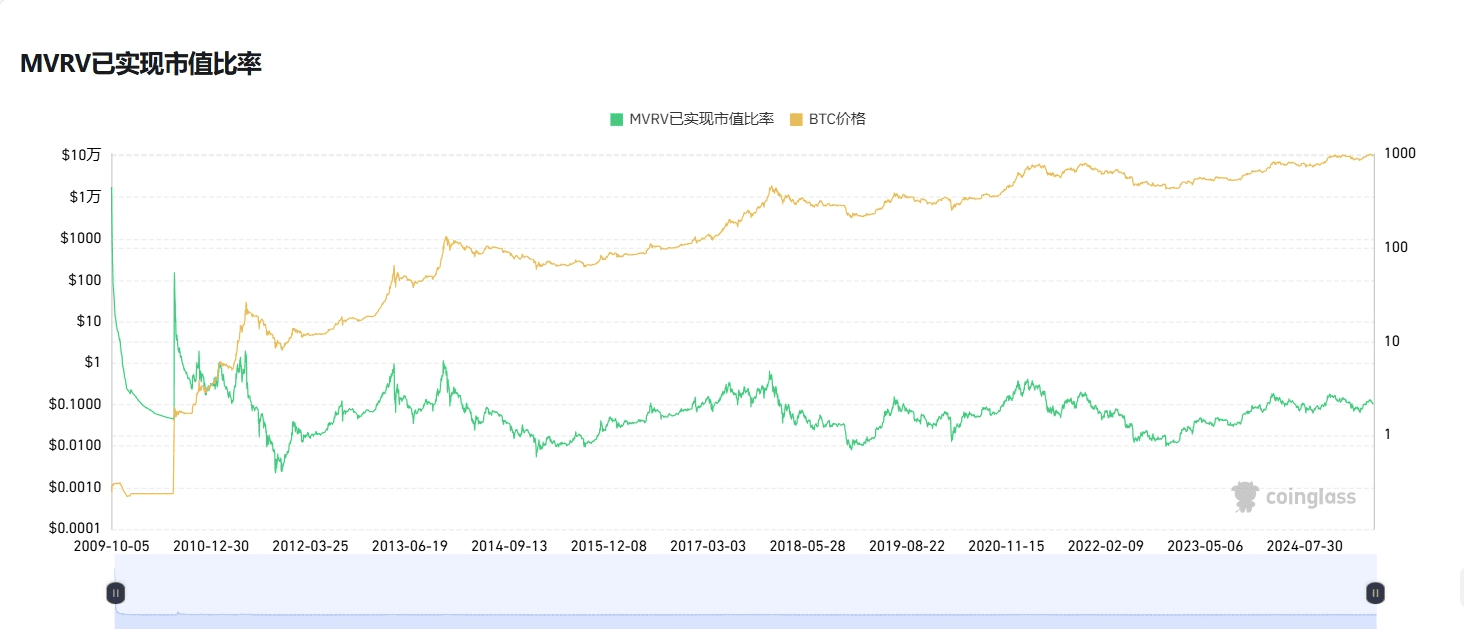
**MVRV realized market value ratio indicator description: MVRV realized market value ratio is an indicator used to evaluate the cryptocurrency market (especially Bitcoin). This indicator can help friends determine whether assets are overvalued or undervalued and identify potential tops and bottoms of market cycles.
MVRV > 1
When the ratio is greater than 1, it means that the market price is higher than the realized price, which means that most holders are in profit. This may indicate an overheated market, especially when MVRV reaches historical highs, which may indicate a market top.
MVRV < 1
When the ratio is less than 1, it means that the market price is lower than the realized price, which means that most holders are losing money. This may indicate that the market is undervalued, especially when MVRV reaches historical lows, which may indicate a market bottom.
7. Altcoin Seasonal Index 20 Is it in the Altcoin Season: No It has rebounded compared to yesterday
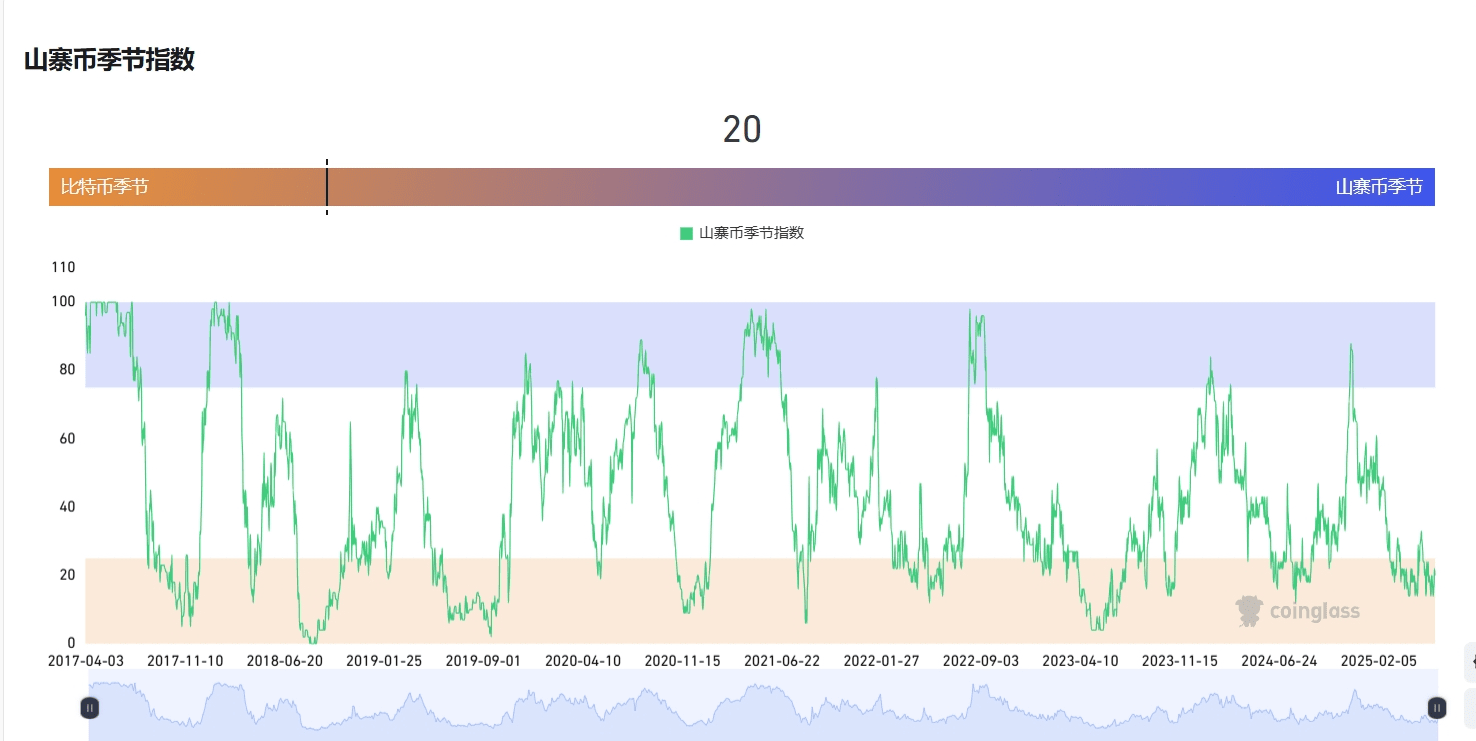
**Altcoin Seasonal Index Description: Altcoin Seasonal Index is an indicator used to measure the performance of non-Bitcoin in the cryptocurrency market. It is usually used to determine whether altcoins outperform Bitcoin in a specific time period, thereby helping investors understand market trends and investment opportunities.
8. US dollars flow into the cryptocurrency market. Small net inflows for three consecutive days
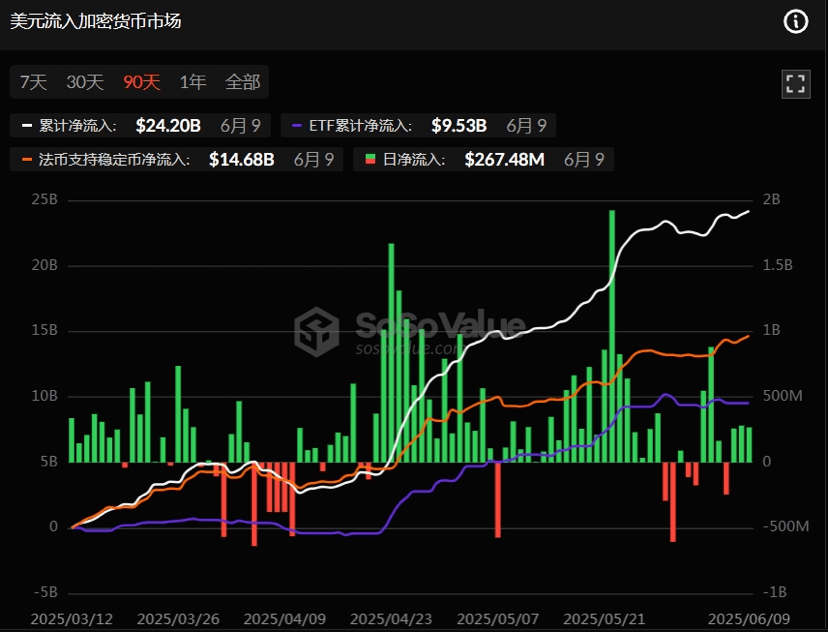
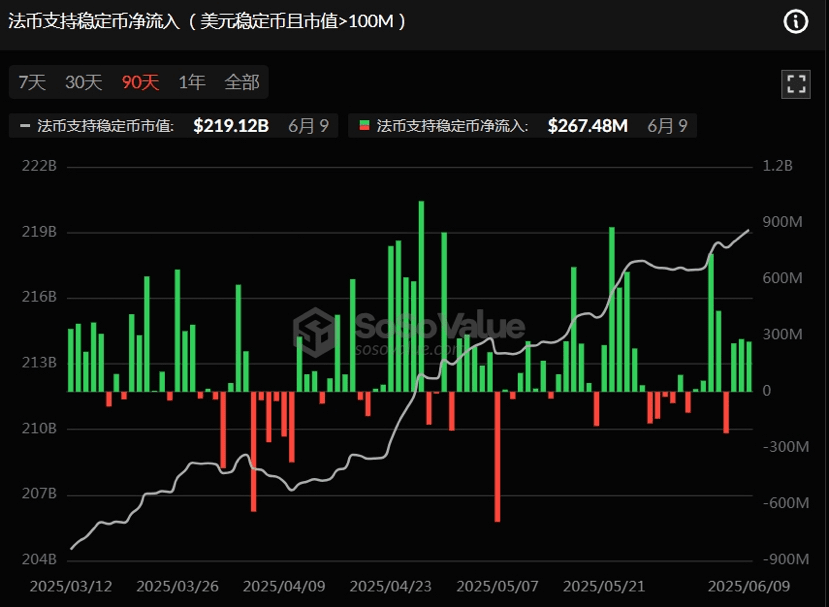
9. Net inflow of fiat-backed stablecoins (USD stablecoins with market value > 100M) There has been a small net inflow for three consecutive days
The above data only represents the prediction of BTC volatility trend and market sentiment from the perspective of on-chain data, and does not represent any investment advice. Please make your decision carefully! !

I am Mingzhu. Follow me and I will share real-time data and dynamics on the chain every day to help my friends predict and make decisions. Don’t miss the excitement. Welcome to leave a message for discussion.
