Below, follows the practical and strategic reading based on the visual indicators presented:
🎯 1. Short-Term Trend (EMA and Averages)
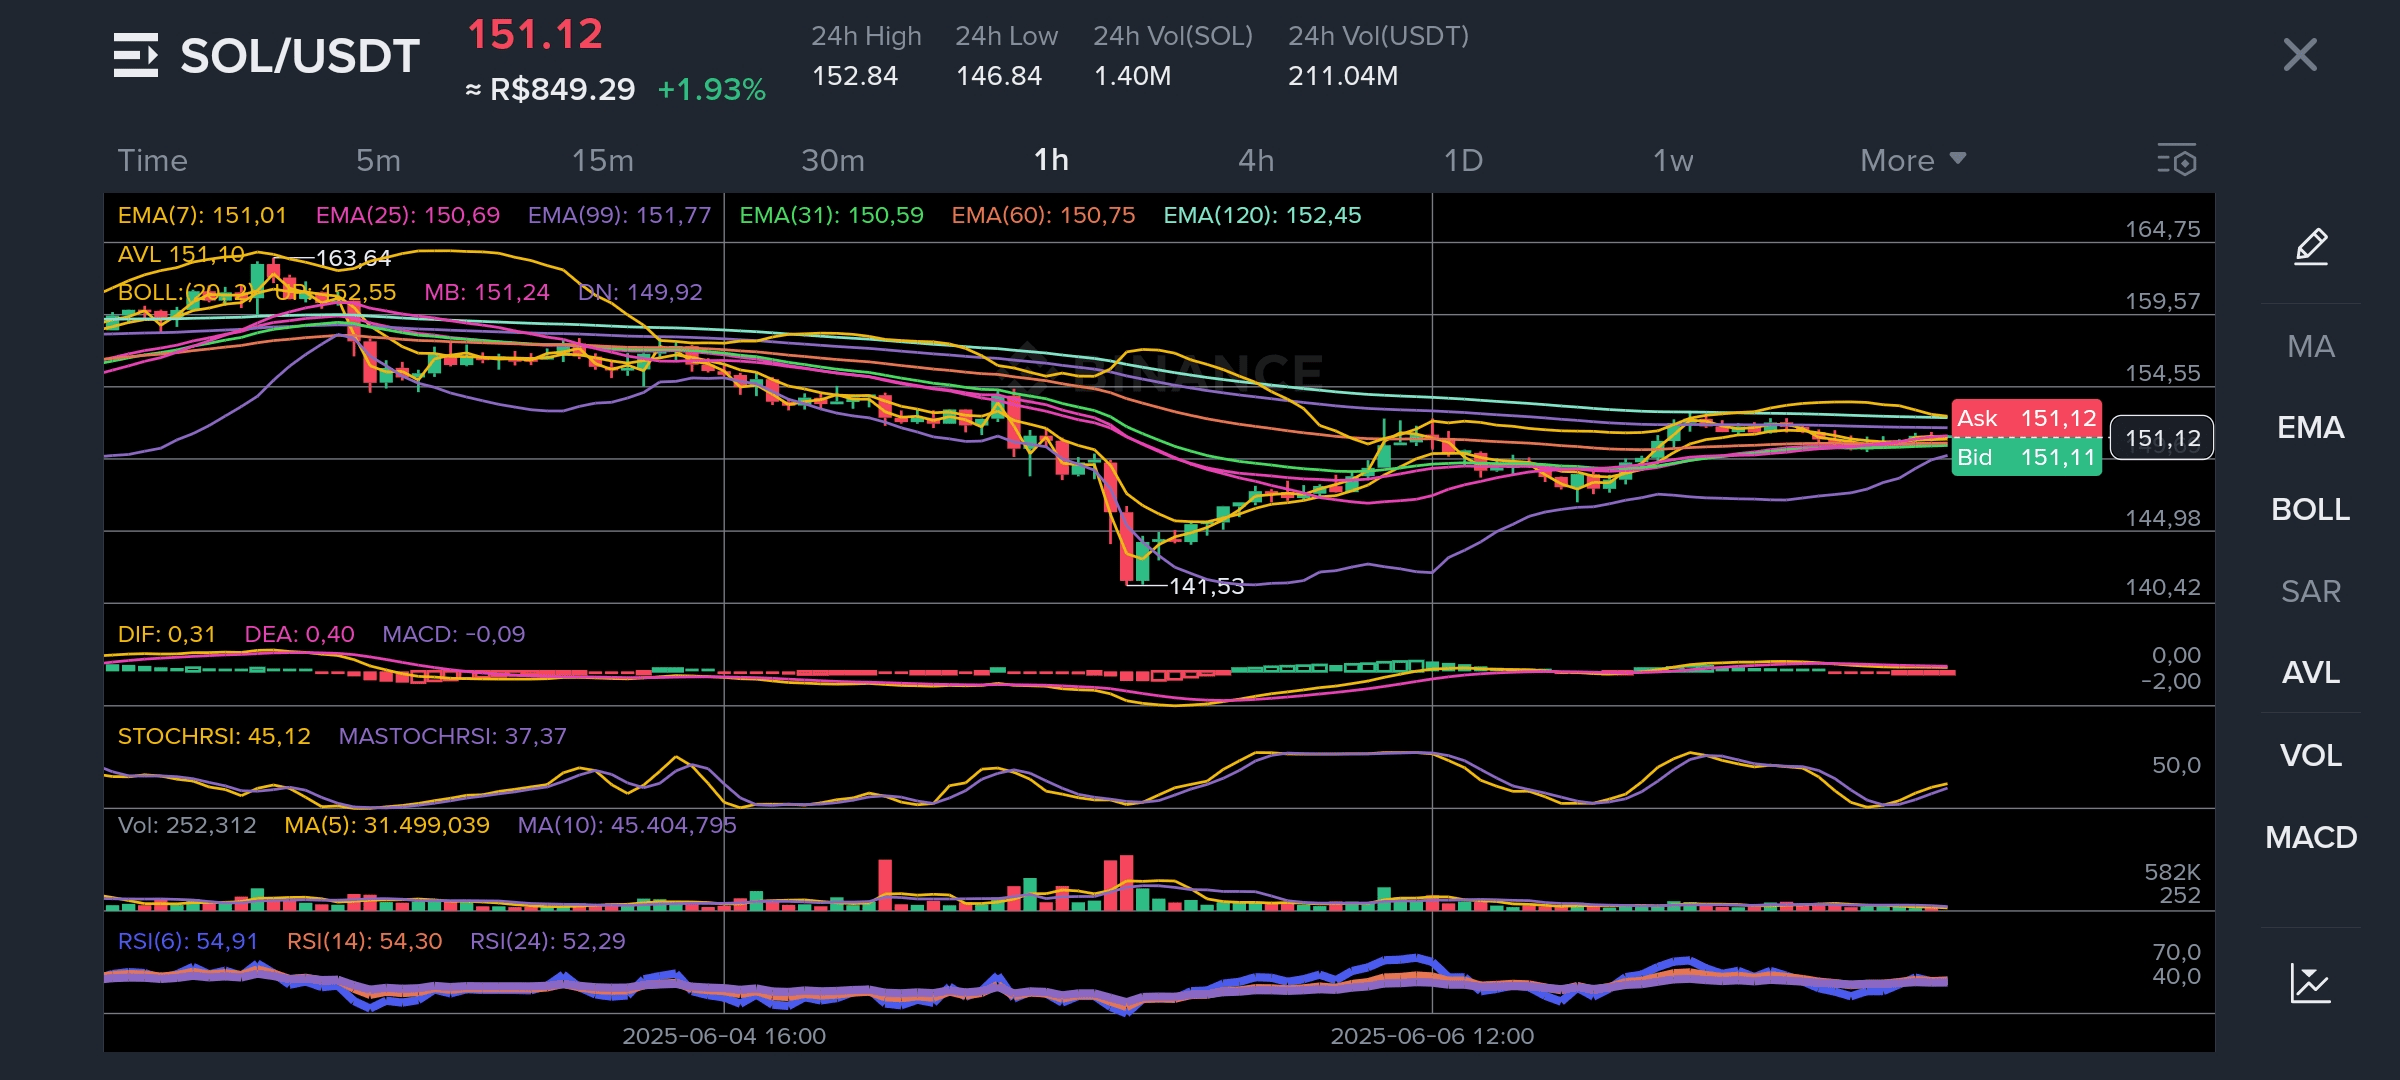
EMA(7) = 151.01 | EMA(25) = 150.69 | EMA(99) = 151.77 | EMA(120) = 152.45
The short averages are converging and crossing the longer averages from bottom to top, indicating a potential trend reversal to the upside.
The consolidation between 150.50 and 152.00 suggests accumulation. If it breaks the EMA(120) level with volume, we have a high probability entry.
🔍 Operational Insight:
> Waiting for confirmation of a breakout above 152.50 with increasing volume may offer an entry for scalp or short swing with a target at 154.50 – 159.50
📊 2. Bollinger Bands (Volatility and Compression)
MB (Middle) = 151.24 | Upper = 152.55 | Lower = 149.92
Relatively narrow bands = compression → signal that an explosive movement is approaching.
The price is ranging in the middle of the band, with a slight bullish bias.
💣 Explosion Setup:
> Bollinger Squeeze Strategy. If the candle closes above 152.55 with volume, it may indicate the start of a breakout with a target of 159.50.
📈 3. Momentum Indicators
✔ MACD:
MACD = -0.09 / DIF = 0.31 / DEA = 0.40
Signal line still above the MACD, but approaching. Shows a loss of selling strength and a possible bullish crossover on the way.
✔ RSI:
RSI(6) = 54.91 | RSI(14) = 54.30 | RSI(24) = 52.29
All RSIs are in neutral to slightly optimistic zone, indicating that there is still room for appreciation without being overbought.
✔ StochRSI:
STOCHRSI = 45.12 / MA = 37.37
Stochastic in recovery zone, but not in overbought. Potential for upward movement if the current pattern continues.
🔍 4. Volume and Average
Recent volume below the moving average (MA5 and MA10).
This confirms that the market is waiting for a decision – ideal for positioning before a breakout.
📊 Volume as Confirmator:
> Only enter if the volume exceeds 500k in the breakout candle. Volume is the direction validator.
🛠 Recommended Strategies
🟢 Bullish Scenario (Up)
Entry: Above 152.60 with a strong candle and volume.
Target 1: 154.50
Target 2: 159.50
Stop: Below 150.20
🔴 Bearish Scenario (Rejection)
Short entry: If it rejects 152.50 and loses 149.90.
Target: 146.80 → 144.00
Stop: Above 152.80
📌 Tactical Conclusion
The chart shows a technical compression scenario with explosive potential. The asset is on the radar for traders operating breakouts or reversals based on EMA + Bollinger + RSI/MACD. The key now is to wait for the trigger with volume above average.
