

Original text: In Gold We Trust, Incrementum
Compiled/Edited by: Yuliya, PANews
As the global political and economic order continues to be in turmoil, gold is returning to the center stage of capital markets. The 2025 annual report published by the gold investment company Incrementum points out that the world is currently undergoing a new round of financial restructuring, and gold, as a no-counterparty risk, non-inflationary monetary asset, is becoming increasingly strategically significant. From the deindustrialization of America and uncontrolled fiscal deficits to the rise of non-state credit assets like Bitcoin, and to the large-scale gold purchases by central banks, these trends collectively form the backdrop of the "Big Bull" pattern. This report analyzes the trends of the gold market, future expectations, the role of crypto assets in the new order, and potential structural inflation, dollar depreciation, and other risks, aiming to provide investors with a long-term robust gold investment framework.

Gold Fever: Returning from the Margins to the Mainstream
The report compares the current gold bull market to the opposite of the movie (The Big Short): against the backdrop of a global financial and monetary system reorganization, strategically investing in gold will yield considerable returns. Quoting Richard Russell: "No craze can compare to the gold craze."
For a long time, gold has been marginalized in the Western financial system, viewed as lacking yield and considered an outdated safe-haven tool. However, in recent years, the situation has begun to change.
Like the financial bubble depicted in (The Big Short), the gold market is also undergoing a transformation from the margins to the core. This trend, referred to as the "Big Bull" (The Big Long), symbolizes the long-term bull market in gold and reveals a revaluation of systemic risk in capital markets. In the current financial environment, investors are facing numerous critical questions:
Do sovereign bonds like those of the US and Germany still have safe-haven functionality?
Has dollar hegemony come to an end?
"MAG 7" valuations too high?
Has gold become too expensive?
The traditional view holds that gold prices are high and difficult to rise further. However, the report suggests that, on the contrary, we are currently in the mid-stage of a gold bull market, not the end.
Current State of the Gold Market
According to Dow Theory, a complete bull market can be divided into three phases: accumulation phase, public participation phase, and mania phase. Currently, gold is in the second phase, namely the "public participation phase." Typical characteristics of this phase include:
Media coverage is becoming increasingly optimistic
Speculative interest and trading volume are rising
New financial products are being launched
Analysts are raising price targets

In the past five years, global gold prices have risen by 92%, while the dollar's real purchasing power for gold has fallen by nearly 50%. According to the "Golden Decade" prediction in the 2020 (In Gold We Trust) report, today’s gold price trend is approaching the inflation scenario path, far exceeding the baseline scenario.

Data shows that last year, gold set 43 historical highs when priced in dollars, second only to 57 in 1979, and as of April 30 this year, it has set 22 new highs. Although it broke the $3,000 barrier, this round of increases is still considered moderate compared to historical gold bull markets.

Gold is breaking through absolute prices while also forming a technical breakthrough on a relative level (e.g., compared to stocks), indicating that a strong pattern of gold relative to traditional assets has been established. For investors already in gold, continuing to hold is a wise choice, while for newcomers, there is still attractiveness in entering now.
Although gold, as a non-productive asset, does not pay dividends, it typically outperforms income-generating assets like stocks and bonds during key market phases. Investors should appropriately consider the role of gold in asset allocation.
It is important to note that historical data shows that during bull markets, gold prices may experience corrections of 20% to 40%. For example, the price fluctuations after April 2 serve as a reminder, even though gold quickly recovered and set new highs thereafter. Particularly, assets like silver and mining stocks usually experience larger corrections. Therefore, investors need to maintain a consistent risk management strategy to cope with market volatility.


New Type of 60/40 Investment Portfolio
The report proposes a new type of 60/40 investment portfolio, which is a rethinking of the traditional 60% stocks/40% bonds allocation. The new asset allocation is as follows:
Stocks: 45%
Bonds: 15%
Hedge Gold: 15%
Performance Gold: 10%
Commodities: 10%
Bitcoin: 5%

This new type of investment portfolio reflects the authors’ views on the current market environment, particularly concerns over the loss of trust in traditional safe-haven assets like government bonds. The report argues that a distinction should be made between hedge gold and performance gold, with performance gold including silver, mining stocks, and commodities, which are considered to have significant potential in the coming years.
Key factors affecting gold
Geopolitical Restructuring
The global geopolitical landscape is accelerating its reorganization, which is favorable for gold. The report cites Zoltan Pozsar’s "Bretton Woods III" article published in 2022, indicating that the world is transitioning from "the gold-backed Bretton Woods era, to the Bretton Woods II backed by internal currency (US treasury bonds with confiscation risk that cannot be hedged), to the Bretton Woods III backed by external currency (gold and other commodities)."
Gold has three major advantages as an anchor of the new monetary order:
Gold is neutral, belonging to no nation or political party, and thus can serve as a unifying element in a multipolar world.
Gold has no counterparty risk and is pure property; nations can easily resolve confiscation risks by storing gold domestically.
Gold has high liquidity, with an average daily trading volume of over $229 billion in 2024. Research by the London Bullion Market Association (LBMA) indicates that gold sometimes has higher liquidity than government bonds.
Impact of Trump’s Policies
After Trump returns to the White House, he initiated a profound restructuring of the US and global economies. Trump gained a majority in the Senate and House of Representatives, combined with a Supreme Court dominated by the Republican Party, giving him enormous political power. His policy directions include:
1. Solving the problem of government over-indebtedness:
The DOGE (Department Optimization and Government Efficiency) plan initially aimed to save $1 trillion annually, equivalent to about 15% of Washington's spending.
Recently, Musk has significantly lowered expectations, now mentioning a savings potential of $155 billion.
The US is now paying over $1 trillion annually in interest on national debt, exceeding its generous defense budget.

2. Trade Policy Reform:
The new tariff policy announced on "Liberation Day" on April 2 raised the average tariff in the US to nearly 30%, significantly higher than the approximately 20% during the 1930 Smoot-Hawley Tariff Act period.
OECD data indicates that the US's reliance on China is about three times that of China's reliance on the US, considering that China's manufacturing base is also three times that of the US, indicating a more favorable position for China in this conflict.

3. Dollar Policy:
The Trump team believes that the high dollar value is one of the main reasons for the deindustrialization of America, planning to significantly devalue the dollar
While also hoping to maintain the dollar's status as the undisputed global reserve, transaction, and reserve currency
Trump threatened to impose a 100% tariff on countries that wanted to replace the dollar as the transaction currency

These policies may lead to a slowdown in the US economy, or even recession. According to the GDPNow indicator, the US economy has begun to contract. If this trend continues, the Federal Reserve will face greater pressure to loosen monetary policy more aggressively than currently priced.
Changes in European Monetary Policy
The report also points out that there has been a 180-degree shift in fiscal policy in Europe, particularly in Germany. Friedrich Merz (CDU), who is expected to become Germany's next Chancellor, proposed to exempt defense spending exceeding 1% of GDP from debt rule restrictions and create a €500 billion debt financing plan for infrastructure and climate protection. Predictions show that German government debt will rise from 60% of GDP to 90%.

This marks a historic moment for Germany: under the conservative CDU/CSU leadership, fiscal conservatism has been officially abandoned. The report describes this change as "monetary climate change." German government bonds reacted noticeably, experiencing the largest single-day fluctuation in 35 years after the announcement.

Central Bank Demand
Central bank demand is a key pillar of the "Big Bull". Since 2009, central banks have been net buyers in the gold market, and this trend has significantly accelerated since February 2022 when Russian currency reserves were frozen. For three consecutive years, central banks have increased their gold reserves by over 1,000 tons, achieving a special "hat trick."

According to data from the World Gold Council (WGC), global gold reserves reached 36,252 tons by February 2025. In 2024, gold's share in monetary reserves reached 22%, the highest level since 1997, more than double the low point of about 9% in 2016. However, it is still a long way from the historical peak of over 70% in 1980.

Asian central banks account for most of these purchases, but Poland became the largest buyer in 2024. Notably, despite significant purchases by China in recent years, its official gold reserve share is only 6.5%. In contrast, the gold proportions in reserves for the US, Germany, France, and Italy exceed 70%. Russia increased its share from 8% to 34% from 2014 to the first quarter of 2025.

Goldman Sachs, in its research report, assumes that China will continue purchasing gold at a rate of about 40 tons per month, meaning that the demand from the Chinese central bank will approach 500 tons annually, equivalent to nearly half of the total demand from central banks over the past three years.

Fiat currency continues to depreciate
The report emphasizes the monetary function of gold: unlike fiat currencies, the supply of gold cannot be arbitrarily expanded. Since 1900, the US population has grown 4.5 times (from 76 million to 342 million), while M2 money supply has grown 2,333 times (from $9 billion to $21 trillion), and per capita has grown over 500 times (from $118 to over $60,000). The report compares this to "the muscle inflation of a steroid athlete - impressive in appearance but structurally weak."
Growth in money supply is a long-term key driver of gold prices. In G20 countries, the average annual growth rate of M2 is 7.4%. After experiencing three years of sometimes negative growth, the money supply is now growing again. The report cites Larry Lepard’s work (The Big Print) believing that money supply growth will accelerate significantly, becoming another catalyst for the "Big Bull."

Gold as portfolio insurance
Gold performs exceptionally well during economic recessions and bear markets. The report analyzes 16 bear markets from 1929 to 2025, showing that gold outperformed the S&P 500 in 15 of these bear markets, with an average relative performance of +42.55%.

The report compares gold to the Italian defensive tactic "catenaccio" in football, possessing the defensive reliability of Giorgio Chiellini and the goalkeeping security of Gianluigi Buffon. When other investments are volatile, gold stabilizes the portfolio with predictable resilience.
Shadow Gold Price
The report retains the concept of "shadow gold price" (SGP), which refers to the theoretical gold price under the condition that the base money supply is fully backed by gold. The Bretton Woods Agreement calculated the exchange rate between the dollar and gold in this way: dollar monetary base divided by US gold holdings.
Calculated at current market prices:
If the dollar M0 is fully backed by gold, the gold price would need to reach $21,416.
If the Eurozone M0 is fully backed by gold, the gold price would need to reach about €13,500.
If the US M2 is fully backed by gold, the gold price would need to reach $82,223.
If Switzerland's M2 is fully backed by gold, the gold price would need to reach 29,101 Swiss francs.
Historically, partial coverage has been the norm:
The Federal Reserve Act of 1914 stipulated a minimum gold coverage ratio of 40%, requiring the gold price to rise to $8,566 to meet this requirement.
From 1945 to 1971, the requirement was 25% coverage, currently corresponding to a shadow gold price of $5,354 for M0.
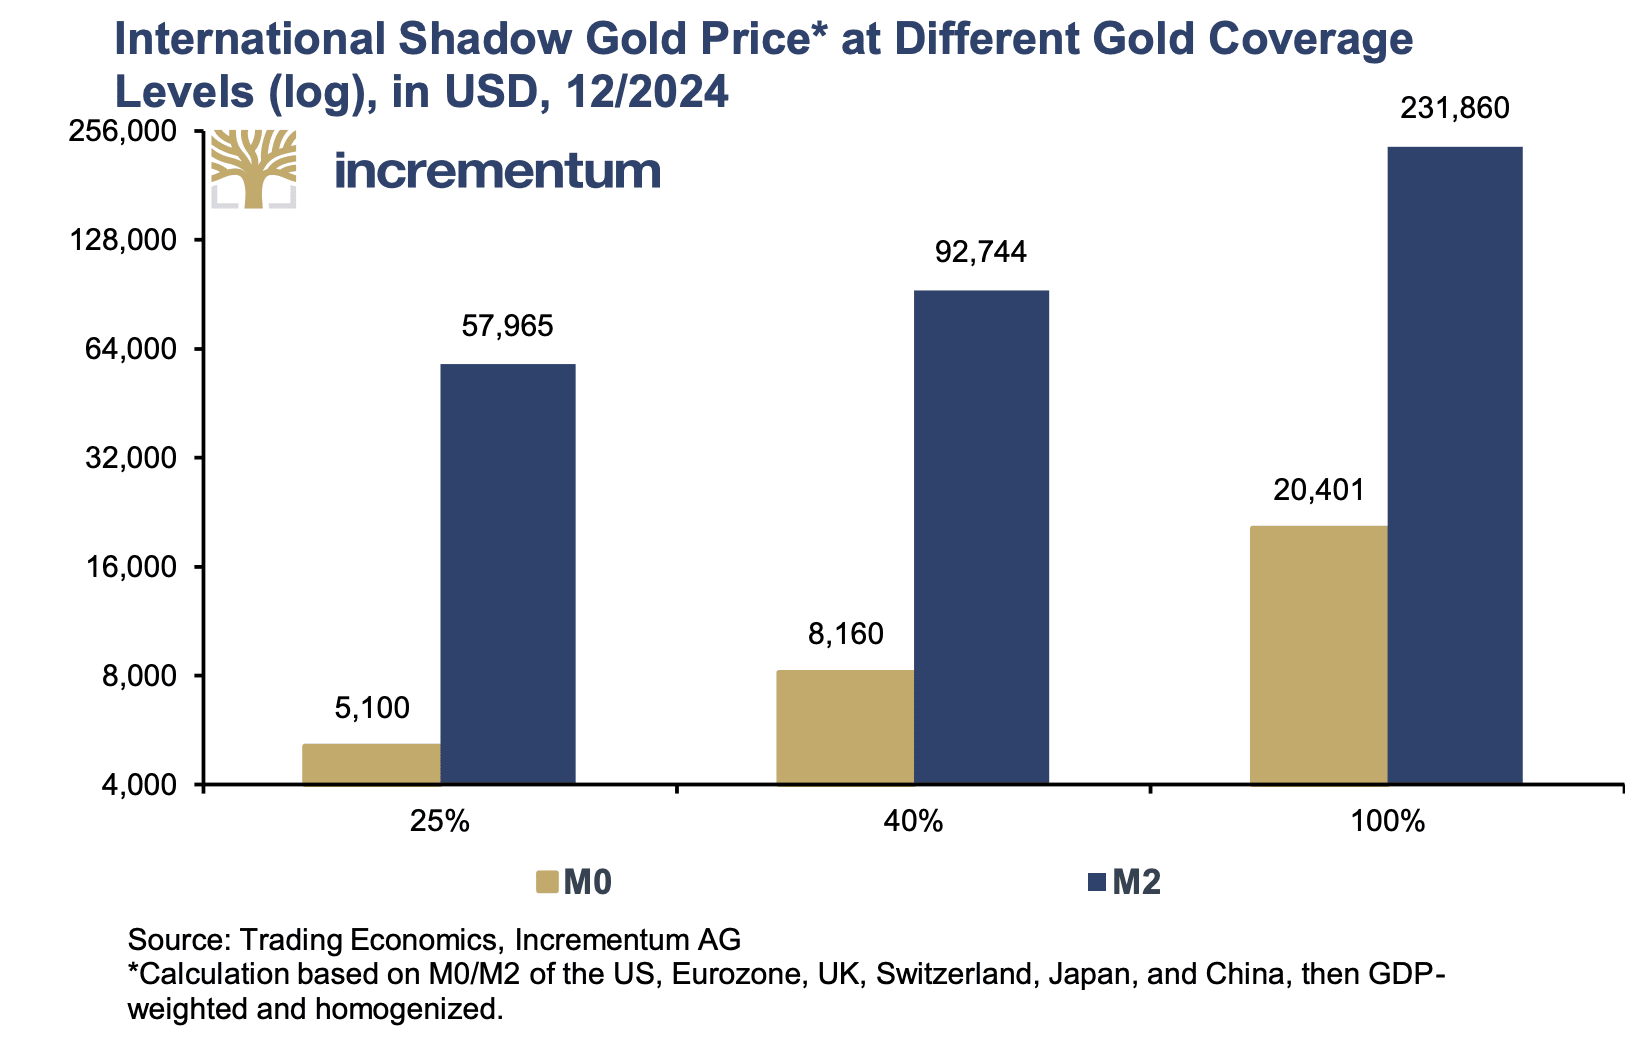
International shadow gold prices indicate how much the price of gold would reach if the monetary supply (M0 or M2) in major currency regions (United States, Eurozone, United Kingdom, Switzerland, Japan, and China) was backed by central bank gold reserves in proportion to their share in global GDP:
M0 25% Coverage: $5,100
M0 40% Coverage: $8,160
M0 100% Coverage: $20,401
M2 25% Coverage: $57,965
M2 40% Coverage: $92,744
M2 100% Coverage: $231,860
Currently, the gold coverage ratio of the US monetary base is only 14.5%, meaning that only 14.5 cents of each dollar is backed by gold, while the remaining 85.5% is "air".
During the gold bull market of the 2000s, the gold coverage ratio of the monetary base increased from 10.8% to 29.7%. To achieve a similar coverage ratio, the gold price needs to nearly double to over $6,000. Historically, the gold coverage ratio exceeded 100% in the 1930s, 1940s, and 1980s. The record value of 131% in 1980 corresponds to a current gold price of about $30,000.

Gold Price Prediction
The Incrementum gold price model proposed in 2020 predicts:
Base Scenario: By the end of 2030, gold prices are expected to be around $4,800, with a mid-term target of $2,942 by the end of 2025.
Inflation Scenario: By the end of 2030, gold prices are expected to be around $8,900, with a mid-term target of $4,080 by the end of 2025.
Currently, the gold price has exceeded the mid-term target of $2,942 for the base scenario by the end of 2025. The report believes that by the end of this decade, the gold price is likely to be between two scenarios, depending on the level of inflation in the next five years.

Inflation Risk Analysis
The report warns that the possibility of a second wave of inflation, similar to the 1970s, should not be ruled out. The similarities in current developments to those of the 1970s are striking.
In the coming months, the report still sees a primarily deflationary trend, especially due to the sharp drop in oil prices. The significant appreciation of major industrialized countries' currencies against the dollar further reinforces the deflationary effects in these countries.
However, this does not mean that inflation risks have been eliminated. While economic recession and capital market declines have deflationary or even disinflationary effects, the reaction will be highly inflationary. The Federal Reserve's strong response seems to be just a matter of time. Possible measures include yield curve control, a new round of QE or QQE, financial repression, further fiscal stimulus, up to MMT or helicopter money.
Quantitative analysis in the report shows that gold, silver, and mining stocks performed exceptionally well in a stagflation environment. During the stagflation periods calculated in the report, gold had an average annual real compound growth rate of 7.7%, silver at 28.6%, and the BGMI (Barron's Gold Mining Index) at 3.4%, while in the 1970s, these figures were 32.8%, 33.1%, and 21.2% respectively.
"Performance Gold" investment opportunities
Even as gold slowly returns to the spotlight, the massive gold rush among Western financial investors is still a long way off: in the first quarter of 2025, gold ETFs recorded $21.1 billion in inflows, the second highest in history. However, due to the significant rise in gold prices, this inflow, when measured in tons, ranked only as the tenth highest quarter in history.
Meanwhile, inflows into gold ETFs are still far below those of stock and bond ETFs, with stock ETF inflows being 8 times that of gold ETFs, and fixed income ETF inflows being 5 times that of gold ETFs.
Reviewing the performance of silver and mining stocks in the 1970s and 2000s shows they have significant catch-up potential in the current decade. Market dynamics indicate that gold usually leads the rally, followed by silver, mining stocks, and commodities, akin to a relay race pattern.

Bitcoin
Bitcoin may benefit from the current reorganization of the world order. Against the backdrop of escalating geopolitical tensions, the advantages of Bitcoin as a decentralized cryptocurrency seem evident. Due to its independence from state control and cross-border transaction capabilities, Bitcoin indeed provides an alternative to traditional currencies. With the introduction of strategic Bitcoin reserve laws, the US is also entering the competition for digital gold at the national level.
As of the end of April, the market value of all mined gold is about $23 trillion (217,465 tons, priced at $3,288 per ounce). In contrast, Bitcoin's market value is about $1.9 trillion (priced at about $94,200), equivalent to about 8% of gold's market value.
The report believes that by the end of 2030, Bitcoin could reach 50% of gold's market value. Assuming a conservative gold price target of around $4,800, Bitcoin would need to rise to about $900,000 to reach 50% of gold's market value. This may be ambitious, but ultimately aligns with the historical performance of both assets.
The report notes that having competitors for gold in the non-inflationary asset space is not necessarily a disadvantage. According to the saying of "competition stimulates business", more and more investors may realize that a combination investment of gold and bitcoin outperforms each individual investment on a risk-adjusted basis. The report's long-held belief is: "Gold for stability, Bitcoin for convexity."

Comparison of key indicators in the gold market from 1980, 2011, and the present
The report compares various macro and market key indicators from 1980, 2011, and the present, confirming the "Big Bull" argument: there is still room for gold prices to rise. Notably, the current significantly higher dollar index—about 100 points—is well above the level during the last secular high of gold.
 Potential Risk Factors
Although the long-term upward trend is intact, the report points out several factors that could lead to short-term adjustments:
Central banks as a key risk: A sudden decline in central bank demand from the current average level of 250 tons per quarter could reduce structural demand.
Investor de-leveraging and position reduction: The widespread sell-off after the April Liberation Day indicates how quickly speculative positions are being reduced.
Geopolitical premium reduction: An agreement in the Ukraine war, easing of Middle Eastern situations, or a rapid end to trade wars, especially with China, would significantly reduce the corresponding geopolitical premium.
US economy stronger than expected: A strong US economy may prompt the Federal Reserve to tighten rates.
High-tech and sentiment-driven risks: Sentiment is bullish, with positions being extreme in some cases.
US dollar strengthening: The dollar is short-term oversold, with sentiment extremely negative.
The report suggests that the short-term market situation is tense, and gold prices may pull back to around $2,800 in the near term, or even enter sideways consolidation. This adjustment may be part of the bull market consolidation process and does not pose a threat to the medium to long-term upward trend of gold.

Conclusion
The report believes that the gold bull market has not ended and is currently in the mid-stage of public participation. Gold is shifting from being viewed as an outdated relic to a key asset in investment portfolios, providing both defensive stability and offensive potential. The report compares gold to the "Michael Jordan" of assets, stable in defense and powerful in offense—a true game changer.
The long-term rise in gold is based on several mutually reinforcing pillars:
The global financial and monetary system is inevitably undergoing a profound reorganization in the face of deep political and economic turmoil.
Inflation tendencies of governments and central banks—monetary climate change
Economic rise in regions favorable to gold, especially in Asia and the Arab world
Capital is shifting away from US assets (dollars, US stocks, US treasury bonds), which have overshadowed gold for years.
"Performance Gold" (i.e., silver, mining stocks, and commodities) is expected to yield excess returns.
The report points out that the current rise in gold prices may not only reflect a crisis but may also be the first herald of a "black swan moment": in the whirlpool of global turmoil, gold is sending a rare but extremely positive signal. As the existing monetary system increasingly loses credibility, the likelihood of gold regaining its traditional role as a monetary asset is growing, potentially emerging as a supranational settlement asset—not as a tool of political power but as a neutral, debt-free basis for trade, exchange, and trust.
As traditional safe-haven assets such as US or German government bonds lose trust and undermine their stabilizing function, gold is becoming the core of long-term investment strategies once again. During periods of geopolitical and economic turmoil, gold is proving itself to be a reliable safe-haven asset.
