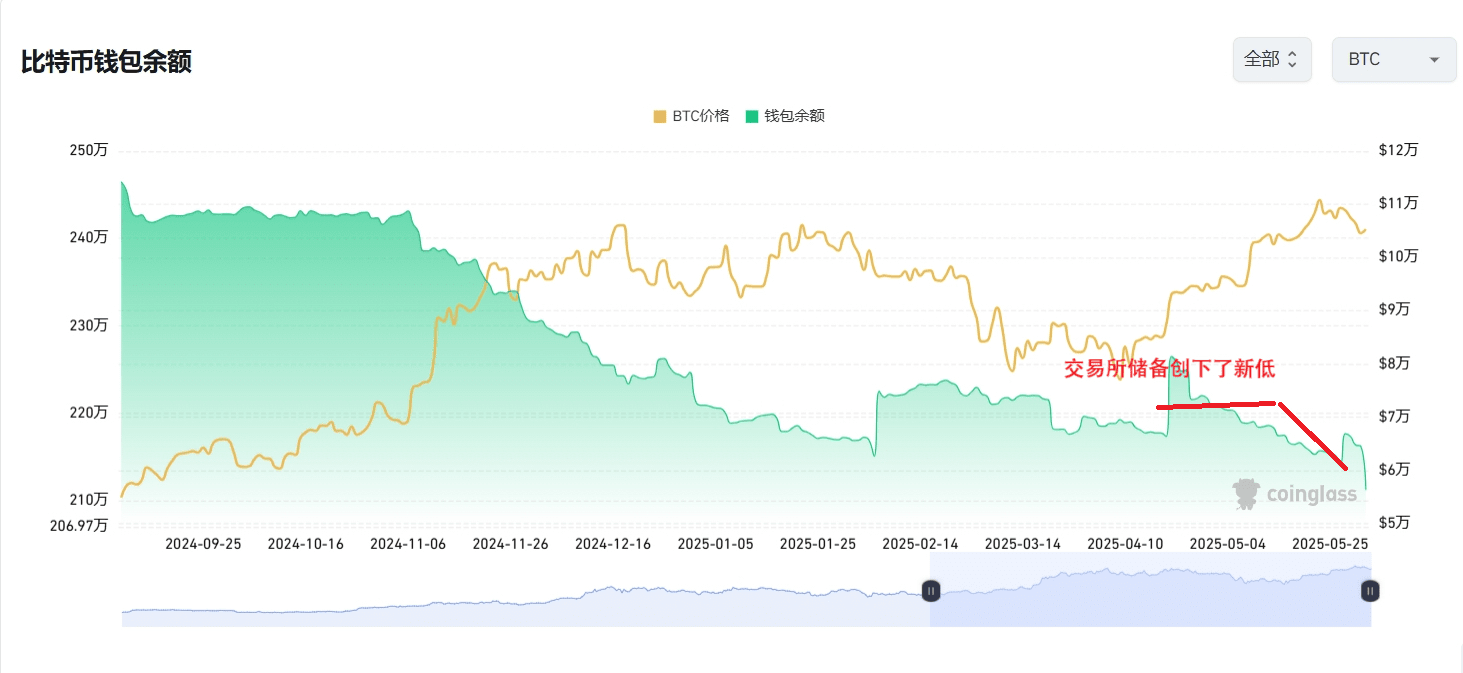
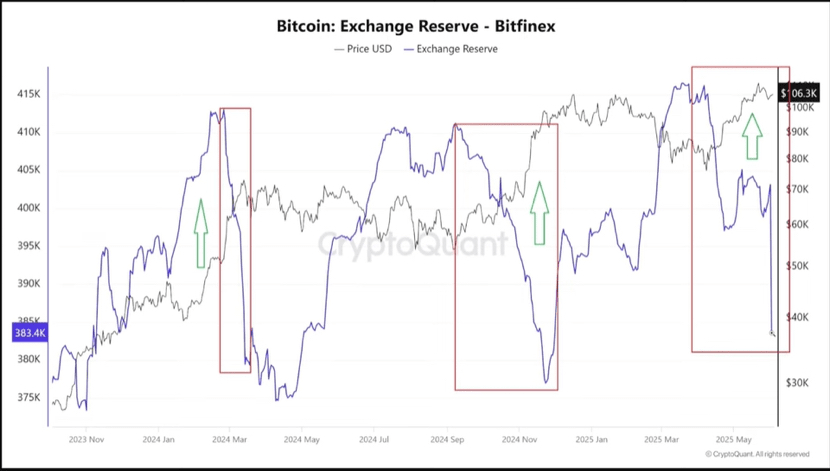
Special reminder: Bitcoin 106500 key level blocked! Suddenly, large whales appear to withdraw large amounts from exchanges, and spot reserves of BTC and ETH across major exchanges have reached new lows!!! Everyone needs to pay special attention... This has only happened twice in history! BTC and ETH exchange reserves hit new lows!
Exchange BTC, ETC inflow and outflow BTC, ETH have seen significant outflows from exchanges, reaching new lows
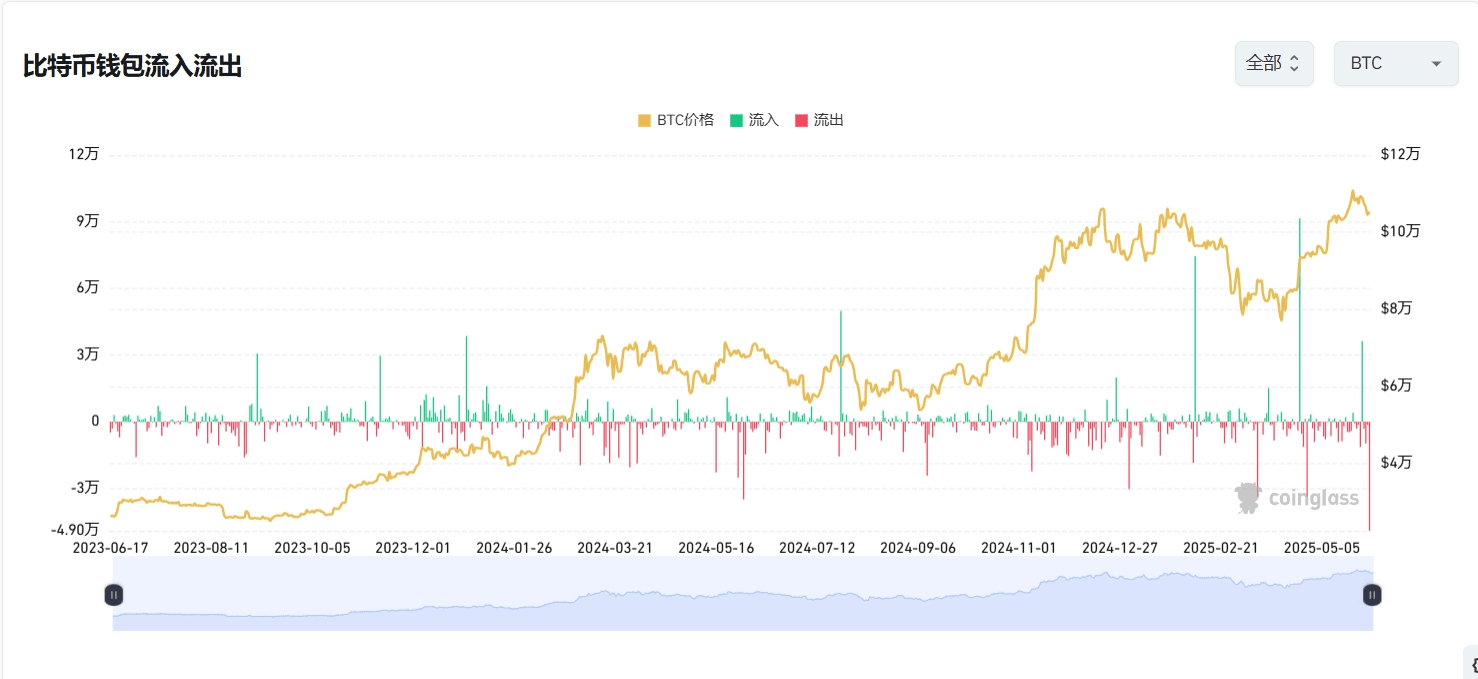
The impact of BTC inflow and outflow on coin price during various historical periods
**Interpretation of BTC, ETH inflow and outflow data
The BTC inflow and outflow of exchange wallets is a core on-chain indicator of the crypto market, directly reflecting the movement of major funds and market sentiment.
Inflow ↑ Holders deposit BTC into exchanges, selling pressure expectation increases, warning of short-term declines
Outflow ↓ Holders withdraw BTC from exchanges, accumulation/locking willingness increases, indicating bullish sentiment in the medium term
1. Greed and fear index Today: 57 Neutral
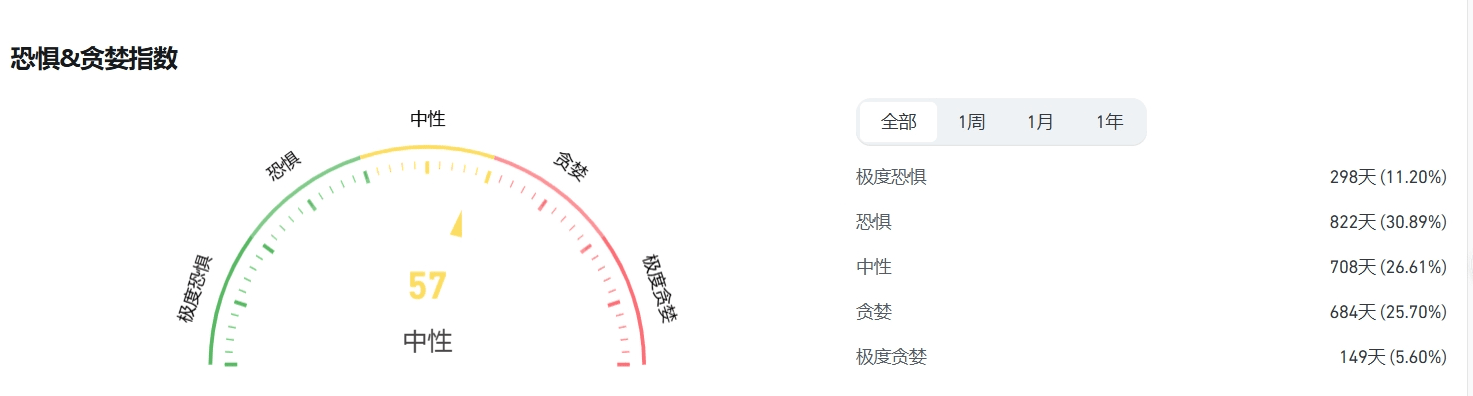
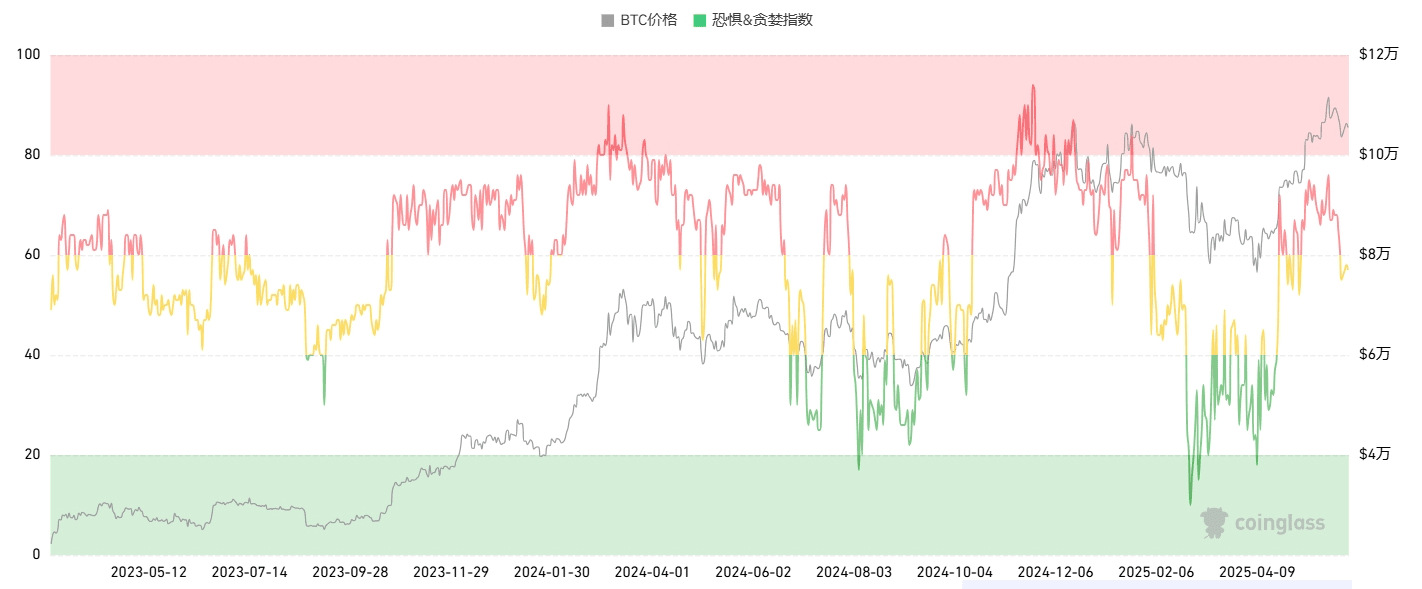
**Interpretation of the greed and fear index
The behavior of the cryptocurrency market is very emotional. When the market rises, people tend to be greedy, feeling fear of missing out; when the market falls, they irrationally sell their cryptocurrencies.
Using the fear and greed index, help friends make irrational judgments as little as possible, free from emotional influences.
There are two states:
Extreme fear indicates that investors are overly worried, which may be a buying opportunity.
Excessive greed indicates that investors are overly excited, and the market may undergo a correction.
2. Bitcoin total market share 62.47 slightly adjusted from yesterday
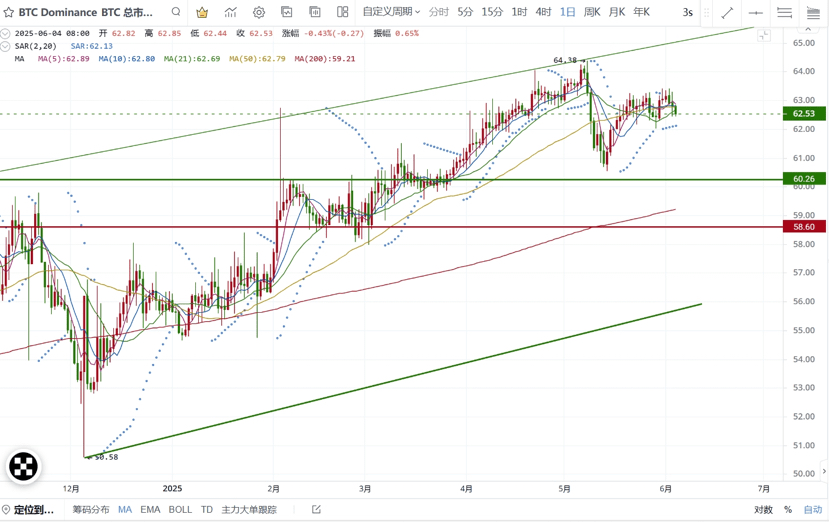
**Bitcoin's total market share is a core indicator for measuring Bitcoin's relative influence in the entire cryptocurrency market. This indicator reflects not only Bitcoin's short-term market position but also reveals changes in fund rotation, investor sentiment, and macro trends.
Bitcoin's market share is the "weather vane" for determining market phases:
Early in the bull market: Market share rises, funds prioritize allocation to Bitcoin.
Late in the bull market: Market share declines, funds rotate to altcoins, triggering the "altcoin season"
Market thermometer: >60% = Risk-averse dominance; <40% = Altcoin frenzy.
Capital flow chart: Reveals the allocation preferences of institutions and retail investors (Bitcoin → stable, altcoins → high risk high return)
3. Bitcoin and Ethereum trading pair 0.025336 Ethereum against Bitcoin trading pair continues to strengthen
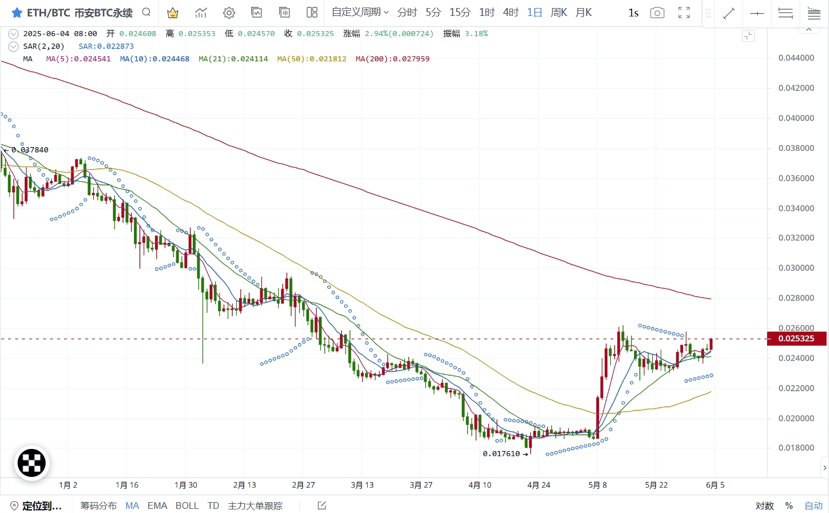
**The Bitcoin/Ethereum trading pair is the "risk thermometer" of the cryptocurrency market:
Ratio rises → Market prefers high-risk assets (altcoin season starting signal);
Ratio decreases → Funds are seeking safety in Bitcoin (characteristics of bear market or early bull market).
4. ETF inflow and outflow data ETF data changes outflow to net inflow
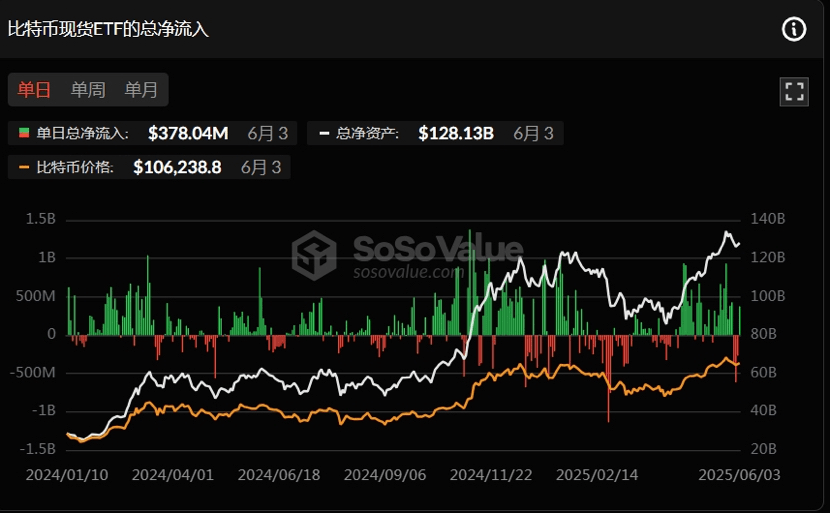
**Explanation of ETF inflow and outflow data: The inflow and outflow data of Bitcoin ETFs are core indicators for tracking institutional sentiment, market trends, and fund rotation.
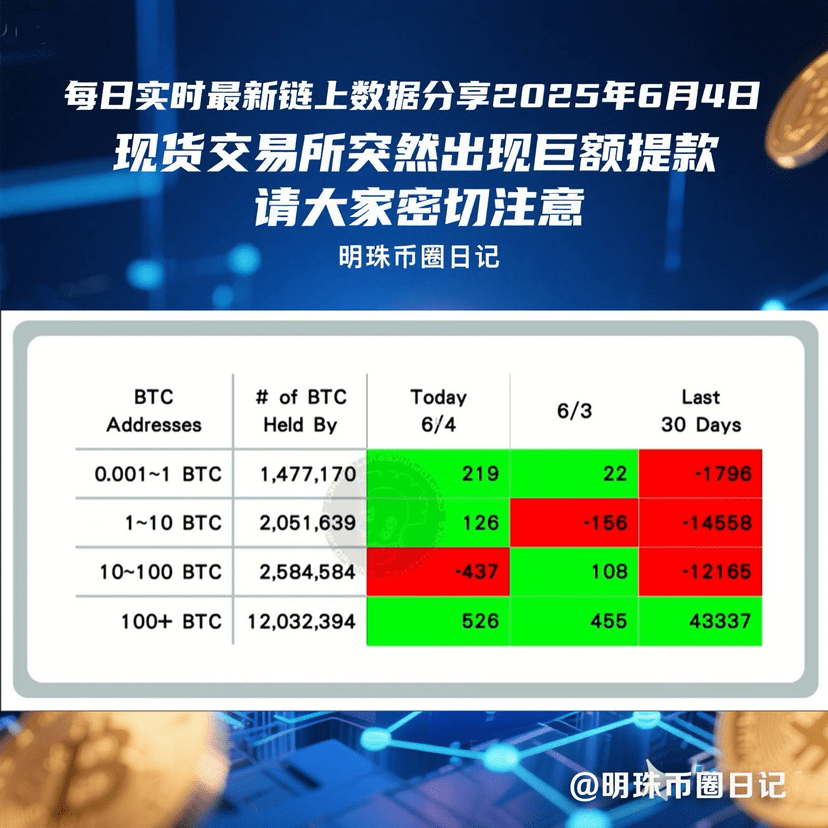
5. Statistics of on-chain BTC retail, large holders, and institutional buy and sell data Large whales with small inflows
Thanks to @TradingPunk for data organization and sharing
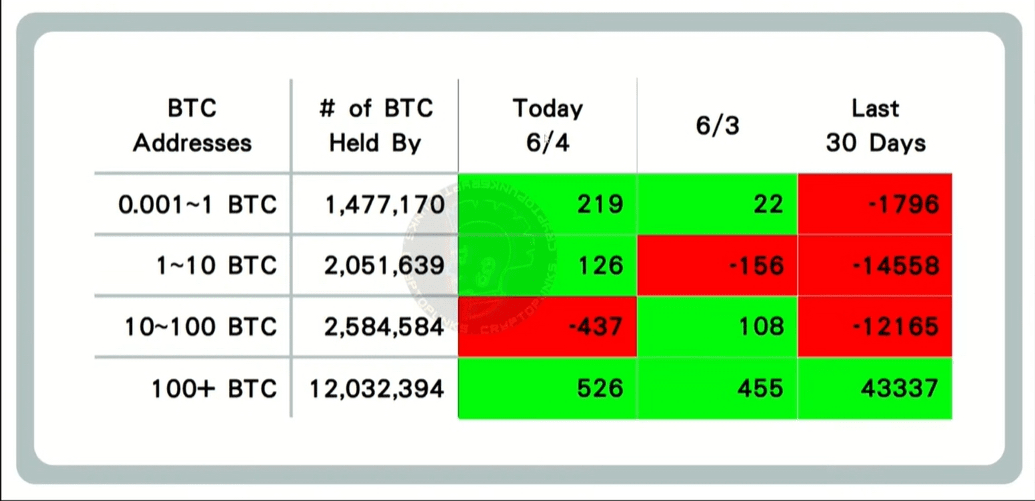
Data explanation: Represents the increase or decrease of on-chain flows for ≤ 1 BTC, 1–10 BTC, 10–100 BTC, 100+ BTC. This data can reflect a kind of market sentiment among retail investors, large holders, and institutions.
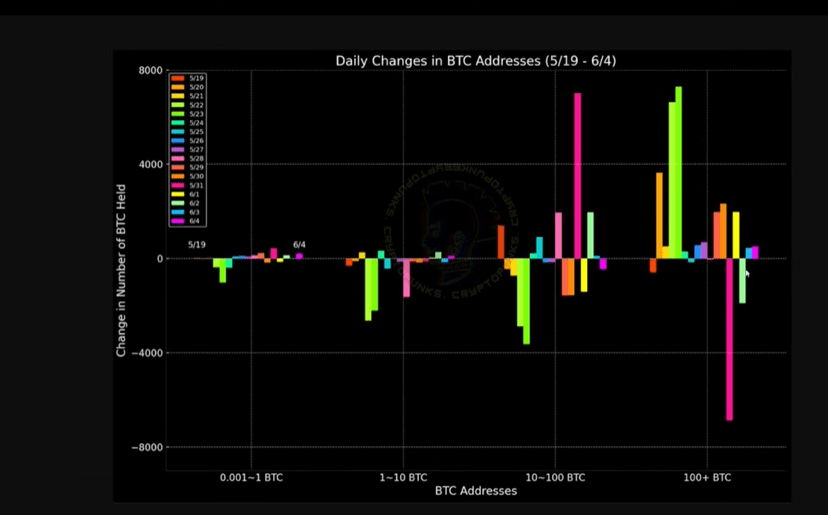
Data explanation: This data reflects the increase or decrease of on-chain flows for ≤ 1 BTC, 1–10 BTC, 10–100 BTC, 100+ BTC in one week. This data can intuitively reflect the flow trends of BTC for retail investors, large holders, and institutions in the market.
When extreme situations occur in on-chain data, reversals often happen (e.g., if large whales with over 100 BTC appear and buy a lot while others are selling, the probability of Bitcoin rising significantly increases, and conversely, the probability of falling increases significantly). This should also be analyzed in conjunction with other on-chain data and technical indicators.
6. MVRV realized market value ratio MVRV > 1
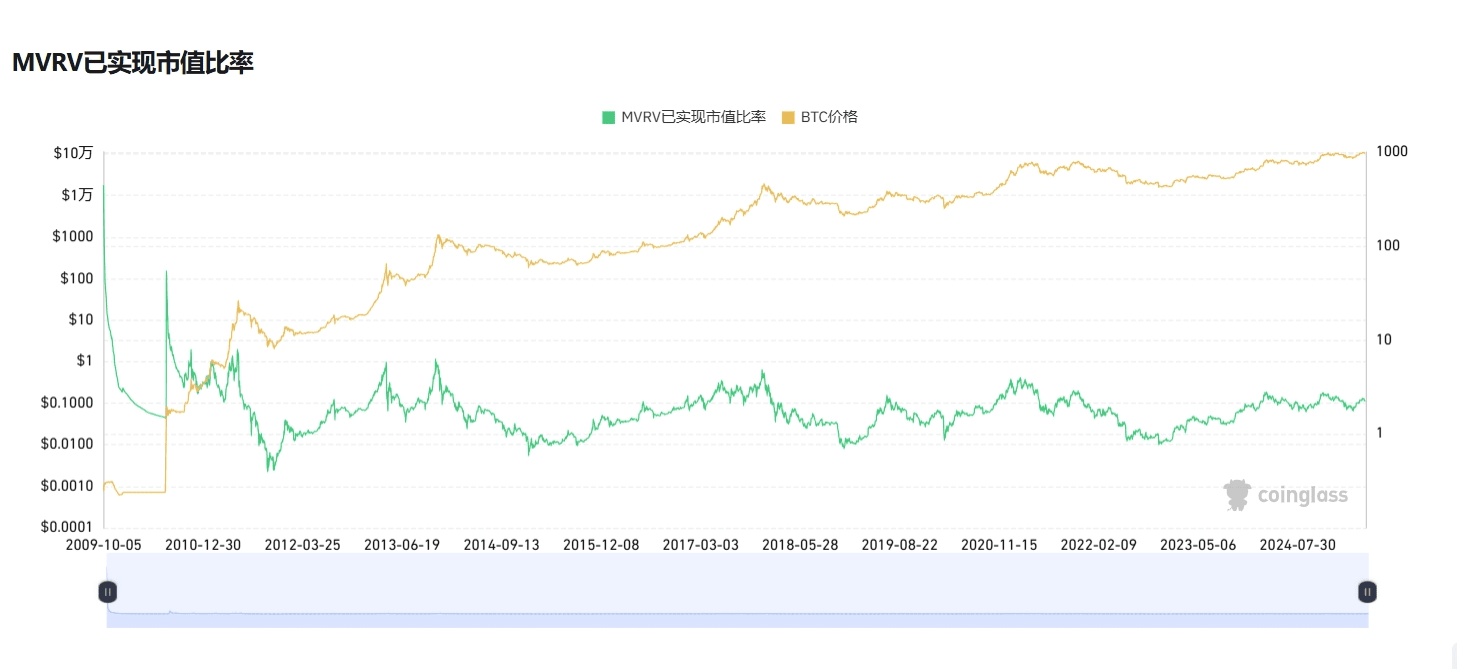
**MVRV realized market value ratio indicator explanation: MVRV realized market value ratio is an indicator used to assess the cryptocurrency market (especially Bitcoin), which can help friends determine whether assets are overvalued or undervalued and identify potential market tops and bottoms.
MVRV > 1
When the ratio is greater than 1, it indicates that the market price is above the realized price, meaning that most holders are in a profit state. This may indicate that the market is overheating, especially when MVRV reaches historical highs, which may signal a market top.
MVRV < 1
When the ratio is less than 1, it indicates that the market price is below the realized price, meaning that most holders are in a loss state. This may indicate that the market is undervalued, especially when MVRV reaches historical lows, which may signal a market bottom.
7. Altcoin season index 16 Is it altcoin season: No Continuing to weaken
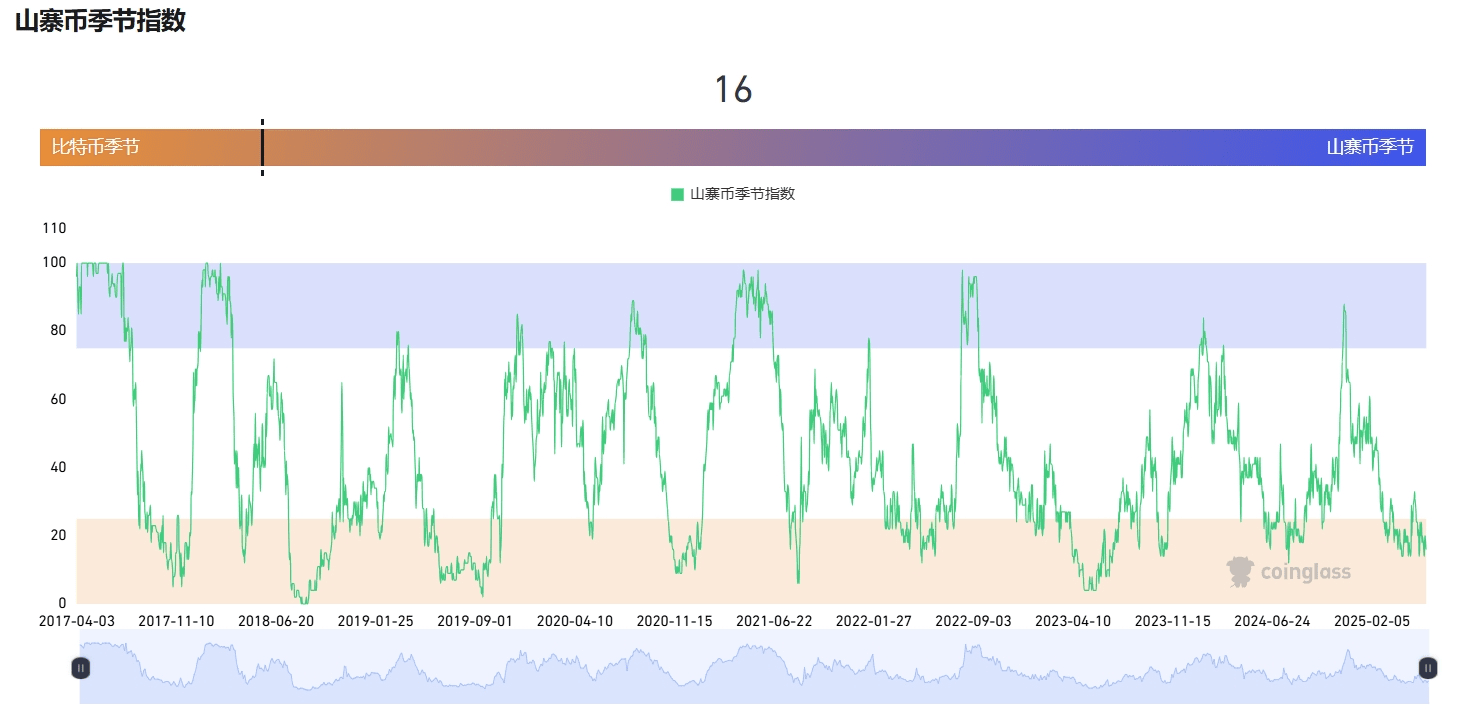
**Altcoin season index explanation: The altcoin season index is an indicator used to measure the performance of non-Bitcoin assets in the cryptocurrency market. It is usually used to determine whether altcoins are performing better than Bitcoin over a specific time period, helping investors understand market trends and investment opportunities.
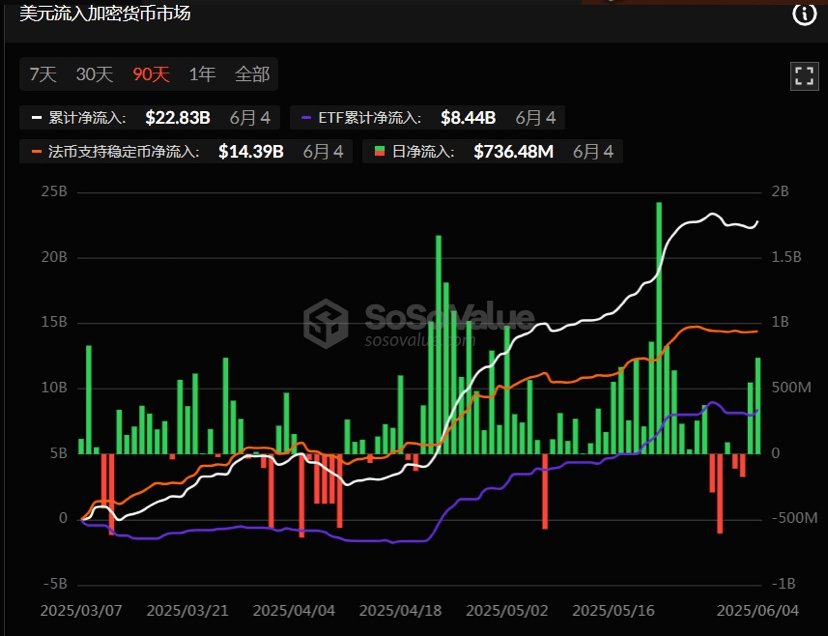
8. US dollar inflow into the cryptocurrency market net inflow
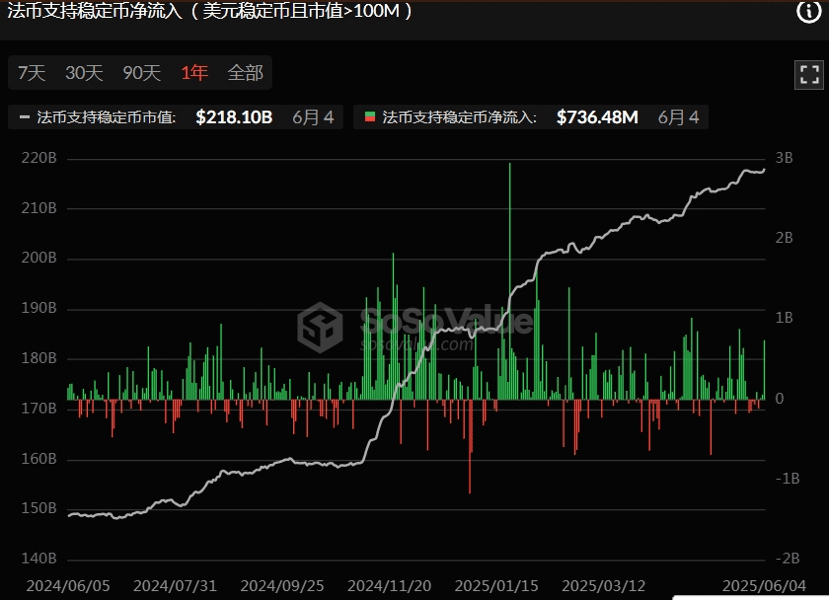
9. Fiat-backed stablecoin net inflow (USD stablecoin and market cap > 100M) net inflow
The above data only represent the perspective of on-chain data to predict BTC volatility trends and market sentiment, and do not constitute any investment advice, please make decisions carefully!!
I am Mingzhu, follow me, I share real-time on-chain data and trends daily to help friends predict decisions, don't miss the excitement, welcome to leave comments for discussion.