What Is a Pullback?
A pullback is a brief decline or pause in a generally upward price trend of a stock or other asset. Investors who are confident that the pullback will be brief use it as a buying opportunity. A pullback can occur for many reasons, some of which are unrelated to the fundamentals of the stock.
Technical analysts, who track the price movements of stocks to establish trends, identify the "support level," or lowest price that a stock is likely to reach before buyers step back in.
Key Takeaways
A pullback is a temporary reversal in the upward price trend of a stock or other investment.
A pullback typically lasts only a few consecutive sessions.
Pullbacks can provide an entry point for new investors when other technical indicators remain bullish.
Investors can use limit orders or stop entry orders to take advantage of a pullback.
What Does a Pullback Tell You?
A pullback is similar to a retracement or consolidation, and the terms are sometimes used interchangeably. The term pullback is usually applied to short-lived price declines—only a few consecutive sessions—before the uptrend resumes.
Pullbacks are widely seen as buying opportunities if the stock has been showing a generally upward price movement.
For example, many stocks experience a significant increase after a positive earnings announcement, followed by a sharp pullback as traders sell shares to take profits. Others step in to buy, seeing the positive earnings as a fundamental signal that the stock will resume its uptrend.
Most pullbacks end when the stock's price drops to a level of technical support, such as a moving average, pivot point, or Fibonacci retracement level. Traders carefully watch these movements, because a breakdown from the support levels could signal a reversal rather than a pullback.
Example of How to Use a Pullback
Pullbacks don’t change the underlying fundamental narrative that is driving the price action on a chart. They are usually profit-taking opportunities following a strong run-up in a security’s price.
For example, a company may report blow-out earnings and see shares jump 20%. The stock may experience a pullback the next day as short-term traders lock in profits by selling some of their shares.
However, the strong earnings report suggests that the business underlying the stock is doing something right. Buy-and-hold traders and investors will likely be attracted to the stock by the strong earnings reports, supporting a sustained uptrend in the near term.
Every stock chart has examples of pullbacks within the context of a prolonged uptrend. While these pullbacks are easy to spot in retrospect, they can be harder to assess for investors holding a security that’s losing value.
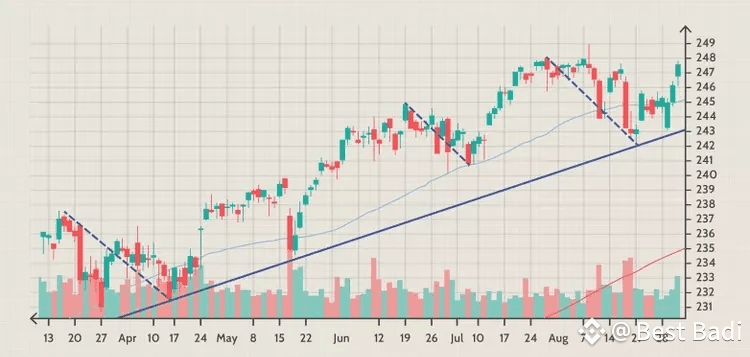
In the example above, the SPDR S&P 500 ETF (SPY) experiences four pullbacks within the context of a prolonged trend higher. These pullbacks typically involved a move to near the 50-day moving average, where there was technical support, before a rebound higher.
Traders often check several different technical indicators when assessing pullbacks to ensure that they're unlikely to turn into longer-term reversals.
The Difference Between a Reversal and a Pullback
Pullbacks and reversals both involve a security moving off its highs, but pullbacks are temporary and reversals are long-term.
So how can traders distinguish between the two? Most reversals involve some change in a security’s underlying fundamentals that force the market to re-evaluate its worth.
For example, a company may report disastrous earnings that make investors recalculate the stock’s net present value. Or, a competitor could release a superior product. Many events can have a long-term impact on the company underlying the stock.
These events will appear over several sessions and initially will look like a pullback.
Fast Fact
Traders use moving averages, trendlines, and trading bands to flag the point at which a pullback could continue, and enter reversal territory.
Limitations in Trading Pullbacks
There's no perfect method to distinguish a pullback from a reversal. For a few critical sessions, they look identical.
If the price action breaks the trendline for your time frame, you may be looking at a reversal rather than a pullback.
This is not the time to enter a bullish position. Of course, adding other technical indicators and fundamental data scans to the mix will increase a trader's confidence in distinguishing pullbacks from true reversals.
How Can I Tell if a Stock Price Decline Is a Pullback or a Reversal?
The first place to look is at the fundamental story behind the uptrend. Presumably, you had reasons to buy shares of that stock. Are those reasons still good?
Was the price decline caused by negative news about that company? Or did the stock just get caught in an overall market decline?
You can also monitor key technical support levels to see if they hold. If the price continues to decline, you might be looking at a more significant correction or even a reversal.
How Can Investors Take Advantage of a Pullback?
Look at the fundamental story underpinning the uptrend. If nothing serious in the way of bad news has hit the security, you're likely looking at a mild pullback.
Traders can use a variety of orders to take advantage of short-lived price drops. They can buy shares immediately using a buy market order or put in a limit buy order that will be triggered at a lower price.
In case prices move higher, traders can place a stop buy entry order at a level above the current price.
How Can I Tell If an Uptrend is Ending or Simply Undergoing a Pullback?
Double-check to make sure nothing has changed in the fundamental picture of the underlying stock.
Next, take a look at trend and momentum indicators (e.g., relative strength index or RSI, average directional index or ADX, moving average convergence divergence, or MACD) to see if they're turning lower, potentially signaling a more significant decline.
If either of these conditions is met, take a step back and consider whether the uptrend has hit a significant high and tighten up your stop-loss sell order to minimize potential further losses.
The Bottom Line
Pullbacks are a normal part of any sustained uptrend. They can be triggered by profit-taking after a sudden surge higher in the price of a security, or minor negative news about the underlying security. Or maybe it's just a bad day on Wall Street for all concerned.
Trend-following traders frequently use pullbacks to get in on the dominant uptrend or to buy more shares of a long-term winner. They can do this through buy limit orders, stop buy entry orders, or just a plain market order if they prefer to jump right in.
